Socializing Habits of Young Hungarian People in Transylvania—Media-Psychological Analysis ()
1. Theoretical Introduction
According to Erik H. Erikson’s crisis theory, an adolescent person is in the phase of the identity crisis. At this age, the person who we face is no longer a child, but not an adult either.
Talking about Erikson’s crisis formulation, we should not think of a disaster, but a turning point of a life stage. In his personality development model, Erik Erikson considers the adolescence to be a critical stage of life; a developmental crisis that is quite important for the evolution of identity (Amaryl et al., 2014: p. 174) .
The challenge is great: self-improvement and finding the “new myself”. If a young person is able to find it, this will be a good foundation for further life stages in order to form a healthy personality.
The research was inspired by media-psychological surveys in the Hungarian language (Csaba et al., 2014, 2016; Csaba, 2015, 2016) . However, I also kept in mind the media-psychology international outlook (Giles, 2003, Barker, 2009, Twenge, 2013) .
2. General Description of the Analysis
The purpose of this research was the very thorough monitoring of students’ between 11 and 18 years (living in Mureș, Cluj, Brașov and Harghita Counties) active media consumption habits. 206 individuals participated in this research during 2017-2018 school year, through an electronic questionnaire.
3. Hypotheses
· They use media tools mostly to access social networks,
· For chatting and dating they use Facebook;
· Making friends and flirting in everyday life is supplemented with the one on the media platforms, or it can even replace it;
· Respondents do not pay attention to the protection of their personal data.
4. Presentation of the Population
The gender distribution (Graph 1 and Table 1) of the surveyed students in this research is not necessarily balanced, 130 girls and 76 boys participated in the study, however it is a representative sample from the research point of view.
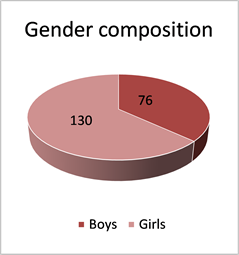
Graph 1. The gender composition of the sample.
![]()
Table 1. The gender composition of the sample.
In terms of age distribution—according to Graph 2—they participated students from 11 to 18 years, which includes teenagers (10 - 14 years) and adolescents (14 - 20 years). So in the following, I discuss the media consumer habits of 29 teenager and 177 adolescent students. In this case I do not emphasize the differences resulting from the two age models, as the two groups are not comparable in terms of research methodology, the figures do not allow this. Since the research took place in four Transylvanian counties, I begin to describe them. The Romanian, Transylvanian settlements to be presented were chosen arbitrarily, the main aspect was the availability of the students. We have focused on Hungarian-speaking individuals.
As Graph 3 shows, in this research they participated 86 students from Mureș County, 77 from Harghita, 32 from Cluj and 11 from Brașov.
The table shows the distribution of the sample by locations (Graph 4), which indicates that students studying in big cities (Cluj-Napoca, Brașov, Târgu-Mureş, Odorheiu Secuiesc) responded almost as much as those living in smaller settlements—smaller towns and villages.
Table 2 illustrates that most of interviewed persons study in high schools (168 students), but there are some vocational school (10) and primary school students (28) too.
In the study of the use of socialization networks, the starting point is the socialization trait they think of themselves. In this context we were searching what they think about themselves as being a social person. As the chart and table below illustrate, the majority of respondents consider they are mostly or very social, 6% said they are not social people. 58% of respondents consider themselves moderate, 36% consider it is quite easy for them to make friends, and 6% of young people think they don’t find it easy making friends (Graph 5).
As the Graph 6 shows, there is a significant interrelation between the gender of interviewed students and their socializing preferences (Pearson Correlation T = 0.153, p = 0.028). 32% of girls think they are social persons, 60% of them are uncertain and 8% do not consider themselves social persons. In contrast, 44% of boys find themselves social persons, 55% are uncertain and 1%does not find itself a social person.
At the same time we can find a significant difference between the type of residence and the socializing preferences of the interviewed students (Pearson Correlation T = −0.140, p = 0.046), Graph 7 refers to this. 32% of those from the metropolitan area consider themselves social persons, 60% are uncertain and 8% do not consider themselves social persons. The greatest uncertainty rate we can find in the medium-sized cities (66, 66%), and the most social persons live in villages, namely the 53, 3% of interviewed students.
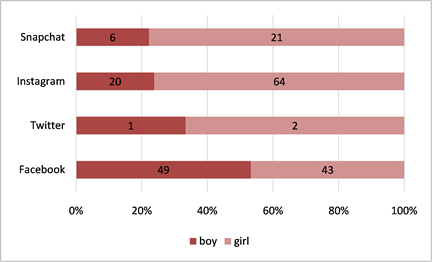
In addition, we were interested what kind of socialization network is used by young people to make contact, make friends, and strengthen relationships. The Graph 8 above shows that Facebook is the most popular online socialization platform, followed by Instagram, Snapchat and the least used Twitter.
The above data show that there is a significant correlation between the gender of the interviewed students and the socialization network they use (Pearson Correlation T = 0.215, p = 0.002). The majority of girls use Facebook (47%), followed by Instagram (34%), and only 13% use Snapchat, and 5% use Twitter. In contrast, boys use Facebook and Snapchat equally (36%), and 25% use Instagram and only 3% use Twitter (Graph 9).
![]()
Table 2. Placing samples in school cycles.
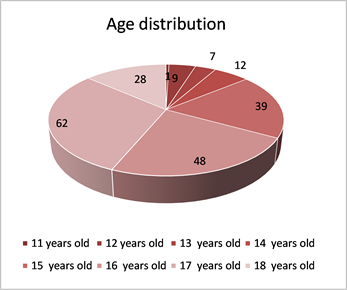
Graph 2. Distribution of the sample by age.

Graph 3. Distribution of the sample by counties.
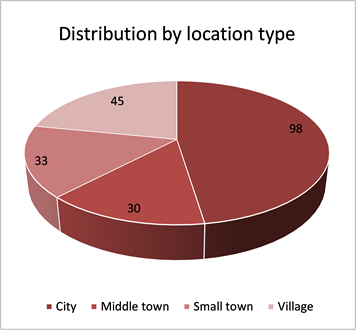
Graph 4. Distribution of the sample by locations.
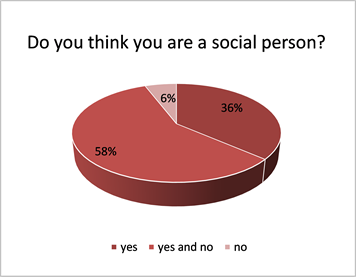
Graph 5. Self-esteem as being a social person.
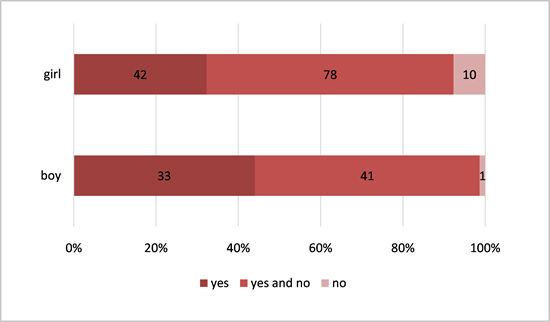
Graph 6. Correlation between self opinion as being a social person and the gender of respondents.
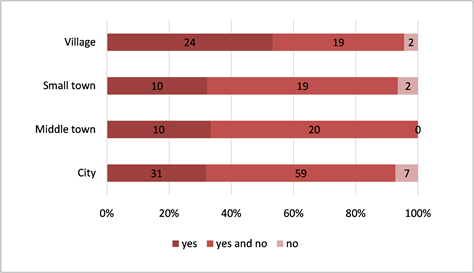
Graph 7. Correlation between self-perception as a social person and the residence.
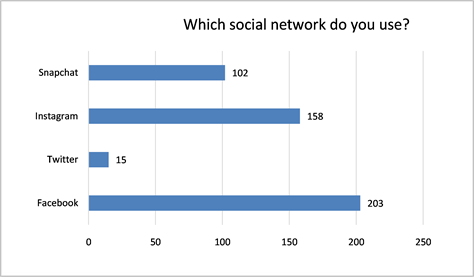
Graph 8. Preferred socialization network.

Graph 9. Correlation between the used socialization network and the gender of respondents.
As the chart illustrates (Graph 10 and Graph 11), the most preferred socialization network among the interviewed students is the Facebook (92% of respondents), followed by Instagram (84% of respondents) Snapchat (27%) and Twitter (3%).
Pearson Correlation T = 0.260, p = 0.000 with each variable (boy, girl)
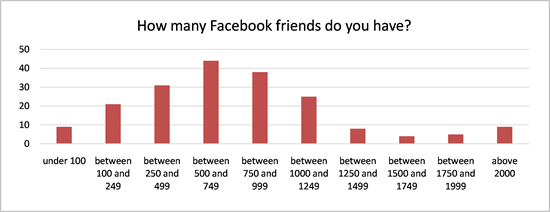
As Facebook seemed to be the most popular socialization network (Graph 12), the focus was on the respondents’ virtual friends; its numerical aspect can be considered an important fact (relationship, following contacts, collecting likes, etc.).
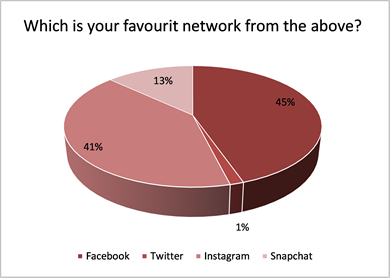
Graph 10. Judging the most popular network.
Graph 11. Correlation between the preferred socializing network and the gender of respondents.
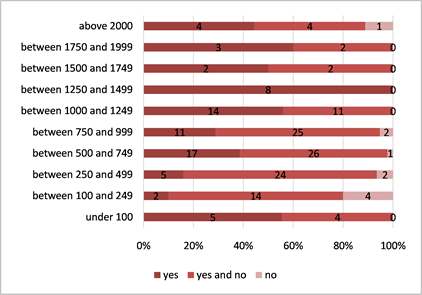
Graph 12. Numerical estimation of FB friends.
As the chart above illustrates (Graph 12 and Table 3), the highest number of friends is between 500 - 750, with tendencies of slightly more and less.
So Table 3 shows that we hardly count with friends under 100, and just a few have more than 1250 acquaintances.
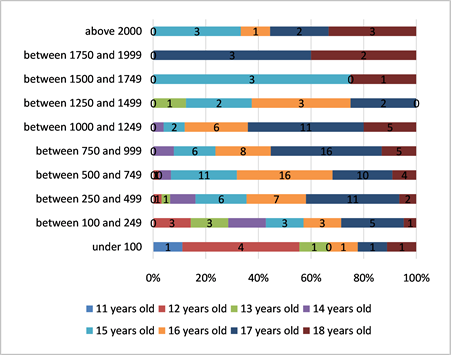
It is a remarkable the correlation between the number of FB friends and their age, and as we can see there is a significant difference between the number of Facebook friends and the age of the respondents (Pearson Correlation T = 0.346, p = 0.000). As their age grows, students have more and more Facebook friends. (Graph 13).
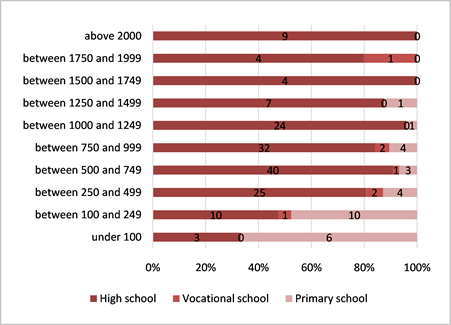
We have found a meaningful relationship between the number of Facebook friends and the school type the sample attends (Graph 14). According to the graph above, the difference is really significant (Pearson Correlation T = −0.335, p = 0.000), high school students have the most Facebook friends (over 2000), while primary school students have the lowest number (under 100).
![]()
Table 3. Numerical data regarding FB friends.
Graph 13. Correlation between the number of FB friends and the age of respondents.
Graph 14. Correlation between the number of FB friends and the type of school.
There is a significant correlation between the number of Facebook friends and the question Do you consider yourself a social person (Pearson Correlation T = −0.233, p = 0.001), so the more students consider themselves social persons, the more the number of their FB friends increases (Graph 15). Those who are uncertain and who do not find themselves social persons have the lowest number of FB friends and their occurrence is the highest among the respondents. This means that the respondents are basically insecure and/or non-social persons, this is also reflected in the number of FB friends, so it is absolutely impossible for someone to be a social person only on FB.
We can find persons who declare themselves social persons having about 1500 FB friends, and this is also proportional to the number of FB friends.
After that, one of the most exciting questions occurred in the questionnaire. We were looking for the answer that if the FB is the place of friendship and socialization, how many real friends will be nominated by the students. Graph 16 shows the tendency that the more FB friends they have, the less real friends count. The lower number of FB friends is accompanied by the fact that the individual counts more real friends (theoretically and practically). Of course this is rather a trend than a specific data, because the number of 113 true-friends is unrealistic, still believable if we think of a number of real, living relationships. In this case, it is possible that FB friends are the living social network reserved for everyday life.
In the following, we asked how much of the FB friends are physically in touch with in everyday life, how active and close these relationships are. Table 4 shows that most of the respondents have an everyday relationship with FB friends, but there area high number of young people (63 respondents) who only contact FB friends online, more precisely with some of them they only meet on FB, not in everyday life.
Graph 15. Correlation between the self-esteem as a social person and the number of FB friends.
![]()
Graph 16. Numeric estimation of true friends.
![]()
Table 4. Do you have contacts with FB friends in your everyday life?
The figure (Graph 17) is followed by the search for a correlation between the type of school and the number of Facebook friends with whom they have never met and how significant could this be (Pearson Correlation T = 0.150, p = 0.031).
We came to the conclusion that primary school students answered a higher proportion of this question with NO (23.8%) so they are in touch in real life with their friends, and 84.61% of high school and vocational school students answered with YES, so in their life often happens that FB friends remain just virtual players.
The next correlation (Graph 18) was found between the number of FB friends of the respondents (whom they have never met) and their GPA (grade point average).
![]()
Graph 17. Correlation between FB friends they haven’t met and the type of school they attend.
![]()
Graph 18. Correlation between FB friends they have never met and the GPA.
As the graph above illustrates, there is a significant correlation between the GPA of students and the number of Facebook friends they have never met (Pearson Correlation T = 0.166, p = 0.018). For those with a higher GPA, the NO answer is more common, so the better the student is, the more he or she makes contact with his/her friends not only in virtual space. This also applies in reverse, the lower the student’s GPA is, the more typical is to have friends only on FB, without encounters in everyday life.
As a result, it was handy to ask if it was disappointing to meet a person who previously was just a virtual Facebook friend.
As the Graph 19 shows, many of the respondents noticed that the virtual relationship between friends/acquaintances led to disappointment and disillusion in the context of physical everyday encounter. We can be anybody in a virtual space, we can promote our most positive attributes, and this will not be revealed if there is no offline connection.
After that we searched for the relationship between the gender of respondents and the possibility of the aforementioned disappointment. We have come to the conclusion (Graph 20). That there is a significant difference between the gender of the interviewed students and the answers to the question Have you ever been disappointed by meeting someone who was previously just a Facebook friend (Pearson Correlation T = 0.193, p = 0.006). Boys have a higher rate of frustration (88.15%) than girls (71.53%).
5. Security on the Net
The next topic that aroused our attention was the issue of net security and data protection. The public space it’s not necessarily a safe ground, which young people know differently, but practically in terms of usability, means:
As the Graph 21 shows, 88% of respondents, namely 182 students’ data are partially open to the public; in case of 24 students (12%) personal data are completely public. According to this data, there are no cases where data are not public; partiality is a typical trend of data management.
There was a significant difference between the publicity of data and the gender of the respondents (Pearson Correlation T = 0.255, p = 0.000). The ratio of completely public data for boys (25.75%) is higher than for girls (5.38%), which may be related to the higher risk-taking and boldness of boys. Girls seem to be more careful about their data; disclosure would lead to a completely unreliable field (Graph 22).
![]()
Graph 19. Disappointing FB friends.
![]()
Graph 20. Correlation between disappointment and gender.
![]()
Graph 21. The percentage statement of FB data publicity.
![]()
Graph 22. Corelation between data publicity and gender.
Since in adolescence FB means not only friendships and relationships, we asked how appropriate this virtual space is for dating and flirting (Graph 23).
As it turned out, a high proportion of respondents, namely 152 students (74%) used Facebook for dating, which is a viable way to strengthen and maintain romantic relationships, but it is quite uncertain to make new relationships.
There is a significant difference again between girls and boys concerning the use of Facebook for dating purposes (Pearson Correlation T = 0.263, p = 0.000). It is quite interesting that the majority of girls (71.05%) are using it, while the majority of boys do not use the virtual space (58.49%) for dating. This correlation (Graph 24) can be related to girls’ needs in a relationship, its maintenance, but also their uncertainty and the possibility of hiding in the obscurity of the internet.
The use of Facebook for dating purposes is seriously related to age (Pearson Correlation T = −0.250, p = 0.000). The older a student is, the more likely he/she is to use Facebook for dating, and this ratio reaches 57.14% at age 18. In a good case, this gives less chance of abuse on FB, we can assume that the older the individual is, the less he/she will engage in suspicious approaches and relationships (Graph 25).
The use of Facebook for dating purposes is strongly related to how much students consider themselves to be social people (Pearson Correlation T = 0.193, p = 0.006). The more a student thinks he is a social person, the more likely he doesn’t use Facebook for dating, while in the case of reserved students, the Facebook dating rate reaches 90.90% (Graph 26). The data on reserved students also refers to the fact that the individual—thanks to the FB option -, accepts the date only in the virtual space, which continues to strengthen this kind of behaviour (the more reserved, person will search dating possibilities in the virtual space, which further strengthens/deepens distrust).
![]()
Graph 23. Information regardingFB as flirting scene.
![]()
Graph 24. Correlation between Facebook as dating scene and the gender of respondents.
![]()
Graph 25. Correlation between Facebook as dating scene and the age of respondents.
![]()
Graph 26. Correlation between FB as dating scene and declaring himself/herself a social person.
We have received a remarkable figure from students regarding how reliable the information on the FB is (Graph 27). As it turned out, students do not necessarily trust the data they receive, as well as the information they provide may be unreliable. Unreliability does not necessarily mean that lies, false news circulates, but that some slices of reality, an intermezzo, a moment are displayed, which cannot be treated as a complete unity, but we tend to conclude for example that the shared happy moments indicate basically happiness and a happy life.
If we assumed that adolescents shared a lot of personal information about them, our idea would not be justified as the above data indicate that they rarely do so (82% of respondents confess this). Almost the same number of respondents replied with denotation frequently and rarely, but this ratio is negligible (Graph 28). It seems that the Facebook is not the place for self-reveal, self-dis- covery for adolescents, but rather for chat and communication.
The extent to which students share personal things about themselves is significantly related to the truth content of information shared on Facebook (Pearson Correlation T = 0.162, p = 0.02). Students who trust the authenticity of the information often share personal things about themselves (Graph 29).
In the following, we examined how important was to receive confirmation to shares and posts, giving and receiving likes.
As the chart above illustrates, students usually responded with all the same to the like-catching, which could mean that young people do not consider too important these reactions, which is quite a thoughtful data (Graph 30).
The next question that arises is the purpose of postings and shares if the reaction to them does not mean too much. We can also think that in the like-chapter often occur like transactions between the same persons, students give likes for those whom they have received, so it is not surprising who respond, because they react to the same persons… so this is how the likes make no difference.
The importance of the number of likes is significantly related to the type of location (Pearson Correlation T = 0.186, p = 0.007). In big cities and medium- sized towns likes have the greatest importance to students, while in small towns and villages the proportion of NO respondents is higher (Graph 31).
![]()
Graph 27. Reliability of information shared on FB.
![]()
Graph 28. Sharing personal information on FB.
![]()
Graph 29. Correlation between shared personal information and their content of truth.
![]()
Graph 30. The value of likes.
![]()
Graph 31. Correlation between the importance of likes and the type of location.
6. Conclusion
➢ The interviewed young people usually use more than 2 hours a day, actually 3 to 4 hours the media opportunities, but there is a strong tendency to search for permanent WiFi and Internet access and to be online. In fact this means that in addition to the time spent deliberately on media platforms, there is also a constant online time, which does not mean an active media platform use, but it’s still a passive consumption. Being in the “news stream”, being online phenomenon could also mean the desire to leave the personal fingerprint on the internet, because without that there is no existence in everyday life.
➢ The most popular social network is Facebook, followed by Instagram, Snapchat and the least used Twitter. Most of the girls use Facebook (47%), followed by Instagram (34%), and only 13% use Snapchat and 5% the Twitter. In contrast, boys use equally Facebook and Snapchat (36%), 25% of them use Instagram and only 3% the Twitter. The most preferred socializing network among the interviewed students is the Facebook (for the 92% of respondents), followed by Instagram (for the 84%of respondents), then the Snapchat (27%) and Twitter (3%). Facebook is hardly counting with friends under 100, and just a few have more than 1250 friends.
➢ As the age grows, students have more and more Facebook friends. The more FB friends they have, the less real friends exist. The lower number of FB friends is accompanied by the fact that the individual has more real friends (theoretically and practically). Most of the respondents also have an everyday relationship with their FB friends, but the number of young people (63 respondents) who only contact FB friends online is quite high. More precisely, some of the friends are only contacted via FB, not in everyday life. The higher the student’s GPA is, the better the student is, the more he tries his best to meet friends not only in virtual space. This also applies vice versa, the lower the student’s GPA is, the more typical is to have friends only on FB, without intersections in everyday life.
• The proportion of fully public data on the FB is higher for boys (25.75%) than for girls (5.38%), which can be related to the higher risk-taking and boldness of boys. The girls seem to be more careful about their data, because their disclosure would lead to a completely unreliable ground. The older a student is, the more likely he uses Facebook for dating and this rate reaches 57.14% at age 18. The more a student is convinced that he is a social person, the more likely he does not use Facebook for dating, while in the case of reserved students, the Facebook dating rate reaches 90.90%.
• The surveyed students do not necessarily trust the information on Facebook, and maybe the information they provide are unreliable too. Unreliability does not necessarily mean that lies and false news circulates, but that some slices of reality, an intermezzo, and a certain moment are presented, which cannot be treated as complete unity, but we tend to conclude that many shared happy moments basically mean happiness, a happy life.
• The FB is not a place for self-reveal, self-discovery for adolescents, but rather for chat and communication. Students, who trust the credibility of the information often share personal things about themselves.