Determination of the Chemical Structure of the Iraqi Oil Shale and Its Hydrocarbon Forms ()
1. Introduction
A few years ago, the search for alternative sources of raw materials has concentrated on oil shale deposits. As the exploitation of these raw materials is still extremely complex and expensive, analysis of oil shale samples is therefore extremely important in identifying the deposit’s potential in advance to facilitate in optimizing mining methods [1] . “Oil Shale” is a term used to identify rock types found in northern Iraq and currently used within the construction industry; in particular granite tile fabrication. Figure 1 shows a sample from this type of tiles including the type of oil shale rock which has darker colour. The rocks are solid
![]()
Figure 1. The use of Iraqi oil shale within the tiling industry. The darker elements represent the oil shale rock.
with alternating layers of carbonate and organic matter. In Iraq, nowadays, there is no viable literature found regarding these rock types. Part of the reason for the lack of research work relative to “oil shale” is due to cheap production of crude oil in Iraq. The proven massive oil reserves in the country are considered to be the world’s fifth-largest with 140 billion barrels [2] . Oil produced from shale formations costs $50 to $100 for a barrel to be produced, compared with $10 to $25 for a barrel for conventional supplies from the Middle East and North Africa. Table 1 summarizes the results of some of Iraq’s oil technical service contracts signed by the Iraqi government with some big oil companies [3] . As the table shows, the cost of Iraqi oil extraction is relatively low. Besides, geologists and consultants have estimated that relatively unexplored territory in the western and southern deserts may contain estimated additional 45 to 100 billion barrels (bbls) of recoverable oil.
However, the production of shale oil, from oil shale, is one of the energy generation alternatives available in the world today. Oil shale is a sedimentary rock containing a complex organic substance called kerogen and its conversion to oil is considered a valuable source of energy. Therefore, an important indicator is the kerogen content which could be relative in predicting accurately the oil yield within the shale. This research focuses on the characterization of this type of oil shale (Figure 2) found in Iraq and some other countries in the Middle East, such as Jordan and Palestine, using different techniques as follows, solvent extraction (SE), infrared radiation spectroscopy (IR), and gas and mass chromatography (GC/MS).
2. Methodology
2.1. Samples Preparation
Oil shale samples were obtained from one factory in Baghdad, specializing in the fabrication of tiles. The raw rock material collected from a supplier in Said Sadiq Province, Al Sulaymaniah Governorate, and northern Iraq. All samples were from one deposit. Each shale sample was crushed and mixed thoroughly and then about 10 g was separated and ground to a fine powder (50 μm). Later, the
![]()
Table 1. Some of Iraq’s oil technical service contract results [3] .
![]()
Figure 2. Iraqi oil shale rock used in this paper.
ground oil shale samples were utilized for analysis.
2.2. Analysis Tests of Chemical Structure
1) MS: mass spectrometry is an analytical tool that uses mass to charge ratios to determine molecular weights of the chemical structure compounds in oil shale samples. This technique has been utilized previously for several studies in pyrolysis of oil shale, tar sands, and coal [4] . Full details of this technique have been published somewhere else.
2) IR: infrared radiation spectroscopy is well-established as a useful technique for the identifying chemical characteristics of coal and kerogen [5] . The spectra were measured at 1 cm−1 resolution and collected in the 400 - 4000 cm−1 wave number range.
3) GC/MS: In order to more fully characterize the compounds, present in the Iraqi oil shale, since MS analysis gives a compound classification only, the gas chromatograph coupled with a mass spectrometer using electron impact ionization, is used for analyzing and separating the samples [6] . The GC was equipped with an automatic programmable-temperature system and a capillary column (30 m × 0.25 mm I.D.). Helium is used as the carrier gas.
3. Results and Discussion
3.1. MS Analysis
Solvent extraction (SE) for the shale samples was undertaken using two different solvents; dichloromethane and ethanol. There were no results from the extracts with ethanol. Mass Spectrometry (MS) analysis, for the extraction performed when using dichloromethane as a solvent, indicated that there were absorptions of bands at the retention time (tR) (8.5, 8.88, 8.87, 13.15, 14.96 minutes). This result confirmed the extraction and the existence of other compounds, too.
3.2. IR Analysis
Extracted oil shale sub samples were put in a diffuse reflectance cup (10 mm diameter, 3.3 mm depth) in which the packing density was ensured by applying a constant mass (of 30 g) on the top surface of each sample. The IR spectrometer was then used for analyses. The spectra indicated CH-aliphatic at bands with 3052 - 3852 cm−1 wave number. Also, there were groups of C-S and S-H compounds at bands with 900 - 1124 cm−1 wave number. Finally, amide O-C-NH2 appeared within the band showing a 1724 cm−1 wave number. The curves of different values of percentage transmittance (%T) versus the frequency of vibration, with using dichloromethane as solvent, are presented in Figure 3 & Figure 4 respectively.
3.3. IR for the Whole Rock Analysis
IR analysis for the whole rock showed characteristic bands at 2876 - 2980 cm−1. The bands were related to CH-aliphatic. Also, Amide O-C-NH2, appeared with the band, had a wave number of 796 cm−1. In addition, further spectra IR with band peaks at 876 cm−1 to 1036 cm−1 showed some evidence for the presence of S-H and C-S groups. The IR analysis (Figure 5) gives evidence of a complex chemical composition of the sample in forms of different types of groups deriving from the decomposition of various groups of the molecule. In the next section, what kinds of groups are actually existed in the oil shale sample is introduced. The figure profile shows numerous events. In fact, the number of peaks
![]()
Figure 3. Curve of percentage transmittance (%T) (ranges from 55% - 65%) versus frequency of vibration (in wave numbers) for scanning of the extracted oil samples with using dichloromethane as solvent.
![]()
Figure 4. Curve of percentage transmittance (%T) (ranges from 65% - 75%) versus Frequency of vibration (in wave numbers) for scanning of the extracted oil samples with using dichloromethane as solvent.
![]()
Figure 5. The IR spectra analysis of the whole oil shale rock provided identifiable peaks for the carbon bonds (near 3000 cm−1), and also the oxygen carbon group (near 800 cm−1).
in the chromatogram is more than number of peaks of the extracted oil samples using dichloromethane.
3.4. GC/MS Analysis
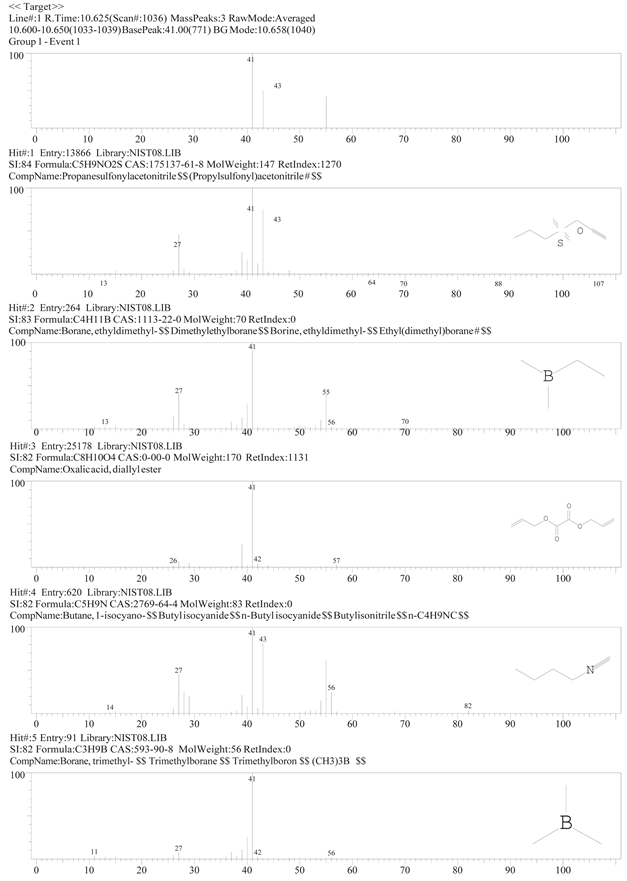
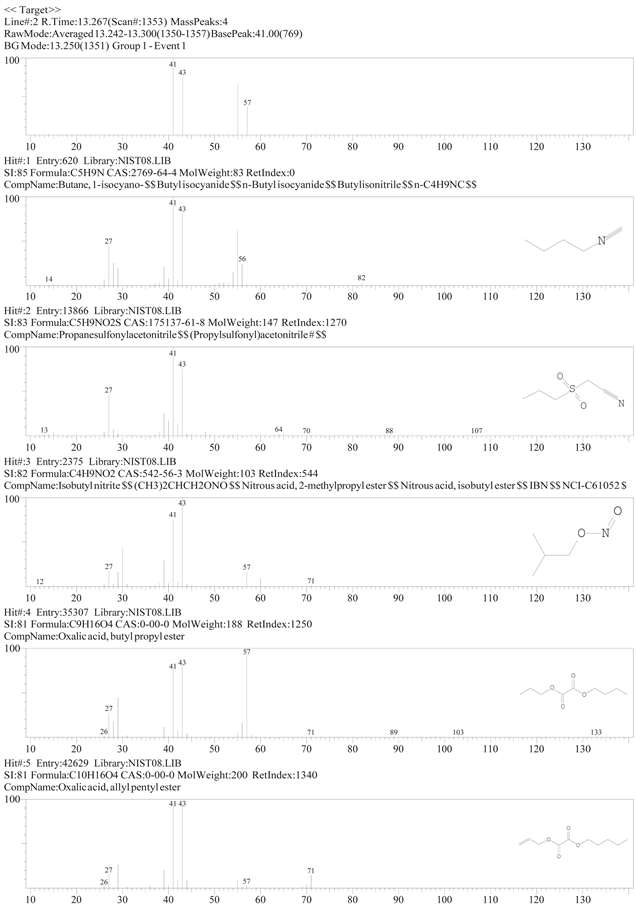
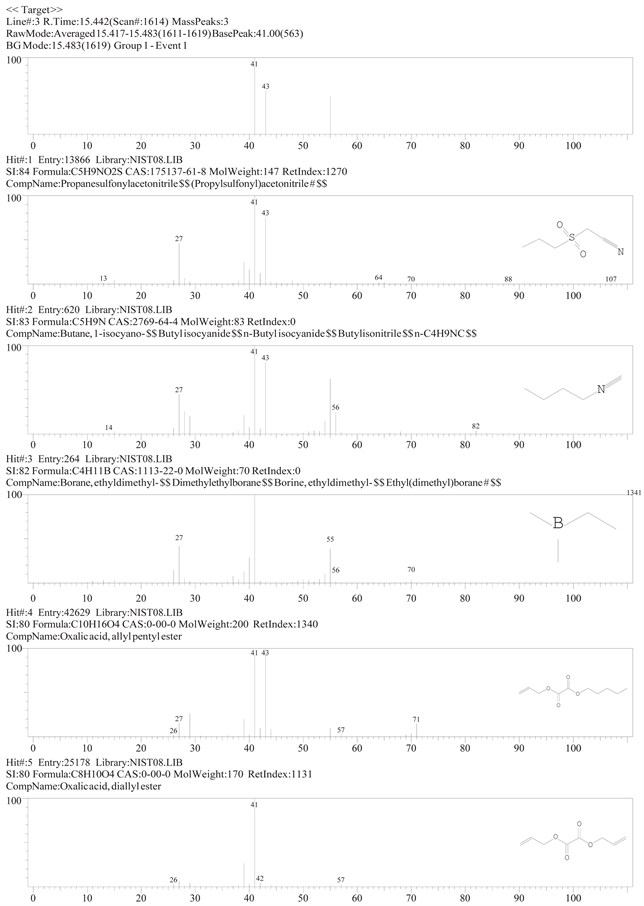
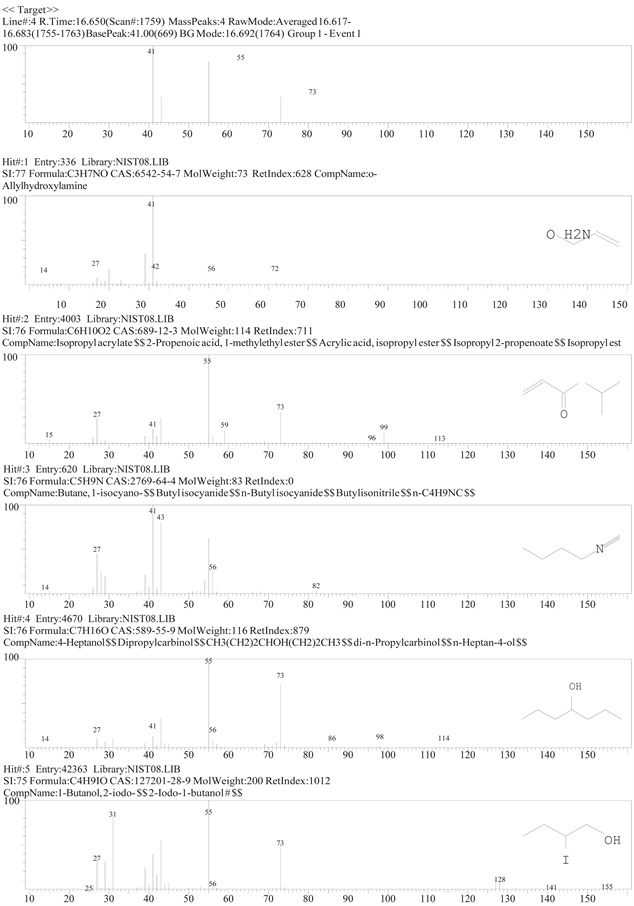
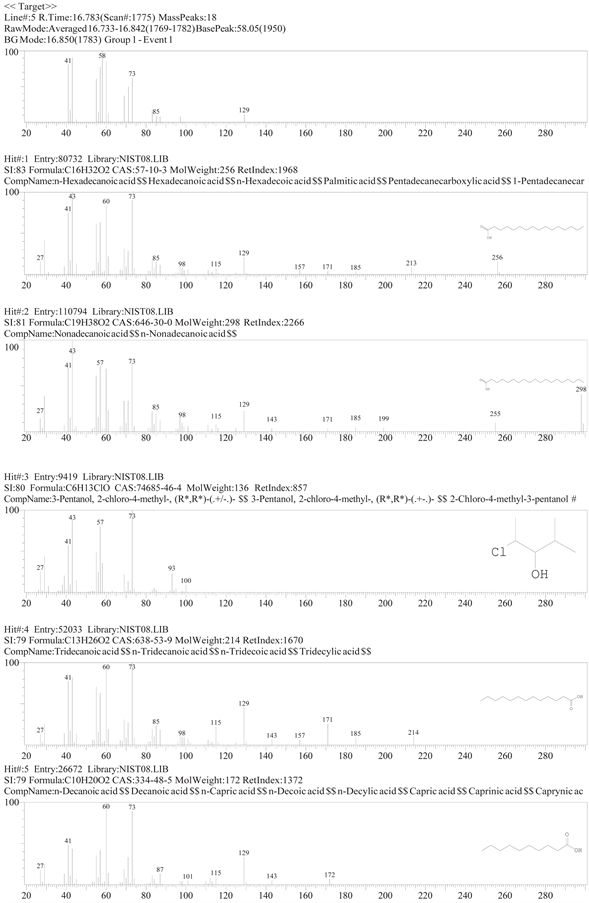
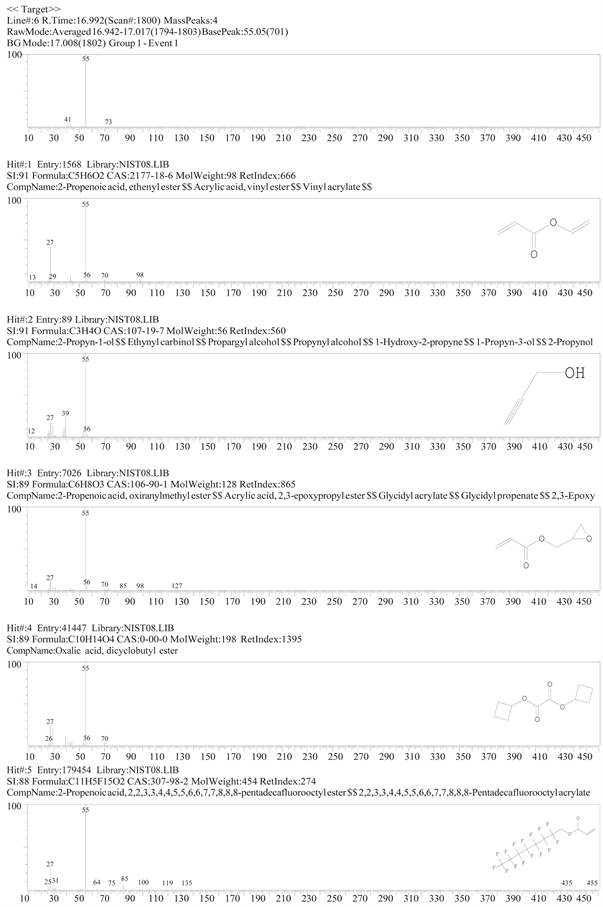
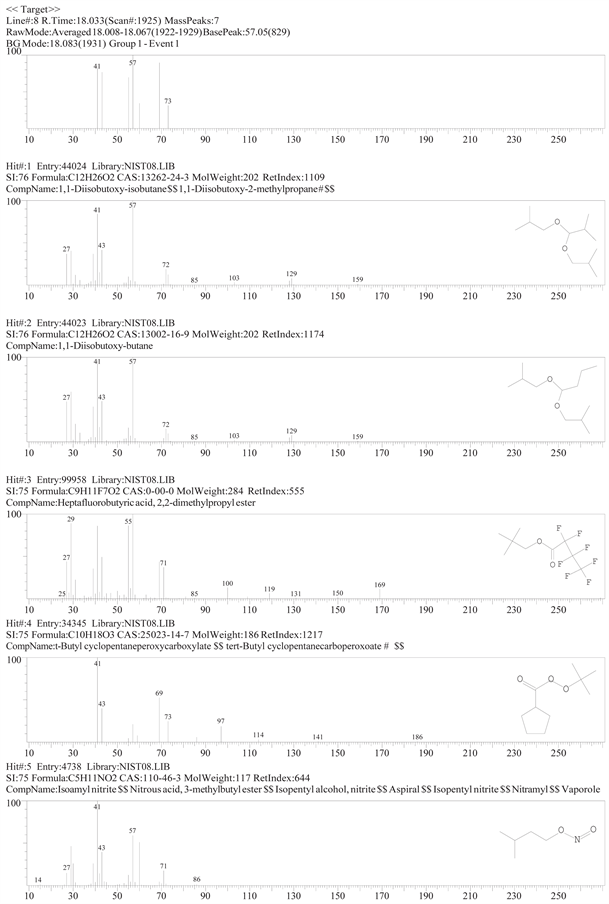
The GC separates the compounds from each other, while the mass spectrometer helps to identify them based on their fragmentation pattern. Here, methanol was used and thus considered the best solvent for extraction purposes when looking for information on the chemical structure of the sample. Following? extraction, a sample extract was filtered for analysis by GC/MS system. The compounds of hydrocarbon forms were detected in a mass spectrometer (MS) interfaced to gas chromatograph (GC), and they are summarized in Table 2. These results are consistent with those of the MS analysis.
The elemental composition of the extracted oil was found to be C, H, and N. Full details of the GC/MS analysis are presented in Appendix.
4. Summary of Results
Several analytical techniques were employed to characterize the chemical composition of the oil shale. When considered alone, each technique has its own advantage, but it was unable to provide the whole picture for oil shale [7] . The chemical composition of the oil shale available in Iraq was found to be of a series of hydrocarbon forms. Hydrocarbon type analysis indicated that mono and di-cycloparaffins were the next most abundant constituents after the paraffin series.
The organic carbon content was a good indicator for the quality of organic matter in the oil shale. Depending on the previous result, it was observed that the Iraqi Oil shale contained similar chemical composition of Egyptian oil shale, which indicated in the research of Al-Alla RA, Nassef E [8] .
5. Recommendation for Further Research
Chemically, oil shale consists of carbon, hydrogen, oxygen, nitrogen, and sulphur and all of these components are existed in Iraqi oil shale. The existence of these components, which has been noted, may considerably influence the results of structural investigations as reported in the literature. Further characterization of the oil shale by distinguishing between the aliphatic and aromatic hydrocarbons is needed. Also, since the challenges of economically developing unconventional shale deposits vary with the characteristics of the deposit, extraction costs,
![]()
Table 2. Hydrocarbon forms in the oil shale samples.
topography, land uses, water resource availability and climate, some of these concerns can be better understood in the light of further research. Therefore, this highlights further demand for research in a number of relevant areas, including the following:
1) Confirming the proportions of the mixture of hydrocarbon compounds found in the Iraqi oil shale, that it is Kerogen and of which type it is: alpha or beta?
2) Evaluating the potential extracted oil yield.
3) Studying the economic feasibility of extracting Kerogen from this type of oil shale, taking into consideration the oil price which is around $100/barrel as minimum.
4) Selecting the appropriate processing technology whilst considering the reduction in extraction costs per barrel, and reducing the carbon footprint relative to the extraction process.
Appendix