The Role of Seeding in Multi-Stage vs. Two-Stage Diffusion Models ()
1. Introduction
Product sampling has been used by marketers for many years as part of a strategy to encourage consumers to adopt a product. This strategy of delivering certain products for free at launch is sometimes termed “seeding” (i.e. [1] [2] [3] [4] ) or; “sampling” (i.e. [5] [6] [7] [8] ). According to businessdictionary.com, product samples are given to the consumer free of charge, giving them the opportunity to try the product before making a purchase. In the beginning, product samples were distributed at store locations alone. Today, product samples can be ordered from company websites and shipped to people’s homes. [9] explored the effectiveness of using sampling to introduce products. They found that customers’ attitude towards a product and the likelihood of making a purchase increased sharply after receiving a sample. This finding suggests that the effect of direct use and experience is much more powerful than advertisements. The impact of sampling on pharmaceutical marketing has raised ethical concerns about overuse. [10] conducted a systematic and comprehensive study on the use of prescription drug samples, and noted the influence of samples on health policies designed to improve the rational use of medicine. [11] explored seeding programs run by the software industry which uses extensive sampling. [12] reported that such large firms as Procter & Gamble, Microsoft, Hasbro, Google, Unilever, Pepsi, Coke, Ford, DreamWorks SKG, EMI, Sony, and Siemens implement seeding trials. Sampling is not limited to consumable products such as drugs, cosmetics and food. [5] noted that sampling applies to durable goods such as computers, textbooks and software as well. [13] noted that using seeding programs to affect diffusion is a very popular market trend. [14] referred to cases where sampling was used for durables including Philips power toothbrush, Window 95, Nokia 6682 camera phones, HP Dragon HDX laptop and even Ford Fiesta cars. The cases cited from [12] [15] [16] [17] [18] show that for high priced goods, the seeding size tends to be small and the sample is selective. For low cost goods, seeding tends to be large and random sampling may be applied.
When Sony launched the PS3 in 2006, it subsidized each console by selling it at a price estimated at $300 below unit cost (see [19] ). Subsidizing consoles is a common practice in the video game industry. Game player manufacturers usually make most of their money through royalties paid by game developers. Sony’s subsidy had an additional benefit for the firm because it served to sneak a Blu-ray player into every home buying a PS3 (Sony was backing the Blu-ray standard over the rival HD DVD effort). Since Sony is also a movie studio and manufacturer of DVD players and other consumer electronics, it had a particularly strong set of assets to leverage and to encourage the adoption of Blu-ray over the rival HD DVD. The high-definition optical disc format war between the Blu-ray Disc and HD DVD optical disc standards for storing high-definition video and audio from 2006 to 2008 and was won by the Blu-ray Disc (see Exhibit 1). Sony’s seeding strategy was considered to be the most important contributor to this victory.
Sampling is also commonplace in the B2B market. For example, Energy Micro, a new startup, launched a free sample program for EFM32 Gecko microcontrollers on June 11, 2012. Every engineer worldwide could order samples for free. The idea was to create a de-facto standard based on the broad diffusion of the device. Development teams did not have to wait for management or purchase teams’ approval to acquire components for prototypes. Later, many projects stuck with the basic prototype architecture due to time constraints. The program achieved widespread diffusion of the device and it gained a significant market share. In June 2013 Silicon Labs announced its intention to acquire Energy Micro for $115 million in cash, plus approximately $55 million in deferred and earn-out considerations. The total cumulative investment of Energy Micro investors was $13 million.
The effectiveness and benefits of seeding have been explored by many researchers. [20] found that offering free samples enhances product image. [21] claimed that giving away samples reduces customers’ perceived risk. [6] explored how sampling was used by marketers to encourage trials. [22] found that seeding the market was widely used in the packaged goods and printed media industries. [23] claimed that sampling is the most effective but also the most expensive way to introduce a new product. [24] found that pharmaceutical industry expenses devolved to delivering samples accounted for more than half of all their marketing expenses. [25] developed a method of assessing the value of seeding programs. [26] explored seeding effects with different segments of adopters. [7] conducted an in-depth study of the use of sampling in the pharmaceutical industry and showed that delivering samples to physicians was correlated with an increase in prescriptions of these drugs. [27] addressed the problem of how many and to whom the samples should be delivered.
Reference [5] explored the sampling effect in the context of diffusion of innovation. They suggested a method for forecasting the seeding effect and optimizing sample size. They also distinguished between random sampling and targeted sampling to opinion leaders. Their model is based on the [28] model but differs by assuming a positive (and non-zero as in [28] ) initial installed base created by sampling, which accelerates diffusion. The optimization criterion pits diffusion acceleration benefits (as a function of interest rate and product price) against seeding costs (which depend on manufacturing costs and sampling quantity). They also explored the dependency between innovation and imitation coefficients and seeding effects. Their results are consistent with the intuition that sampling is needed and more effective when the innovation coefficient is low and the imitation coefficient is high. [2] explored the influence of spatial distribution on seeding. They found that adoption speed increases if the dispersion of early adopters is larger. [1] analyzed the support-the-weak vs. support-the- strong strategies. They found that strategies that disperse marketing efforts, such as support-the-weak and uniform strategies, are generally superior to the support-the-strong strategy. [29] investigated the effect of sampling on adoption and repeat purchase. They found that non-durables require larger samples than durables. [8] developed a two-stage model for optimizing sampling based on the Bass model. They split the optimization into two steps. First, sampling policy is examined as a yes/no decision and second, if sampling is economically justified, the optimal sampling quantity is evaluated. They also considered non-constant potential markets (with inflow and outflow) and repurchase.
In spite of the widespread use of sampling in practice it is used mainly for acquiring a competitive position. Sometimes it is used to promote a new brand (as in the cases of Nokia 6682 camera phones, the HP Dragon HDX laptop, Ford Fiesta cars) or a new entrant (EFM32 Gecko microcontrollers) in well-established markets. In other cases it is used to win a standard battle (as in the cases of Window95 or Blu-Ray). There tends not to be real seeding in new product categories such as the iPod Flash music player (in 2001), the Smartphone (in 2007) or the Tesla Model-S electric car (in 2012).
While sampling has many benefits in promoting adoption, it has also significant drawbacks. Sampling can involve heavy costs and a loss of sales but also may create expectations on the part of the market to receive the product for free or for a low price. Thus firms engage in expensive seeding programs for competitive markets, but rarely use it for new product category market development.
According to [5] and his school of thought many new product category launches are likely to use seeding. We believe, however, that the solution to the mismatch between theory and practice goes beyond the simplistic conclusion that managers fail to implement the optimal solution. Instead, we suggest adjusting the model to explain actual behavior. We present three cases to demonstrate how the adjusted model provides a better account of why managers avoid using seeding whereas existing models recommend it.
The remainder of this paper is organized as follows. In Section 2 we review the [5] seeding model and discuss the conditions that favor seeding. We raise the issue of the disparity between theory-driven strategy and implementation. In Section 3 we review diffusion models based on a multi-stage purchase process (unrelated to seeding). We suggest why they are not broadly used. In Section 4 we introduce a diffusion model based on a four-stage purchase process (an extension of [30] , see Appendix A) and incorporate the seeding effect as well. Then, in Section 5, we apply both [5] and our model to three cases. We conduct a data fit (without seeding) to estimate the parameters and then assess the seeding effect and compare the results. The comparison shows that while without seeding the data fit or forecast are very similar, they diverge in the presence of seeding. The [5] model, based on a bi-stage purchase process, favors seeding in many cases where the diffusion model based on a four-stage purchase process recommends avoiding seeding or using modest seeding. In section 6 we calculate the optimal seeding levels and the seeding gain for each model for all three cases. We compare the expected seeding gains and seeding size of both models. In Section 7 we discuss the results and point to optional future directions. We also calculate the seeding optimization for each case with both models and compare the recommended seeding levels.
2. Existing Modeling of Seeding Effects and Optimization
The seeding optimization approach [5] is based on Bass model ( [28] ) with the slight modification that the initial condition is not zero but rather some other positive number created by delivering free samples at launch. The effect is a left shift (in time) of the periodic and cumulative sales curves. When the innovation coefficient p is low, due to concerns or difficulties to explain product’s benefits, diffusion starts very slowly. Even when WOM (Word of Mouth) is positive and the imitation coefficient q is high, diffusion has small installed base to start with. Marketers can accelerate diffusion by delivering some products for free and artificially creating a larger installed base that other customers will imitate. With seeding, the cumulative adoption will reach 100% earlier but actual revenues need to consider the loss from the products delivered for free. When the interest rate is high, this shift in time, or diffusion acceleration, has an economic benefit since the net present value (NPV) of the revenue is higher than the net present value of the same income several years in the future. When the benefits of acceleration exceed the costs of seeding there is a seeding gain and an economic justification for seeding.
Figure 1 compares the seeding effects with no seeding and with 5% seeding, a 5% interest rate, q = 0.3 for both, and p = 0.01 and p = 0.001. The periodic sales curves, with and without seeding and with both innovation coefficient values, are presented on the left side. The acceleration is represented by the shift in time between the curves with no seeding and with seeding. The right side presents the economic benefit of the acceleration. Each bar represents the annual sales (from the left size) capitalized to NPV by scaling it by
where r is the interest rate and n is the time from launch. An earlier revenue is worth more than a later one, thus diffusion acceleration has an economic value. Both the acceleration as well as the profit gains from seeding are much higher when the innovation coefficient is low. With a 5% interest rate the revenue NPV when p = 0.01 with no seeding is 0.583 (of the potential revenue with interest rate = 0), whereas with seeding it is 0.638 due to acceleration. To calculate the seeding gain we need to deduct the lost sales revenue from the seeding (0.05), so the net income is 0.588. The seeding value is thus the (net revenue) with seeding minus the
![]()
Figure 1. Seeding vs. no seeding in [5] with p = 0.01 and p = 0.001.
revenue without seeding which is 0.588 − 0.583 = 0.005, which usually does not recover the 5% seeding expenses (unless seeding costs are very low as in some cases in software). With the same seeding (5%), imitation coefficient (q = 0.3), and the same interest rate (5%), but with an innovation coefficient of 0.001, the results are significantly different. The revenue (capitalized to the present value) without seeding is 0.387 whereas with seeding is 0.591. When deducting the lost seeding sales (0.05), the net income is 0.541; hence the seeding value is 0.541 − 0.387 = 0.154 or 15.4%. This gain in revenues might justify the heavy cost of seeding. With a different interest rate (for example 2%) and a seeding of 0.01 the gain when p = 0.01 is −0.004 (representing a loss) whereas when p = 0.001 there is a gain of 0.054 which might justify seeding.
The above example demonstrates that seeding is usually justified only when the innovation coefficient p, is very low (less than 0.001). Such a low innovation coefficient value is not very rare. Actually, it is quite common, as was shown in the [31] overview where 21 out of 54 products had a p value of less than 0.001. This raises the question of why seeding, although used broadly for new brand launches (of existing categories), is so rare for new product category launches. Obviously, there are other factors such as seeding costs, interest rates and the tendency to imitate that should be considered as well. Furthermore, some manufacturers, such as Tesla-Motors, prefer to grow slowly due to capacity limits, safety risks and infrastructure availability. Still, we would expect more managers to comply with the [5] recommendations and use seeding at launch.
3. Multi-Stage Purchase Decision Diffusion Models
According to [32] [33] [34] the buyer decision process up to adoption is composed of four stages: awareness or problem recognition, information search, evaluation of alternatives and decision. The fifth stage termed post-purchase behavior occurs after purchase. The transitions between stages are influenced by internal and external factors and take time. In the context of diffusion, awareness of a product, or a potential customer, is created either by media influence, which depends on personality and behavioral characteristics, or when individuals learn about it from friends. The likelihood that a potential customer will become aware of a product increases with the growing awareness of an individual's social circle. When friends proceed through the purchase process and become more active (become interested or engage in the evaluation stage), this influence intensifies since they are likely to talk about the product more. When they see friends invest money and purchase, the influence is stronger and sometimes also has an additional visual channel (not for all products).
Reference [28] made a simplification assumption of a 2-stage purchase process, by ignoring the awareness and interest stages, and measured only the decision stage. [30] argued that this simplification did not reflect realistic individual behavior and could lead to sub-optimal marketing decisions about advertising and pricing. He claimed that adopters’ word-of-mouth (WOM) provides actual experience information, rather than the more theoretical information delivered in advertisements, which makes their influence stronger. He presented a diffusion model based on a 3-stage purchase process (unaware, aware and adoption) that modeled information diffusion and experience diffusion. This split makes it possible to adjust advertising and pricing according to potential market size at each stage. [30] did neither discuss the difference between passive awareness and active information search, which was mentioned by [34] , nor seeding policies.
Reference [35] detailed nine assumptions of the [28] model, taken for simplifying the model. The assumption that the diffusion process is binary and a customer can be either a potential customer or an actual adopter is included in their list. Whereas many factors incorporated in Bass model extensions such as marketing mix influence, potential market variations, repeat purchase and other features have been considered in the seeding context, previous studies have tended to keep the Bass model assumption of a 2-stage purchase process. Nevertheless, the [28] dual stage purchase process has been challenged (i.e. [30] ; [36] [37] [38] ). These authors dropped the bi-stage purchase process assumption and incorporated a more realistic (and more complex) purchase process in diffusion of innovation models. They also included additional factors in their models. [30] took advertising and pricing changes into account. [36] predicted customers' responses in the presence of several alternatives. [37] incorporated use-patterns and their impact on diffusion. However, sampling influence has not been examined in these multi-stage purchase process models, because the [28] assumption of a zero cumulative market size at launch is maintained. In spite of being more realistic, multi-stage diffusion models are not broadly used. We speculate that the reason for their low popularity, as we show later, is that they add significant complexity to the model and to data collection, but contribute little to accuracy. Although the number of parameters and their values differ, the forecasts generated by these models are very similar to those generated by the simple [28] model. However, as we show in Section 5, when we add the seeding effect, the forecasts diverge significantly. The seeding effect seems much stronger and hence more attractive, when using the [5] model based on the bi-stage purchase process. When using the multi-stage diffusion model the seeding effect is much more modest and the seeding recommendations are much more conservative.
4. The Four-Stage Diffusion Model
We extend the [30] model (see Appendix A) to include the four classic stages of the purchase process, aligned with [32] [33] [34] and then add the seeding effect.
Let U stand for Unaware, A for Aware, I for Interested (including information search and evaluation of alternatives), D for Decision to adopt as the four stages. Let U(n), A(n), I(n), D(n) and u(n), a(n), i(n), d(n), be the cumulative and periodic share of potential customers (in percentage) at time n,
at each stage. We assume as in [28] that social influence drives customers to move from one stage to another. Let pij and qij, be the innovation and imitation coefficients as in [28] , where the sub index indicates the transition from stage i to stage j,
where j is the stage following stage i. The potential market notation is m, as in [28] .
We assume, as in a 2-stage [28] model, that the individual stage transition probability from one stage to another is proportional to the number of customers at the influencing stages (higher stages than the current stage). Let {
,
,
} be the vector of transition probability at time n, from U to A, from A to I and from I to D, respectively since the probability of a transition is influenced by some internal tendency, pij, or “innovation”, and an external influence, qij, or “imitation”, from other customers who have already progressed through the purchase decision states. Then,
(1)
The change in the number of customers at each state A, I and D is denoted a(n), i(n) and d(n) respectively. This is calculated as the probability to progress from a state to the following state minus those who have been already in that state and progressed further. Therefore, the change in the number of customers at each stage is given as:
(2)
where
,
,
are as in (1).
Unaware is defined as those individuals who are not aware, interested or adopters of the product; thus,
(3)
The initial conditions, with no seeding, are:
(4)
In other words, at n = 0 all customers are unaware and no one has adopted, or progressed through the purchase process yet.
When we use a seeding strategy by delivering free samples at launch, the initial conditions change to:
(5)
where
is the sample size, delivered at product introduction time. In this case, similar to [5] we have
customers and not 0, who have the product and use it at time n = 0 and generate WOM (Word of Mouth) accordingly.
Following [5] the optimal seeding size, D0* solves the following optimization problem,
(6)
where
is the total profit, capitalized to present value (NPV), r is the interest rate and c is the product unit cost.
5. Model Implementation and Comparison
We applied [5] and our model on three markets:
1) The PC market (worldwide) from 1981 to 2012
2) The iPod market from 2002 to 2009
3) The Rapid Prototyping 3D Printers (RP) market from 1988 to 2012
We chose these markets since they experience a relatively lengthy stretch of time between launch and growth; therefore they are good candidates to reveal the seeding effect. The problem that we are trying to address is to justify why industry managers would avoid seeding at category launch. Seeding has been used more recently for new brand entry in the PC market and other markets as well.
An example of a forecast of the changes in sizes of the 4 segments corresponding to the 4 stages of the Rapid Prototyping 3D printers market are presented in Figure 2. It shows that the unaware segment, U(n), where n represents time, decreases as A(n) the aware segment, increases. During the period of awareness growth, only a few move forward to the purchase process and start to actively search for information, I(n), or actually adopt, D(n). As awareness reaches its peak, customers are expected to become active, join the active information searchers’ segment, I(n) and finally progress further and join the adopters’ segment, D(n).
We estimated the parameters of both the 2 stage (Bass, 1969) and the 4 stage (our) model for data fits of the 3 markets above using the minimum sum of squares error. The parameter estimates are summarized in Table 1. The data fit to actual sales, with and without seeding is illustrated in Figure 3.
Note that although the innovation coefficients values using the [28] 2-stage model are very low, which favor the use of seeding, the innovation coefficients values using the 4 stage model are larger by an order of magnitude or more, and make seeding unattractive. The [28] “explains” the lengthy introduction by a low innovation coefficient representing rejection and concerns regarding the new technology at the beginning. The multi-stage model “explains” the delay by the need for customers to go through preemptive stages before they actually buy the product.
![]()
Table 1. Parameter estimates for the four markets.
The parameters estimation in Table 1 is based on OLS. The actual sales data is presented in Figure 3 (including data sources).
Delivering free samples accelerates diffusion by creating an initial installed base that others learn from and imitate. The economic “revenue” from the acceleration depends on the interest rate. When the interest rate is high, there is a strong drive to accelerate diffusion. The cost stems from two components: 1) the cost of goods delivered 2) the loss of revenue from individuals who received the goods for free instead of buying them.
To compare the seeding acceleration effect of the 2 stage vs. the 4 stage we proceed as follows: 1) first, we consider the case of a no-seeding policy for the 4 stage vs. the 2 stage; 2) then, we consider the case of arbitrary seeding for the 4 stage vs. the 2 stage. The results are illustrated in Figure 3. Our observations are the following. While the 2 stage and 4stage model, both without seeding, show a good fit with actual data, their forecast for future periods is either similar (as for iPod) or different (as for PC and RP). On other hand, with seeding the diffusion acceleration forecast is much steeper with the 2 stage model than with the 4 stage model.
The statistical metrics of the data fit quality, or the approximation to actual data are shown in Table 2. The RMSE metrics are a little better for the 4 stage model. Nevertheless the forecast for both the 2 stage [28] model and the 4 stage model, when there is no seeding, are quite close. However, when exploring the seeding effect, the 2 stage model used by [5] diverges significantly from the 4 stage based model. In Table 2 we also present the diffusion acceleration or the shift in peak.
For all three markets, the diffusion acceleration, when using the 2 stage purchase model, is significant and seems to justify intensive seeding (depending on interest rate and cost). When using the 4 stage purchase process, the acceleration appears to be much lower and might not justify a costly seeding strategy. Thus if applying the 4 stage purchase decision process modeling that includes the stages
of awareness or problem recognition, information search, evaluation of alternatives and decision, caution should be exercised when considering seeding to accelerate diffusion. This is particularly true when the introduction is long, as expressed in a very low innovation coefficient when using the [28] model. Sometimes the progress along the stages of the purchase process, which might be tracked in surveys or internet traffic analysis, takes some time and cannot be significantly accelerated by delivering free samples.
These comparisons lead the following conclusions:
Result 1: Without seeding, there are no significant differences between the forecast based on the 2 stage model and the forecast based on the 4 stage model.
Result 2: With arbitrary seeding, the acceleration effect based on the 2 stage forecast is much stronger than the acceleration effect based on the 4 stage forecast.
Managerial insight: Managers who use a 2 stage forecast may overestimate sales during introduction and the first half of market growth and may deploy (expensive) unnecessary infrastructure, sales personnel and service too early.
6. Seeding Optimization
For seeding, optimization Equation (6) requires to receive the values of interest rate r, and unit costs c as inputs. We used two interest rates (1% and 5%). We also assumed a typical margin of 25%. This implies that 25% of the unit price is profit whereas 75% of the unit price equals material, components and assembly costs. This represents a case where the cost c is three times the profit made when selling one product.
We use the term seeding gain for the additional profit (capitalized to current values) from diffusion with seeding, relative to the profit without seeding. Considering (1)-(6) it is clear that the seeding size, D0, accelerates the diffusion and modifies the non-cumulative adoption rate, d(n). The profit with seeding, given a certain seeding size D0, is calculated as in (6). The seeding gain, which is also a function of the seeding size D0, is calculated as the percentage of the difference between the profits with seeding size D0 and the profits without seeding divided by the profits without seeding. All the profits are in terms of NPV and the revenues are scaled by the interest rate factor. Figure 4 presents the NPV of the seeding gain as a function of seeding size (as a fraction of the potential market). The curve peak is the optimal gain and its corresponding seeding size is the optimal seeding size D0*.
The three examples in Figure 4 demonstrate that relying on the 2 stage vs. the 4 stage model can lead to illusory expected gains or even to losses. For the PC market, when the interest rate r = 1%, the optimal seeding according to the 2
![]()
Table 2. Data fit: 2 stage vs. 4 stage models.
![]()
Figure 4. Seeding gain: 2-stage vs. 4-stage. Figure 4 data is generated using the parameters from Table 1 and Equations (1)-(6). The equations are run with different seeding size starting from D0 = 0 to D0 = 0.2.
stage model is 0.006 of the market and would lead to nearly a 1% gain. Based on the 4 stage model seeding is not recommended. When the interest rate r = 5%, the optimal seeding according to the 2 stage model is 0.05 of the market and would lead to nearly a 27% gain. In the 4 stage model the optimal seeding is also 0.05 but the gains are relatively modest (13%). For the iPod case both models recommend avoiding seeding at both r = 1% and r = 5%. For the RP case, when the interest rate r = 1%, the recommended seeding according to the 2 stage model is 0.01 of the market with a promised gain of 6.8%. The 4 stage model forecasts a loss of 4% in this case. When interest rate r = 5%, the optimal seeding according to the 2 stage model is 0.1 of the market and would lead to nearly a 60% gain. These 2 stage results recommend huge investments and promise a return that looks overoptimistic. In the 4stage model the optimal seeding is 0.05 and the forecasted gain is relatively modest (8%). Note that extra seeding can lead to additional losses that stem from the cost of extra inventories. Thus managers’ experience appears to guide them to avoid the seeding levels recommen- ded by [5] and sometimes avoid seeding altogether.
7. Discussion and Future Directions
Many papers since [5] have tended to recommend seeding as an effective tool to promote the launch of new product categories and accelerate diffusion. The models proposed in these papers often recommend high investments and forecast high returns, especially when innovation coefficient values are low. According to these models the best timing for seeding is at launch. However, the cases they cite usually involve seeding new brands, by new entrants or competitors, when the product category is well established and far beyond the start of growth. Most of them use selective and very small samplings of opinion leaders (for example customers who take a quiz and show their knowledge and high involvement). Such customers generate a lot of WOM and are considered experts by others. Their opinion tends to lower others’ concerns about a new brand. For new product categories, managers usually avoid a seeding strategy and prefer gradual growth. The model described here has attempted to explain why managers avoid seeding at new product category launches but do use this strategy, with significant investments, for placing new brands in established markets. While at launch, potential customers need to recognize the problem and appreciate the solution proposed by a new product category (which takes time), and customers in established markets have already gone through these stages. Seeding can prompt customers who explore alternatives to overcome their concerns and reduce their perceived uncertainty. In many cases where the [28] model is used, a low value of the innovation coefficient does not really mean that the innate tendency to adopt is necessarily low. It may embed early awareness and interest diffusion which take time but are not explicitly included in the [28] model. Although for many purposes this simplification is satisfactory, it may be misleading when considering seeding. When considering seeding, it seems better to examine market development using the more detailed, multi-stage diffusion model. Thus our model highlights drawbacks of using the bi-state simplification assumption for diffusion in the context of seeding. Future research should directly measure the awareness and interest of potential customers of new product categories. This would make it possible to validate the model not just by the data fit of the last stages but also by comparing actual measured intermediate stages to modeled ones.
Appendix A: Reference [30] Three Stage Diffusion Model
The [30] diffusion model, when omitting pricing and advertising factors and when the adoption influence on uncertainty is linear, is as follows:
(1)
(2)
where I(t) represents the awareness (in percentages) and X(t) represents individuals who are aware and actually purchased the product. Equation (1) depicts the diffusion of awareness and Equation (2) depicts the diffusion of actual purchase within the aware group.
The tendencies to progress in the purchase process, or the probability of an individual to change a stage, denoted
respectively, can be re- presented as a matrix:
(3)
and the change in each group is:
(4)
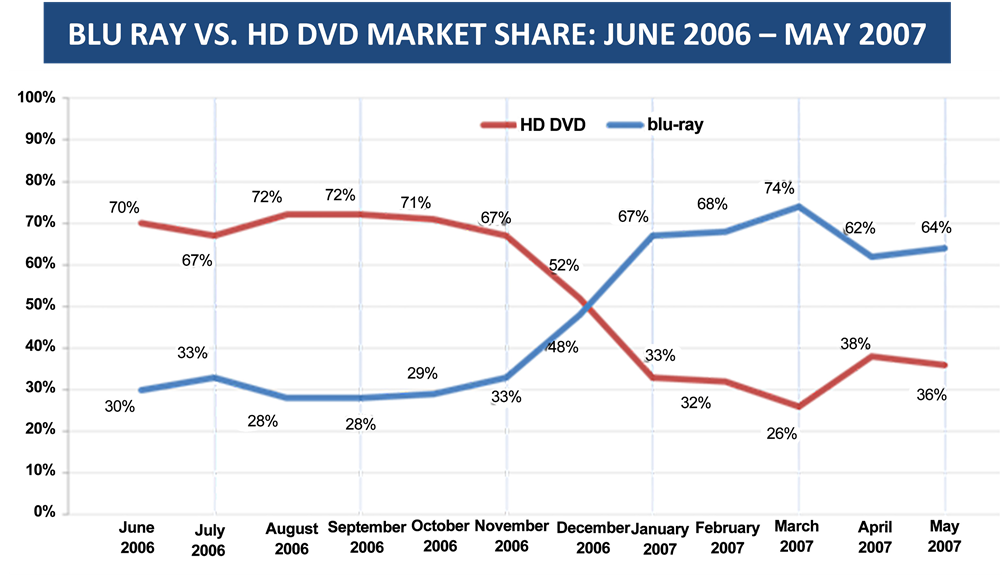
Exhibit 1. Blu-ray vs. HD-DVD market share. Source: Nielsen Video Scan.