Water Resource Pricing Study Based on Water Quality Fuzzy Evaluation: A Case Study of Hefei City ()
1. Introduction
Water resources feature scarcity and water supply and sewage treatment has scale economies effect, plus the water industry has a natural monopoly, so this industry not only needs government regulation to form and maintain the monopoly, but also needs price regulation and other regulatory means to prevent adverse economic consequences arising from enterprises’ free decisions-making under the monopoly [1] . Currently and during a period of time in the future, the basic objectives of Chinese water price reform is to establish a water pricing mechanism which can fully reflect the water shortage in China as well as take water conservation, rational allocation of water resources, improvement of water use efficiency, promotion of sustainable use of water resources as the core. And gradually make water price reflect the full cost of water supply to truly facilitate the enterprization of the production and operation units of water services, thus promoting the whole society to save water and use water efficiently [2] .
To put it in a simple way, the water price is the market prices embodied by water as a commodity for exchange. Town comprehensive water price often includes basic price (water supply project price), water resource charges, sewage treatment fee and city surcharge. Basic water price, water resource fee, sewage treatment fee and sewage charges are regarded as different items in accordance with legal basis, goal-oriented reasons, and administrative factors. In theory, China’s water resource fees are collected from people who use water in the form of “fee” and according to state’s ownership of water resources. The levy’s primary purpose is to protect water resources and prevent damage to the water environment [3] .
Water resource price, in somehow, is a kind of tax; it expresses the worth and chance cost of water resource; users need to pay for their right to take the water. It includes compensation for water resources consumption and for impact on water ecology (such as water ecological changes duo to water in taking or water diversion), as well as the investment in promoting development of water-saving technology and protection of water resources [4] . With rapid economic and social development, the demand of all sectors within national economy for water is constantly increasing. Serious scarcity of water resource as well as prominent imbalance between demand and supply have emerged. Although water resource supply also adopts the principle of paid use of natural resources, water resource differs from mineral resources and lands for its characteristics like irreplaceability, monopoly, non-competitiveness, renewability and regionalized supply. Therefore, currently the water resource fees’ effect of regulating resource differential revenues is not manifest and it’s not enough to reflect the principle of paid use of resources as well as regulating resources differential revenues [5] .
As for research method, commonly used water resources evaluation methods include: shadow pricing method, opportunity cost approach and supply & demand pricing method [6] . United Nations defined shadow price as “an invested (like capital, and labor and exchange) opportunities cost or overall economy’s losses as its supply volume reduces by one unit”. For example, in discussion about water resources price, reduced volume of water supply enterprises’ output value caused by reduced water supply amount can be used to measure the scarcity value of water resources; opportunities cost method is refers to that use cost of resources can be estimated by sacrificed income with alternative uses in the absence of market price. For instance, tree felling and land exploitation are prohibited to protect water sources. In general, opportunities cost isn’t measured directly by income arising in resources protection, but by benefits that are sacrificed to protect water sources by giving up trees felling and land utilization. Therefore, due to the ambiguity and complexity of water resources price, this paper uses methods relating to fuzzy mathematics for modeling and processing. The study had a comprehensive consideration of five factors including water quality, water resources per capita, household consumption level, per capita GNP, population or population density to evaluate the water resource price [7] .
2. Water Resource Fuzzy Pricing Model
The development and utilization cost of water resources mainly include the investment in a region’s (or watershed) water conservancy and waterworks project as well as operation and maintenance costs (including expenses like exploration, planning, monitoring, water intaking, water delivery, water resource protection, water purification, labor salary, etc. as well as costs such as depreciation of capital and interest concerning reservoirs, water treatment plants, water distribution system, etc.)And opportunities cost refers to the sacrificed maximum net returns which could be achieved by alternative ways of using water resources. It includes return losses caused by unavailability in the future (or offspring) resulting from current use of nonrenewable resources (groundwater), or returns losses in the future (or to offspring) due to current unsustainable use of renewable resources (surface water). External cost refers to damages to other economic subjects as well as environment and ecology as a result of development and utilization of natural resources [8] [9] .
Due to the ambiguity and complexity of water resources pricing system, this paper uses methods relating to fuzzy mathematics for modeling and processing [10] . According to the actual situation, the determined model parameters include five factors: water quality (reflects quality of local water resources), and per capita water resources volume (reflects local per capita water resources volume), and residents consumption level (reflects local residents of economic status), and per capita gross domestic product (reflects economic development level and demands of water), and population or population density (reflects social factors and the life water requirement), all of which are used to evaluate water resources value [11] .
Water resource pricing model can be expressed by a function:
 (1)
(1)
Among them, V is comprehensive evaluation value of water resource price;  are the factors that influence the price of water.
The specific design of the model function is shown below.
Discourse Domain U is defined as the water resource price element,  , evaluation vector is W, W = {High, slightly higher, normal, slightly lower, low }, then comprehensive evaluation of water resource price is expressed by the following equation:
 (2)
(2)
Among them, A is the weight values of evaluation of elements ; V is comprehensive evaluation value of water resource price; R is the comprehensive evaluation matrix composed of single factor
  evaluation matrix, R can be expressed as:
 (3)
(3)
Among them, the  represents the j level evaluation value of element n.
In order to determine , the membership of the factors in element n mush be determined first.
The so-called membership refer to specifying a fuzzy set C (denoted by ) on B for conclusive domain B, appoint that any
  has a corresponding membership
 , define
  as the membership function of
 , denoted by
 .
.
There is a variety of ways to determine membership function. Up (down) half trapezoidal distribution is frequently used to establish the function of one variable. For , membership function is determined by the following formula.
 (4)
(4)
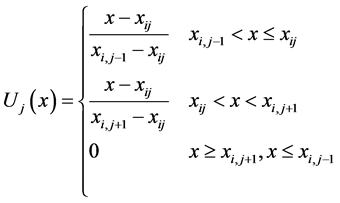 (5)
(5)
![]() (6)
(6)
The methods to determine weights A are diversified. For example, weight distribution method, a matching method of consulting membership function matrix method, is suitable for comprehensive evaluation that is hard to be quantified [12] ; factor contribution ratio method which determines the weight vector according to the evaluation factor contribution rate; confidence level weighting method uses the maximum matrix element of fuzzy similar matrix as a confidence level to evaluate factor weight: paired comparison method selects any two factors from m factors according to the regional characteristics and experts’ opinions, then obtains ratios through pairwise comparison of the importance of two factors [13] , thus forming the evaluation matrix:
![]() (7)
(7)
Among them, ![]() represents the ratio of the ith factor and the jth factor’s importance,
represents the ratio of the ith factor and the jth factor’s importance,![]() , the mid-value of specialist assignment could be chosen as its value, then multiply the elements in each line of the matrix C, next seek m root of them to get a vector.
, the mid-value of specialist assignment could be chosen as its value, then multiply the elements in each line of the matrix C, next seek m root of them to get a vector.
![]() (8)
(8)
![]() (9)
(9)
Thereafter, the results were normalized to get a vector
![]() (10)
(10)
Results obtained using the above models, V is the comprehensive evaluation value of water resources. It is a dimensionless vector and must be converted to water price through the following formula:
![]() (11)
(11)
![]() represents the requested water resource price, is V is the results of water resources comprehensive evaluation, S for water resource price vector.
represents the requested water resource price, is V is the results of water resources comprehensive evaluation, S for water resource price vector.
Water resource price vector S is determined by the following method:
First determine the upper limit P of the water resource price, then the method of arithmetic interval to divide water resources price interval ![]() into price vectors
into price vectors![]() .
.
Water price ceiling is the water resource price at the maximum water resource price withstanding index. It’s calculated by deducting the project water price and environmental water price from the bearing capacity water tariff, which is expressed by the following formula:
![]() (12)
(12)
![]() respectively represent domestic water and industrial water.
respectively represent domestic water and industrial water. ![]() is disposable income;
is disposable income; ![]() represents the total output value of industrial enterprises.
represents the total output value of industrial enterprises. ![]() represents water price’s proportion in disposable income;
represents water price’s proportion in disposable income; ![]() represents water price’s proportion in total industrial output value. Q represents water consumption.
represents water price’s proportion in total industrial output value. Q represents water consumption.![]() ,
, ![]() respectively represent project water price and environmental water price.
respectively represent project water price and environmental water price.
3. Parameters Affecting the Water Resource Price
Five factors such as water quality standards, per capita water resources volume, per capita GDP, per capita disposable income of urban residents, population density are taken into consideration. Evaluation criteria is shown in Table 1.
![]()
Table 1. Hefei water resource value evaluation criteria.
Note: The standards of per capita water resources volume, per capita GDP, per capita disposable income of urban residents, population density were rated and classified according to “China Statistical Yearbook”(2014) and statistics of other provinces, autonomous regions.
3.1. Water Quality
The monitoring indicator average value of data in each month can be calculated according to the lakes and reservoirs water quality monitoring data reported each month in 2014 (Table 2), and then the annual average can be calculated. Finally, a linear membership function with one unknown could be established according to “Surface Water Environment Quality Standards”.
Water quality evaluation index and surface water environment quality standard standards (GB 3838-2002), are shown in Table 3.
Taking ammonia nitrogen factor for example, up (down) semi trapezoid distribution is used to seek its membership with each class of the water quality standards. In the Hefei lake and reservoir water quality monitoring data reported in 2009, the annual average concentration of ammonia nitrogen factor is 0.7773, which ranks between the second and the third class. Its membership with class II is:
![]() (13)
(13)
Its membership with class III is:
![]() (14)
(14)
Then the ammonia nitrogen factor’s fuzzy evaluation relationship is: ![]() .
.
In the same way, a matrix R composed of each water quality factor’s membership at all levels can be obtained
![]() (15)
(15)
The weight of each water quality factor is:
![]()
![]()
Table 2.Hefei lakes and reservoirs water quality monitoring average data of each month reported in 2014(unit: mg/L).
![]()
Table 3.Surface water environment quality standards (unit: mg/L).
Water quality comprehensive evaluation results and water quality fuzzy evaluation relationship obtained through recombination and normalizing of membership matrix and weighting factors: ![]()
3.2. Per Capita Water Resource Volume
Hefei’s total water resource volume is 1.761 billion cubic meters and in 2009, the total population of Hefei is 7.696 million, then Hefei’s per capita water resources is 228.8 cubic meters/person. In China, the highest per capita water resource volume is Tibet― 139,658.9 m3/person and the lowest is Beijing―126.6 m3/person. After being divided into five equal parts, the membership vector obtained is:
![]() (16)
(16)
3.3. GDP per Capital
Hefei’s per capital GDP is 42,981 yuan. The highest as well as the lowest GDP per capita in China are 78,326.13 yuan (Shanghai) and 10,301.95 yuan (Guizhou). After being divided into five equal parts, the membership vector obtained is:
![]() (17)
(17)
3.4. Urban Resident per Capita Disposable Income
Hefei’s urban resident per capita disposable income is 17,158 yuan, while the highest as well as the lowest data are respectively 28,837.78 yuan (Shanghai) and 11,929.78 yuan (Gansu). After being divided into five equal parts, the membership vector obtained is:
![]() (18)
(18)
3.5. Population Density 3
Hefei’s population density is 581 people/km2, while the provinces with highest and lowest population density are respectively Shanghai (3029.97 persons/km2) and Tibet (2.38 persons/km2), and after being divided into five equal parts, the membership vector obtained is:
![]() (19)
(19)
Fuzzy evaluation matrix of water resources is
![]() (20)
(20)
Population density, GDP, per capita disposable income are socio-economic factors. To simplify the calculation, equal weighting method is used and the weight is defined as 0.1. Water quality and quantity are natural factors of water resources, so the weight of water quality is 0.3, weight of quantity is 0.4, and thereby the obtained water resource value comprehensive evaluation weight vector is:
![]() (21)
(21)
Comprehensive evaluation of water resource is
![]() (22)
(22)
4. Water Resource Price Calculation
In 2014, Hefei’s urban resident per capita disposable income is 17,158 yuan. In 2007, its total water supply was 246.81 million tons, of which the volume of domestic water was 114.71 million tons, then domestic water supply’s proportion in the total water supply is 0.465, and the industrial water’s proportion is 0.535. At the end of 2007, Hefei’s total population was 478.9 million, so the per capita domestic water was 23.95 cubic meters/ year. In 2008, Hefei’s water consumption per million industrial output value is 276 cubic meters/million. The family domestic water fees bearing index is denoted by 0.03, the industrial water cost is maintained within 1.5% of the industrial output, so take industrial water bearing index as 0.015.
The upper limit of water resource price is:
![]() (23)
(23)
Water resource price vector is:
![]() (24)
(24)
Water resource price is:
![]() (25)
(25)
Thus, Hefei’s water resource price should be 1.88 yuan/m3. So what’s the actual levy status of Hefei’s water resource price? According to the “Anhui water in taking permits and water resource fee collection management and implementation approach” (Anhui Provincial People’s Government Order No. 212) and the provisions in documents of provincial Department of Finance, Price Bureau and Department of Water Resources [CZ (2008) 633], water resource fee is collected and managed in different levels, and its divided according to the following proportions: for water fee levied by county-level government, 10% shall be submitted to central government, 90% is remained by the county government; for water charges levied by municipal government, 10% shall be submitted to central government, 90% is remained by the municipal government.
According to the provisions, in Hefei’s levy of water resource price in 2014, the price of surface water is 0.06 yuan/square, the groundwater is 0.15 yuan/square. While the use of underground water, mineral water and other water with high economic value will be charged 2 times of the highest standards of deep groundwater. As for the water resources fee collected from urban water supply businesses, the adjustment is made by stages. For use of groundwater, 50% of the corresponding adjustment amplitude of above mentioned water use category will be executed within three years, gradually put in place; three years later, the standards will gradually be in place through comprehensive consideration of various factors like resident consumption.
5. Discussion and Conclusions
As required by “water resources fee collection and usage management approach” (CZ [2008] No. 79) of Ministry of Finance, National Development and Reform Commission, Ministry of Water Resources, water resources fees are specially used in conservation, protection and management of water resources, also in rational development of water resources. The objectives of water fee reform is to reflect scarcity of water, effectively encourage conservation and protection of water resources, and optimize allocation of water resources.
5.1. Water Fee Collection Standards Cannot Accurately Reflect the Condition of Water Resources and Environmental Carrying Capacity
Although Anhui Province has adjusted water fee collection standards for several times, currently the standards still cannot serve as an economic leverage (Table 4). And they’re unable to promote the rational allocation, conservation and protection of water resources. Low water fee standards are like scratching across boots. They cannot achieve effect of the promoting conservation and protection of water resources, optimizing the allocation of water resources. Neither can they provide any effective support to strengthen the management of water resources, which makes it difficult to effectively implement water intaking permit system, and also may impair the motivation to collect and manage water resource fee.
5.2. In Water Resources Fee Collection and Use, Government Intervention Persists
Some local governments interfere with the normal collection of water resources fee from the perspective of local interests. They freely exempt water resource fee of Water Supply Company, “foreign-funded” enterprises and private enterprises. Many areas use exemption as the preferential policy to attract investment. In addition, there are some companies default water resource fee due their poor efficiency.
According to China’s current “Water Law” (2002), “Water Intaking Permits and Water Fee Collection Regulations” and “Water Resources Fee Collection and Usage Management Approach” of Ministry of Finance, National Development and Reform Commission, Ministry of Water Resources, water resources fees are specially used in conservation, protection and management of water resources, also in rational development of water resources. Its purposes mainly include water resources investigation and assessment, planning, distribution, formulation of related standards, monitoring and implementation of water use permits as well as water resource scheduling. But in practice, usage plan management and direction of water use may depart provisions of water administrative authorities.
5.3. In the Development of Water Resource Fee Standards, the “One Size Fits All” Problem Is Serious, and the Process Lacks Dynamic Adjustment Mechanism
Water scarcity, social and economic development, water quality and other factors will
![]()
Table 4. 2014 Partial provinces water fee collection standards comparison (unit: yuan/m3).
Source: developed from local regulations and policies related to water resources fee.
affect the value of water. And as a means to reflect the value of water resources, water fee should transfer related information to water users to encourage them to cherish water resources. However, at present, in the development of water resource fee standards, the “One size fits all” problem is prominent in the whole province. Thus the water resource fee standards cannot reflect the influence of relevant factors. Meanwhile, the process lacks dynamic adjustment mechanism.
Acknowledgments
The authors would like to thank the editors for their valuable comments and suggestions, which led to significant improvements in the paper. This work was supported by the Ahhui provincial environmental protection projects named economic development strategy of environmental impact assessment studies of Anhui province. Under grant Nos. 2014-005 and Ahhui provincial environmental protection projects named Area of the city cluster along Anhui-Yangtse River under grant Nos. 2014-006.