A Simple Computational Approach for the Texture Analysis of CT Scan Images Using Orthogonal Moments ()
Received 17 March 2016; accepted 15 April 2016; published 22 June 2016

1. Introduction
A tumor is the solid lesion which is produced by an abnormal cells growth which seems to be like swelling. The body is composed of many cells and each has a special functions. The extra cells form a mass of tissue called a tumor. In order to detect tumor, some computerized techniques are essential at the moment for easy diagnose. The advancement in the medical imaging technologies like Computer Tomography (CT), Magnetic Resonance Imaging (MRI) and ultrasonography has significantly raised the accuracy in diagnosing any abnormality in human organs [1] . Even though these technologies are utilized, still there should be more statistical analysis to get the accuracy related to performance analysis. In the field of medical diagnosis, orthogonal moment provides a very good contribution due to its better and superior feature representation capability. Tchebichef moment, a discrete orthogonal moment is suitable for the analysis of image stated by Mukundan [2] . Image analysis using the discrete and continuous orthogonal moment along with the applications was discussed [3] - [5] . Teague [6] introduced both Zernike and Legendre moments based on the theory of continuous orthogonal polynomials and had suggested the notion of orthogonal moments to cover the image from moments. Legendre moments, Zernike moments and Racah moment have been widely used in the since past decades. The classification of texture using Zernike moment feature set was proposed by V.S. bharathi et al. [7] who proposed the significance test to select the best moment orders to discriminate normal and abnormal tissues in liver images. Racah Moment, one of the discrete orthogonal polynomials was used for the image analysis stated by Hongqing Zhu et al. [8] . The idea so generated can be utilized this orthogonal moment for CT scan images. The classification of CT images using texture features and neural network was proposed by Glestos et al. [9] . The Zernike polynomials are orthogonal to each other. Zernike moments can represent the properties of an image with no redundancy or overlap information between the moments [10] . Due to these properties, Zernike moments are found suitable in different types of applications. The performance evaluation of various segmentation methods was analysed by Maheswari et al. [11] .
The sample of discrete orthogonal moments like Zernike moment and Racah moment is taken for computation. The sample of continuous orthogonal moment like Legendre moment is considered for computation. It is a novel approach of stating the performance of orthogonal moments in terms of computing the accuracy for diagnosing the diseases in medical images. The particular combination of segmentation with orthogonal moments provides very good accuracy while detecting the tumor is studied and compared. The following section covers the implementation of orthogonal moments.
2. Materials and Methods
Regular moments have been extensively used as shape features in a variety of applications in image analysis. The regular moment suffer from the case that the basis function is not orthogonal, and certain degree of information redundancy is also possible. Moments with orthogonal basis functions solve this problem. A brief review of the three orthogonal moments implementation considered in this paper is illustrated as follows.
2.1. Legendre Moment
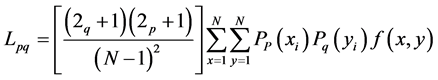
Legendre moments are a class of continuous orthogonal moments. Teague [6] presented the Legendre moments with the Legendre polynomials as kernel functions. The Legendre moments of (p + q) order for a digital image of pixel size N × N, are defined as,
 (1)
(1)
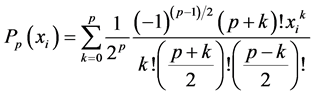
where the functions Pp(xi) denote the Legendre polynomials of order “p”. The xi and yj are the normalized pixel coordinates in the range of [−1, 1]. The Legendre polynomial Pp(xi) of order “p” is defined as,
 (2)
(2)
with |xi| ≤ 1 and (p - k) is even.
2.2. Zernike Moment
Zernike [10] introduced a set of complex polynomials which form a complete orthogonal set over the interior of the unit circle i.e. x2 + y2 = 1. These polynomials are defined as,
 (3)
(3)
where p is positive integer or zero and q is positive and negative integers subject to constraints p - |q| even and |q| ≤ p Rpq(x, y): radial polynomial defined as,
 (4)
(4)
Teague [6] proposed the concept of orthogonal moments, based on orthogonal polynomials. Zernike moments of order “p” with repetition “q” for a digital image function f(x, y) are given by,
 (5)
(5)
the center of the image is taken as origin for computing the Zernike moment and pixel coordinates are mapped in such a way that (x2 + y2) ≤ 1. Those pixels falling outside the unit circle are not used in the computation.
2.3. Racah Moment
The (n + m) order Racah moment of an image f(s, t) with size N × N
 (6)
(6)
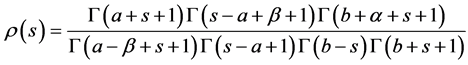
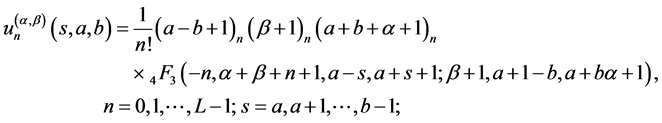
the set of weighted Racah polynomials being defined as
 (7)
(7)
 (8)
(8)
 (9)
(9)
 (10)
(10)
The generalized hyper geometric function  is given by
 (11)
(11)
and the parameters a, b, α and β are restricted to

The weighted set of Racah polynomial values can be obtained by implementing Equation (7).
3. Proposed Method
Classification of CT scan images using hepatic lesions were proposed by Glestos et al. [9] . The input CT scan image of size 500 × 500 is taken as input. The block diagram shows the proposed work in Figure 1. The quality of the image is enhanced through the pre-processing stage with morphological operation. The ROI based seg-
![]()
Figure 1. Block diagram of the proposed method.
mentation and Watershed segmentation is applied to the pre-processed image. The two segmented images are applied to the orthogonal moment computation for extracting the features. The discrete and continuous orthogonal moments such as Zernike, Racah and Legendre moments are computed from the ROI and watershed segmented image thereby six different features can be obtained. The mathematical functions like Energy, Contrast, Auto correlation, Homogeneity and variance are computed to extract intensity features of input image. From the six different methods of features, the optimized value is calculated. Based on the optimized values, the threshold is set and using this value the tumor present in the input image is identified. The two segmentation methods output, features are extracted using the Legendre, Zernike and Racah moment so that six different methods can be obtained, applying the following mathematical functions for computing the intensity features.
Energy
 (12)
(12)
Contrast
![]() (13)
(13)
Auto correlation
![]() (14)
(14)
Homogeneity
![]() (15)
(15)
Variance
![]() (16)
(16)
After computing the above Equations (12)-(16) on the computed orthogonal moments, Energy, autocorrelation, contrast, homogeneity and variance value are obtained for all the input images as in Table 1. In order to set the threshold value for detecting the abnormality in the input image, the computed values are optimized for the input images as shown in Table 2. As many images are tested with normal and abnormal images, the computational model is performing well enough to detect the tumour. The performance analysis is carried out by using the computed features and the values of each orthogonal moment features are compared with accuracy through sensitivity and specificity.
4. Results and Discussion
The Results of the inputs both normal and abnormal CT scan images which are given as sample inputs and the intermediate outputs are received as presented in the following section.
The sample of input images are used for the experimental study is shown in Figure 2 and Figure 3. The input image is pre-processed and has performed morphological operation to enhance the quality of the input image is given in Figure 4(a) and Figure 4(b). The ROI based segmentation and Watershed segmentation is applied on the pre-processed image so as to identify the various regions of the input image is shown in Figure 4(c).
![]()
Table 1. Computed intensity features value for the input 2 CT scan image.
![]()
Figure 2. Sample CT scan input images with abnormalities present.
![]()
Figure 3. Sample Normal CT scan input images.
![]()
Figure 4. (a) Input 2 CT scan image; (b) Pre-processed Morphological operation on (a); (c) ROI based segmentation and Watershed segmentation output.
Then the three orthogonal moments viz Legendre, Zernike and Racah moments are computed on the two segmented outputs. The intensity features are extracted from the obtained computed moments is presented in Table 1. Table 2 shows the computed optimized value from the obtained intensity features. The Authentication of the input image and the graph representing the computed intensity features are shown in Figure 5(a) and Figure 5(b). Similarly the same method is continued for all the input images.
5. Discussion
The various intensity features are extracted from the CT scan input images using Energy, Contrast, Auto correlation etc as shown in Table 1 and Table 2. The computed optimized values for the 19 sample input images with and without tumour is presented below in Table 3.
As with many inputs are given and tested, the threshold values have been set as 0.110 by absorbing the Legendre ROI optimized value. Similarly it is possible to set the threshold values for all the six methods. The graph show the analysis of intensity features extracted using the mathematical function like Energy, Contrast, Auto correlation, Homogeneity and variance when compared with six different methods for the sample input images are shown in Figure 5(b).
6. Performance Analysis
![]()
Figure 5. (a) Authentication of input image; (b) Graph showing feature extraction computation for the input image 2.
![]()
Table 3. Optimized value for the sample input images.
![]()
Table 4. Performance analysis of six methods for the sample input images.
Based on the results, it is observed that the Racah polynomial feature extraction for ROI based segmentation provides better accuracy in many input images for 1, 3, 4, 5, 6, 8, 10, 11, 12, 13, 14, 15, 16, 17 and 18. Second to the contribution is Legendre feature extraction for ROI based segmentation and watershed segmentation are placed in terms of accuracy in most of the images. This analysis aids the medical industry to accurately detect tumour and to follow the best orthogonal moment features and segmentation methods.
7. Conclusion
Based on the results, it is observed that the orthogonal moments both discrete and continuous are showing a better feature extraction even in medical images too. The Racah orthogonal moment with ROI based segmentation is showing a very good result in terms of accuracy when compared with other orthogonal moments for the medical images. Followed to this is Legendre moment with ROI based segmentation that shows the better results in accuracy for many images. In order to detect the abnormality present in any CT scan images, the orthogonal moments show very good features representation particularly when combined with ROI based segmentation when compared with other segmentation. Finally, the Racah moment and Legendre moment provide a good contribution when working with Medical images and hence aid the medical field to diagnose the diseases easily. In order to improve the accuracy for diagnosing the diseases in medical images, the proposed work reveals the solution and in future other moments with segmentation can be taken for the study.