1. Introduction
Wheat is the leading source of vegetable content than either maize (corn) or rice, the other major cereals. It is used in the making of flour for leavened flat and steamed bread, biscuit, cookies, cakes, breakfast cereal, pasta, noodles, couscous [1] and for fermentation to make beer [2] , other alcohol beverage [3] . More wheat flour is produced than any other flour. Wheat varieties are called “clean” or “brown” or “hard” if they have gluten content and they are called soft or weak flour, if gluten is low. Hard flour or bread flour is high in gluten with 12% to 14% gluten content and has elastic toughness that holds its shape well once baked. Soft flour is comparatively low in gluten and so results in a finer or crumbly texture [4] . Soft flour is usually divided into cake flour, which is the lowest in gluten, and pastry flour, which has slightly more gluten than cake flour. Wheat flour provides a major source of the complex carbohydrate of about 71%.
The two most common major species of walnut are grown for their seeds. The persian or English walnut (Juglansregia) originated in Persia and the Black walnut (Juglansnigra) is a nature to eastern North America. The Black walnut is of high flavor, but due to its hard shell and poor characteristics, it is not grown commercially for nut production. The commercially produced walnut varieties are nearly all hybrids of the English walnut. The worldwide production of walnut seed has been increasing rapidly in recent years with most increase coming from Asia. The world produced a total of 2.5 million metric tonnes of walnut seeds in 2010; China was the world’s largest producer of walnut seeds, with a total harvest of 1.06 million metric tons [5] . Commercially, the nuts are being cultivated in the United States of America, Romania, France, Turkey, and China. After plantation, the tree takes approximately four years until it produces its first major crop.
Unlike most nuts that are high in mono-unsaturated fatty acids, walnuts are composed largely of poly-unsaturated fatty acids (47.2 g), particularly alpha-linolenic acid (18:3n-3; 9.1 g) and linolenic acid (18:2n-; 38.1 g). The beneficial effect of this unique fatty acid profile has been a subject of many studies and discussion. Band and Hu concluded in 2009 that while walnut enhanced diets are promising in short term studies, longer term studies are needed to ascertain better insights [6] . Raw walnuts contain glyceryltriacylates of the n-3 fatty acid alpha-linolenic acid (ALA), which is not as effective in human as long-chain n-3 fatty acids and antioxidants [7] . A study has suggested that consumption of walnut increases fat oxidation and reduces carbohydrate oxidation without affecting total consumption, suggesting the walnut consumption may improve the use of body fat in overweight adult [8] . Walnut has been shown to decrease the endothelial dysfunction associated with a high fat meal [9] . On October 11, 2006, Science Daily published a report which stated that “New research shows that consuming a handful of raw walnut along with meals high in saturated fat appears to limit the ability of the harmful fat to damage arteries” and attributed the result to a 2006 article in the Journal of American College of Cardiology. A 2012 study showed that eating walnuts improve sperm quality in healthy young men [10] .
They are rich in monounsaturated fatty acids (about 72%) like oleic acid and an excellent source of all important omega-3 essential fatty acids like linoleic acid, alpha-linolenic acid (ALA) and arachidonic acids. Regular intake of walnuts in the diet helps to lower total as well as LDL or “bad cholesterol” and increases HDL or “good cholesterol” levels in the blood. Research studies suggest that Mediterranean diet that is rich in monounsaturated fatty acids, and omega-3 fatty acids help to prevent coronary artery disease and strokes by favoring healthy blood lipid [11] . Research studies have suggested that n-3 fatty acids by their virtue of anti-inflammatory action help to lower the risk of blood pressure, coronary artery disease, strokes and breast, colon and prostate cancers.
They are rich source of many phyto-chemical substances that may contribute to their overall anti-oxidant activity, including melatonin, ellagic acid, vitamin E, carotenoids, and poly-phenolic compounds. These compounds have potential health effects against cancer, aging, inflammation, and neurological diseases. Eating as few as six to seven average size nuts a day could help scavenge disease causing free radicals from the body [11] .
In addition, they are an excellent source of vitamin E, especially rich in gamma-tocopherol; contain about 21 g per 100 g (about 140% of daily-required levels). Vitamin E is a powerful lipid soluble antioxidant, required for maintaining the integrity of cell membrane of mucus membranes and skin by protecting it from harmful oxygenfree radicals. These nuts are packed with many important B-complex groups of vitamins such as riboflavin, niacin, thiamin, pantothenic acid, vitamin B-6, and folates. They are also very rich source of minerals like manganese, copper, potassium, calcium, iron, magnesium, zinc, and selenium. Copper is a cofactor for many vital enzymes, including cytochrome c-oxidase and superoxide dismutase (other minerals function as co-factors for this enzyme are manganese and zinc). Zinc is a co-factor in many enzymes that regulate growth and development, sperm generation, digestion and nucleic acid synthesis. Selenium is an important micronutrient, which functions as a co-factor for anti-oxidant enzymes such as glutathione peroxidases [11] .
Walnut oil has flavorful nutty aroma and exhibits excellent astringent properties. Applied locally, it helps to keep skin well protected from dryness. It has also been used in cooking, and as “carrier or base oil” in traditional medicines in massage therapy, aromatherapy, in pharmaceutical and cosmetic industry. The nuts are usually eaten on their own, using nutcracker machine. The kernels can also be enjoyed roasted, salted, or sweetened. The kernels are nutty yet pleasantly sweet in taste. Add as toppings in yogurt, pizzas, pies, etc. Crushed kernels often sprinkled over salads, desserts, particularly sundaes and other ice cream based preparations. Candied walnuts are added as seafood toppings. They are widely used in confectionery, as an addition to biscuits, sweets, and cakes. The nuts are also used to make walnut-butter, which is quite popular; especially among peanut allergy sufferers. In the Middle East, walnuts are added along with almond, dates, in Ramadan special pastry preparation, ma’amoul [11] .
When purchasing whole walnut that has not been shelled, we should choose those that feel heavy for their size. Their shells should not be cracked, pierced or stained, as this is oftentimes a sign of mold development on the nutmeat, which renders it unsafe for consumption. Shelled walnuts are generally available in prepackaged containers as well as bulk bins. Just as with any other food that you may purchase in the bulk section, you should make sure that the bins containing the walnuts are covered and that the store has a good product turnover so as to ensure its maximal freshness. Whether purchasing walnut in bulk or in a packaged container, avoid those that look rubbery or shriveled. If it is possible to smell the walnuts, do so in order to ensure that they are not rancid.
Due to their high polyunsaturated fat content, walnuts are extremely perishable and care should be taken in their storage. Shelled walnuts should be stored in an airtight container and placed in the refrigerator, where they will keep for six months, or the freezer, where they will last for one year. Unshelled walnuts should preferably be stored in the refrigerator, although as long as you keep them in a cool, dry, dark place they will stay fresh for up to six months [12] .
A major problem facing developed countries like Nigeria today is malnutrition which has contributed to infant mortality, poor physical and intellectual development in infant and low resistance to diseases. Another problem is the cost in the importation of wheat and addition of walnut flour will fortify the wheat flour by increasing the protein level and other nutrients. Hence, the aim of the study was to produce composite flour samples from wheat/walnut flours at different level of substitution and to evaluate their chemical, functional and pasting properties for further food applications.
2. Materials and Methods
2.1. Collection of Sample
Whole walnuts and Wheat flour were purchased from Ndioro market in Umuahia,Abia State, Nigeria. The walnuts were sent to the Botany department of Michael Okpara University of Agriculture, Umudike, Abia State for proper identification. The analyses were carried out in Food Science and Technology department of Michael Okpara University of Agriculture, Umudike and Optimal laboratory, Abriba street, Umuahia. The reagents used for analyses were of analytical grades.
2.2. Preparation of Sample
The whole walnuts (Juglansregia) were first washed thoroughly to remove any adhering contaminants. They were then cooked in a steel pot for 30 minutes to remove the shells. The deshelled walnuts were then reduced into smaller sizes with the aid of stainless steel knife. They were then blanched in hot water for 5 minutes before draining. After blanching, the walnuts were dried in a hot air oven at 60˚C for 5 hours to remove moisture. They were then milled and sieved to produce the walnut flour [13] .
2.3. Composite Flour Formulation
Different composite flour samples were prepared by combining 100%, 90%, 80%, 70%, 50%, wheat flour and 0%, 10%, 20%, 30%, and 50% walnut flour respectively (Table 1). Wheat flour was coded with A and Walnut flour with B according to [14] .

Table 1. Showing blends of wheat flour (A) and walnut flour (B) used in composite flour formulation.
The composite flours samples were evaluated for their proximate compositions, functional properties and pasting properties respectively.
3. Proximate Composition
Protein, moisture content, ash, crude fibre, fat, and carbohydrate were determined according to the standard methods of [15] [16] and [17] .
3.1. Moisture Content Determination
Moisture content of the flour samples was determined according to [15] . Two grams of each of the flour samples were weighed into different moisture cans. It was then placed in an oven at 150˚C for three hours. Drying was stopped after obtaining two consecutive values differing by 0.001. The samples were cooled in a desiccator and weighed.

where: W1 = initial weight of empty canW2 = weight of empty can + sample before dryingW3 = final weight of empty can + sample after drying.
3.1.1. Ash Content Determination
The ash content was determined using the method of [15] . Porcelain crucible were dried and cooled in desiccator before weighing. Two grams of the sample flours were weighed into the crucible and the weight taken. The crucible containing the samples were placed into the muffle furnace and ignited at 550˚C. This temperature was maintained for three hours. The muffle furnace was then allowed to cool; the crucibles were then brought out, cooled and weighed. The ash content was calculated as follows:

W2 = weight of crucible + ashW1 = weight of empty crucible.
3.1.2. Fat Content Determination
The fat content of the flour samples were determined using solvent extraction in a soxhlet apparatus as described by [16] . Two grams of each of the flour samples were wrapped in a filter paper and placed in a soxhlet reflux flask which is connected to a condenser on the upper side and to a weighed oil extraction flask full with two hundred mils petroleum ether. The ether was brought to its boiling point, the vapor condensed into the reflux flask immersing the samples completely for extraction to take place on filling up the reflux flask siphons over carrying the oil extract back to the boiling solvent in the flask. The process of boiling, condensation, and reflux was allowed to go on for four hours before the deffated samples were removed. The oil extract in the flux was dried in the oven at 60˚C for thirty minutes and then weighed.

where: W1 = weight of oven dried thimbleW2 = weight of sample usedW3= weight of round bottom flaskW4 = weight of round bottom flask with fat residue.
3.1.3. Crude Fibre Determination
The crude fibre of the flour samples were determined according to the [15] method. Two grams of each of the samples was boiled under reflux for thirty minutes with 200 ml of solution containing 1.25 g of H2SO4 per 100 ml of solution. The solution was filtered through linen on a flaunted funnel and washed with water until the washing is no longer acidic. The residue was then transferred to a beaker and boiled for thirty minutes with 100 ml of solution. The final residue was filtered through a thin—but—closer pad of washed and ignited asbestos in a Gosh crucible. The residue was then dried in an electric oven and weighed. The residue was incinerated, cooled, and weighed.

W1 = weight of sample usedW2 = weight of crucible plus sampleW3 = weight of sample crucible + ash.
3.1.4. Crude Protein Determination
Crude protein of the sample flours was determined using the Kjedahl method according to [15] [17] . One gram of the sample was introduced into the digestion flask. Kjedahl catalyst (Selenium tablets) was added to the sample. Twenty mils of concentrated sulphuric acid was added to the sample and fixed to the digester for eight hours until a clear solution was obtained. The cooled digest was transferred into one hundred mils volumetric flask and made up to the mark with distilled water. The distillation apparatus was set and rinsed for ten minutes after boiling. Twenty mils of 4% boric acid was pipetted into conical flask. Five drops of methyl red was added to the flask as indicator and the sample was diluted with seventy five mils distilled water. Ten mils of the digest was made alkaline with twenty mils of NaOH (20%) and distilled. The steam exit of the distillatory was closed and the change of color of boric acid solution to green was timed. The mixture was distilled for fifteen minutes. The filtrate was then titrated against 0.1 N HCL.
The percentage total was calculated:

3.1.5. Carbohydrate Content Determination
Carbohydrate content of the flour samples was determined by using the formula described by [16] .

3.2. Functional Properties
The bulk density, water absorption capacity and swelling capacity of the flour samples were determined using the method by [16] [17] and [18] .
3.3. Pasting Properties Determination
The pasting properties of the flour samples were determined using the rapid visco analyzer (RVA) according to (Newport scientific, Narrabeen Australia) as described by [19] , by adding 3 g of the samples plus 50 ml distilled water each. The paddle was placed into canisters containing the samples and water. The samples were then inserted in the rapid visco analyzer. The analysis was carried out at a programmed heating and cooling cycle where the samples were held at 50˚C for 1 minute, heated at 95˚C for 3.8 minutes and held at 50˚C for 1.4 minutes and the pasting performance of the flour samples was automatically recorded on the graduated sheet of the instrument.
3.4. Statistical Analysis
All experiments were conducted in triplicates and the mean values and standard deviations were reported. Analysis of variance (ANOVA) was performed and results were separated using the Multiple Ranges Duncan’s test (p < 0.05) using statistical software of Statistical Package for the Social Sciences (SPSS), Version 16; (SPSS, Inc. New Jersey, USA).
4. Results and Discussion
The proximate composition is shown in Table2 It could be seen that the moisture content of the samples
Table 2 . Proximate composition of the wheat/walnut flour samples.
Values are means ± standard deviation of triplicate determination; Means with different superscript in the same column are significantly different at p < 0.05. AB1 (100% wheat flour); AB2 (90% wheat flour and 10% walnut flour); AB3 (80% wheat flour and 20% walnut flour); AB4 (70% wheat flour and 30% walnut flour); AB5 (50% wheat flour and 50% walnut flour).
ranged from 5.70% to 8.17%. The proximate composition showed that all the samples were within the normal moisture content of dried food (flour blends) which should not be more than 9% [20] . According to these results, there were significant differences (p < 0.05) in the moisture content of the five samples.
The low moisture observed for the five formulations was a good indicator of their potential to have longer shelf life. It is believed that materials such as flour and starch containing more than 12% moisture have less storage stability than those with lower moisture content. For this reason, a water content of 10% is generally specified for flours and other related products. The sample AB4 (70% wheat flour-30% walnut flour) had the highest moisture content and significantly (p < 0.05) differed from others samples. Different food materials have different capacity for absorbing/retaining moisture which may exist as occluded or absorbed water [21] [22] ; James, [23] . As the walnut flour was added to the wheat flour, it tended to bind moisture, thereby reducing the moisture content of the composite flour samples as seen in Table2
The ash content of the flour samples ranged from 1.80% to 3.47%. The ash content of the flour samples reduced at 10% substitution of walnut flour to the wheat flour but as the walnut flour substitution increased from 20% to 40%, there were corresponding increase in ash content of the flour blends. Sample AB4 (70% wheat flour and 30% walnut flour) was significantly different from other samples at (p < 0.05) because it had the highest ash content (3.47%), sample AB3 (80% wheat flour and 20% walnut flour) was not significantly different (p > 0.05) from AB1 (100% wheat flour) in ash content (2.27%) but differed significantly from other samples at (p < 0.05). However, sample AB5 (50% wheat flour and 50% walnut flour) did not significantly differ (p > 0.05) from AB2 (90% wheat flour and 10% walnut flour) but was significantly different from other samples. The ash content of flour is simply a measure of its mineral content [24] . High ash content as a result of walnut flour addition to the wheat flour could imply increased quantity of minerals in the flour samples.
The crude protein content of the flour samples ranged from 12.7% to 25.17%. The crude protein content of the five formulations were significantly different (p < 0.05) from each other. Sample AB5 (50% wheat flour and 50% walnut flour) had the highest crude protein content (25.17%) followed by sample AB4 (70% wheat flour and 30% walnut flour) (21.47%). Sample AB1 (100% wheat flour) had the least crude protein content (12.70%). This could be attributed to the high percentage of protein content of the walnut flour (24.1 g/100g for Black walnut seed and 15.2 g/100g for English walnut seed) [5] .
This result indicated that the aim of supplementation which was to increase the protein content was achieved while producing a more shelf stable product due to its lower moisture content. These findings were in agreement with the work of [25] .
The fat content ranged from 2.40% to 37.57%. The fat content for the five samples were significantly different (p < 0.05) from each other. Sample AB5 (50% wheat flour and 50% walnut flour) had the highest fat content of 37.57% followed by sample AB4 (70% wheat flour and 30% walnut flour) which had a fat content of 35.47% and sample AB1 (100% wheat flour) had the least fat content (2.40%). This could be attributed to the high percentage of oil in walnut flour. Wheat flour supplemented with walnut flour will have a high amount of polysaturated fat which is very healthy nevertheless, the storage conditions of the composite flour samples should be really considered to prevent rancidity due to the presence of the oil [26] . This implied that the major limitation of this study was the fact that the high fat content of the wheat/walnut flour samples made them prone to rancidity, hence the need for proper storage.
The carbohydrate content ranged from 19.04% to 63.00%. The carbohydrate content for the five samples were significantly different (p < 0.05) from each other. Sample AB1 (100% wheat flour) showed a very high percentage of carbohydrate content of 63.0%. As the walnut flour addition to the wheat flour increased, corresponding decrease in carbohydrate content were observed in the composite flour samples. This was in agreement with the findings of [27] who reported a decrease in carbohydrate content of wheat flour with increase in soybean flour fortification.
The crude fibre content of the flour samples ranged from 3.57% to 11.37% and were significantly different from each other at 0.05% level significance. The crude fibre content of the wheat flour was 11.37%. From Table 2, it could be seen that wheat flour had the highest percentage of fibre compared to other samples, but at 10% substitution of walnut flour to the wheat flour, it tended to reduce to 3.57%, then at 20%, 30%, and 50% substitution of walnut flour to the wheat flour, the percentage of crude fibre began to increase. This indicated that walnut flour supplementation to wheat flour improved the crude fire content.
The effect of walnut flour substitution at different proportion on the functional properties of wheat flour is shown in Table3 The result obtained for water absorption capacity ranged between 4.03 g/g and 5.17 g/g. Water absorption capacity is the ability of flour to absorb water and swell for improved consistency in food. It is desirable in food systems to improve yield and consistency and give body to the food [28] . Sample AB2 (90% wheat flour and 10% walnut flour) was significantly different from other samples at (p < 0.05) because it had the highest capacity to absorb water and also sample AB5 (50% wheat flour and 50% walnut flour) was significantly different from the other samples at (p < 0.05) because it has the least capacity of absorbing water. Sample AB1 (100% wheat flour), AB3 (80% wheat flour and 20% walnut flour) and AB4 (70% wheat flour and 30% walnut flour) were not significantly different (p > 0.05) from each other but are significantly different (p > 0.05) from AB2 (90% wheat flour and 10% walnut flour) and AB5 (50% wheat flour and 50% walnut flour). This showed that a high supplementation of walnut flour reduced the WAC of the flour samples. The effect of low water absorption capacity of the flour samples was probably due to the loose association of amylose and amylopectin in the native granules of starch and weaker associative forces maintaining the granules structure [29] .
The bulk density of the flour samples were found to be between 0.52 g/ml to 0.78 g/ml. Sample AB3 (80% wheat flour and 20% walnut flour) was significantly different from other samples at (p < 0.05) because it had the highest bulk density, closely followed by sample AB4 (70% wheat flour and 30% walnut flour) (0.78 g/ml) which also differed significantly from other samples at (p < 0.05). Sample AB5 (50% wheat flour and 50% walnut flour) had the least value (0.52 g/ml). Sample AB1 (100% wheat flour) and AB2 (90% wheat flour and 10% walnut flour) were not significantly different (p > 0.05) from each other (0.62 g/ml) but were significantly different from the rest of the samples at (p < 0.05). The bulk density of the flour samples increased with 20% substitution of walnut flour to wheat flour but at 30% and 50% substitution of walnut flour, the bulk density tended to reduce. The change in bulk density is generally affected by the particle size and the density of the flour, it is very important in determining packaging requirement and material handling [30] .
The swelling capacity of the flour blends ranged from 2.00 g/g to 7.53 g/g. Sample AB5 (50% wheat flour and 50% walnut flour) was significantly different from other flour samples at (p < 0.05) and had the highest value (7.53 g/g). Sample AB1 (100% wheat flour) (2.00 g/g) and AB2 (90% wheat flour and 10% walnut flour) (2.03 g/g) were not significantly different from each other but were significantly different from the rest of the
Table 3 . Functional properties of the Wheat/Walnut flour samples.
Values are means ± standard deviation of triplicate determination; Means with different superscript in the same column are significantly different at p < 0.05; AB1 (100% wheat flour), AB2 (90% wheat flour and 10% walnut flour); AB3 (80% wheat flour and 20% walnut flour); AB4 (70% wheat flour and 30% walnut flour); AB5 (50% wheat flour and 50% walnut flour).
samples at (p < 0.05). Walnut flour tended to increase the swelling capacity of the flour samples at different levels of substitution. [31] reported that the swelling capacity of flour granules is an indication of the extent of associative forces within the granule. The variation in the swelling capacity indicates the degree of exposure of the internal structure of the starch present in the flour to the action of water [32] .
The pasting properties are shown in Table 4 below. Pasting properties are the most commonly assessed set of quality characteristics probably because the methods are well established and have been proven to be a reliable predictor of flour quality. The pasting properties are important as it is used in predicting the pasting behavior and ability of the flour samples. The peak viscosity value ranged from 42.30RVU to 92.69RVU. The highest value was recorded for AB1 (100% wheat flour) while the lowest value was recorded for AB5 (50% wheat flour substituted with 50% walnut flour). There were significant differences among the five flour samples at (p < 0.05) and it was observed that the higher the quantity of walnut substituted, the more the reduction in peak viscosity of the flour samples. The peak viscosity is indicative of the strength of pastes, which are formed from gelatinization during processing in food applications. It also reflects the extent of granule swelling [33] . It also provides an indication of the viscous load likely to be encountered during mixing. The trough value ranged from 39.60RVU to 59.19RVU while the breakdown ranged from 25.57RVU to 66.30RVU. The highest value of the trough and breakdown was recorded for AB1 (100% wheat flour) while the lowest value of the trough and breakdown was recorded in AB5 (50% wheat flour substituted with 50% walnut flour). There were significant differences among the five flour samples at (p < 0.05) which meant that the higher the quantity of walnut substituted, the lesser the trough and breakdown values of the flour samples. Breakdown viscosity reflects the stability of the paste during processing. The higher the breakdown in viscosity, the lower the ability of the starch in the flour samples to withstand heating and shear stress during [34] . It was also reported by [35] that high breakdown value indicates relative weakness of the swollen starch granules against hot shearing while low breakdown values indicate that the starch in question possesses cross-linking properties. Final viscosity value ranged from 252.09RVU to 95.51RVU while Set back viscosity value ranged from 55.93RVU to 192.85RVU. The highest value of the final viscosity and setback viscosity was recorded for AB1 (100% wheat flour) while the lowest value was recorded in AB5 (50% wheat flour substituted with 50% walnut flour).
There were significant differences among the flour samples for final viscosity and setback. The final viscosity and setback viscosity decreased with an increase in substitution of the walnut flour. Final viscosities are important in determining ability of the flour sample to form a gel during processing while Set back viscosity indicates gel stability and potential for retrogradation [33] [36] . [35] also reported that high setback value is an indication of the propensity of the starch molecules to disperse in hot paste and re-associate readily during cooling. Peak time value ranged from 6.49 min to 6.84 min while pasting temperature value ranged from 91.47˚C to 94.56˚C. The attainment of the pasting temperature is essential in ensuring swelling, gelatinization and subsequent gel formation during processing. The pasting temperature (PT) is the temperature at which the viscosity starts to rise [33] [37] .
The plot of viscosity of the flour samples against heating time was shown in Figure 1, Figure 2, Figure 3, Figure 4, and Figure 5 respectively. Pasting temperature (PTT) was 94.56˚C, 91.47˚C, 92.09˚C, 92.50˚C and 93.20˚C respectively for samples AB1, AB2, AB3, AB4 and AB5; while corresponding values for peak viscosity (PV) were 92.69, 58.38, 45.51, 43.95, and 42.30 Rapid visco analyzer units (RVU), final viscosity were
Table 4 . Pasting properties of the wheat/walnut flours.
BD—BREAKDOWN, PT—PASTING TIME, PV—PEAK VISCOSITY, FV—FINAL VISCOSITY, PTT—PASTING TEMPERATURE; Values are means ± standard deviation of triplicate determination; Means with different superscript in the same column are significantly different at p < 0.05. AB1 (100% wheat flour); AB2 (90% wheat flour and 10% walnut flour); AB3 (80% wheat flour and 20% walnut flour); AB4 (70% wheat flour and 30% walnut flour); AB5 (50% wheat flour and 50% walnut flour).

Figure 1. Influence of heating time on the viscosity of sample AB1 (100% wheat flour).

Figure 2. Influence of heating time on the viscosity of sample AB2 (90% wheat flour and 10% walnut flour).
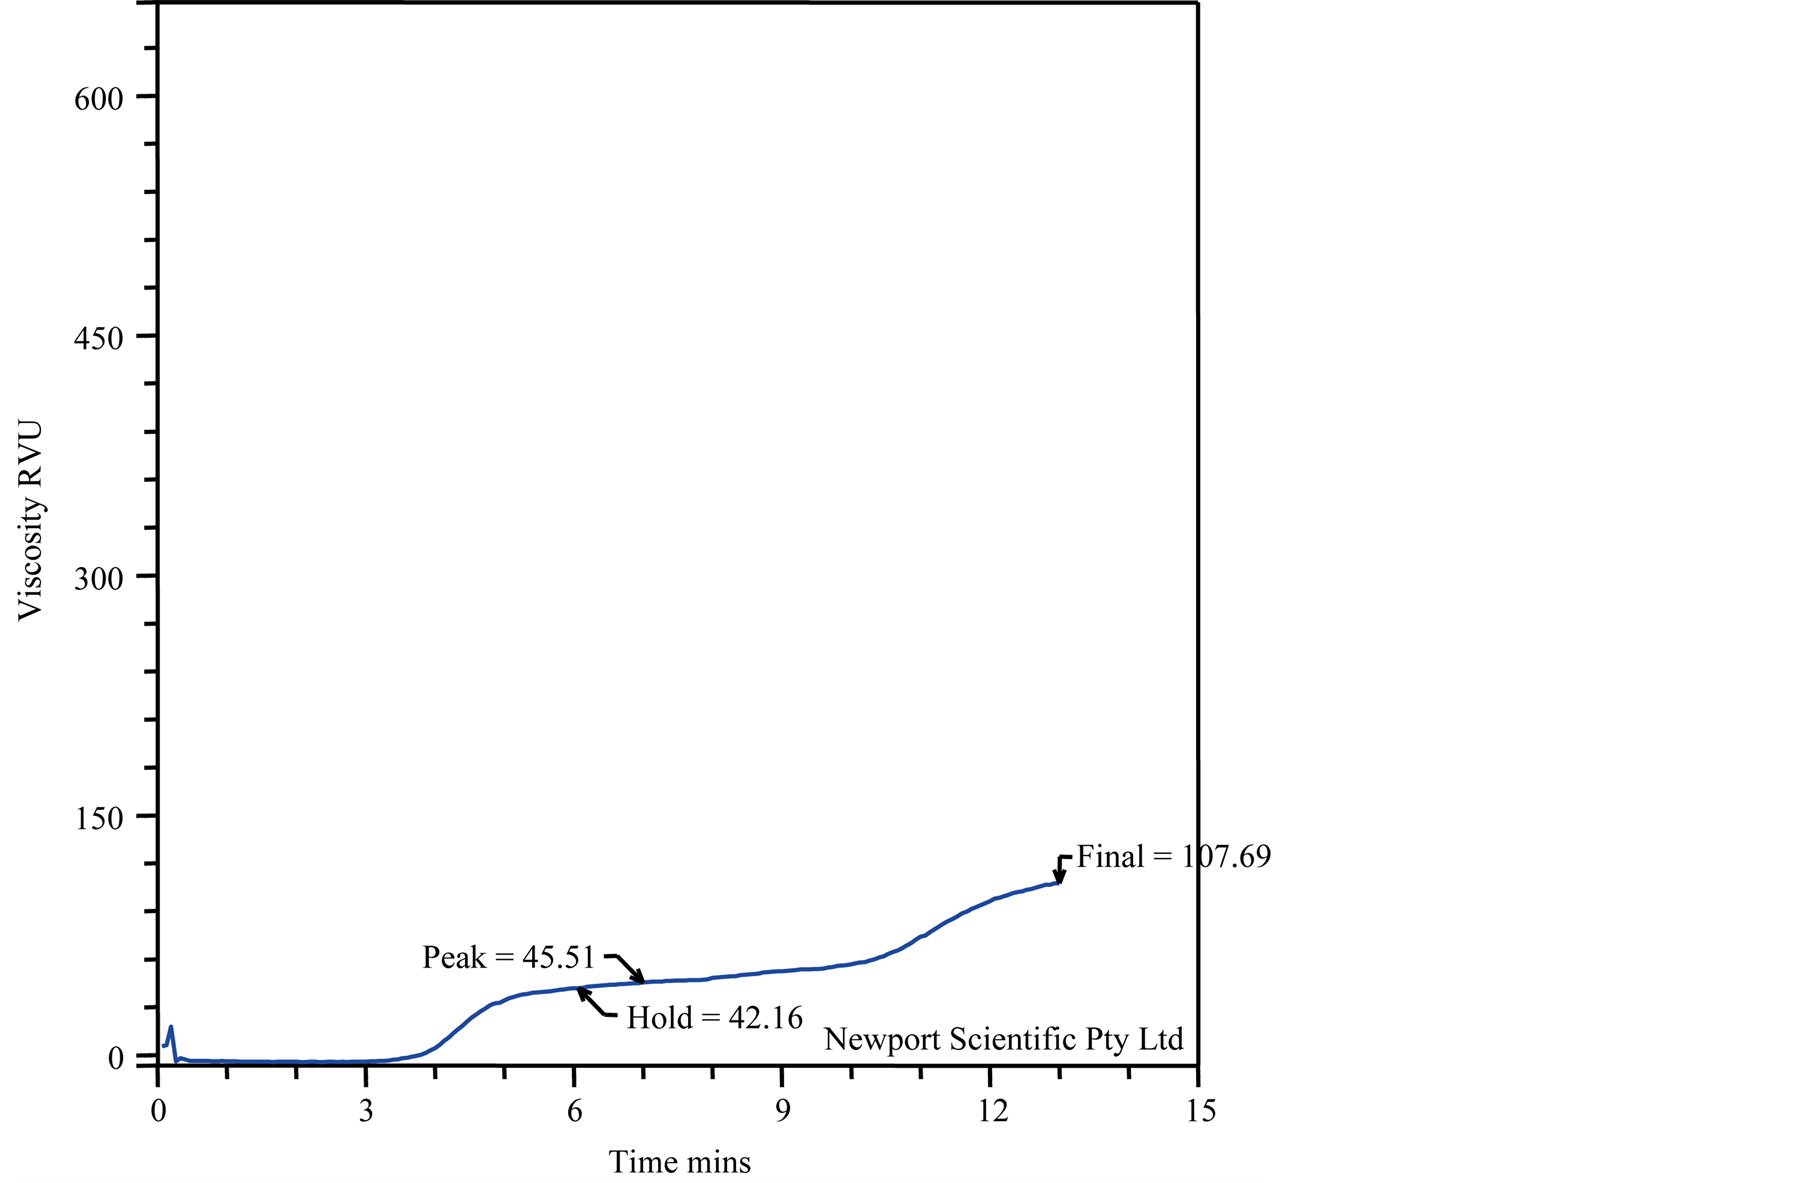
Figure 3. Influence of heating time on the viscosity of sample AB3 (80% wheat flour and 20% walnut flour).
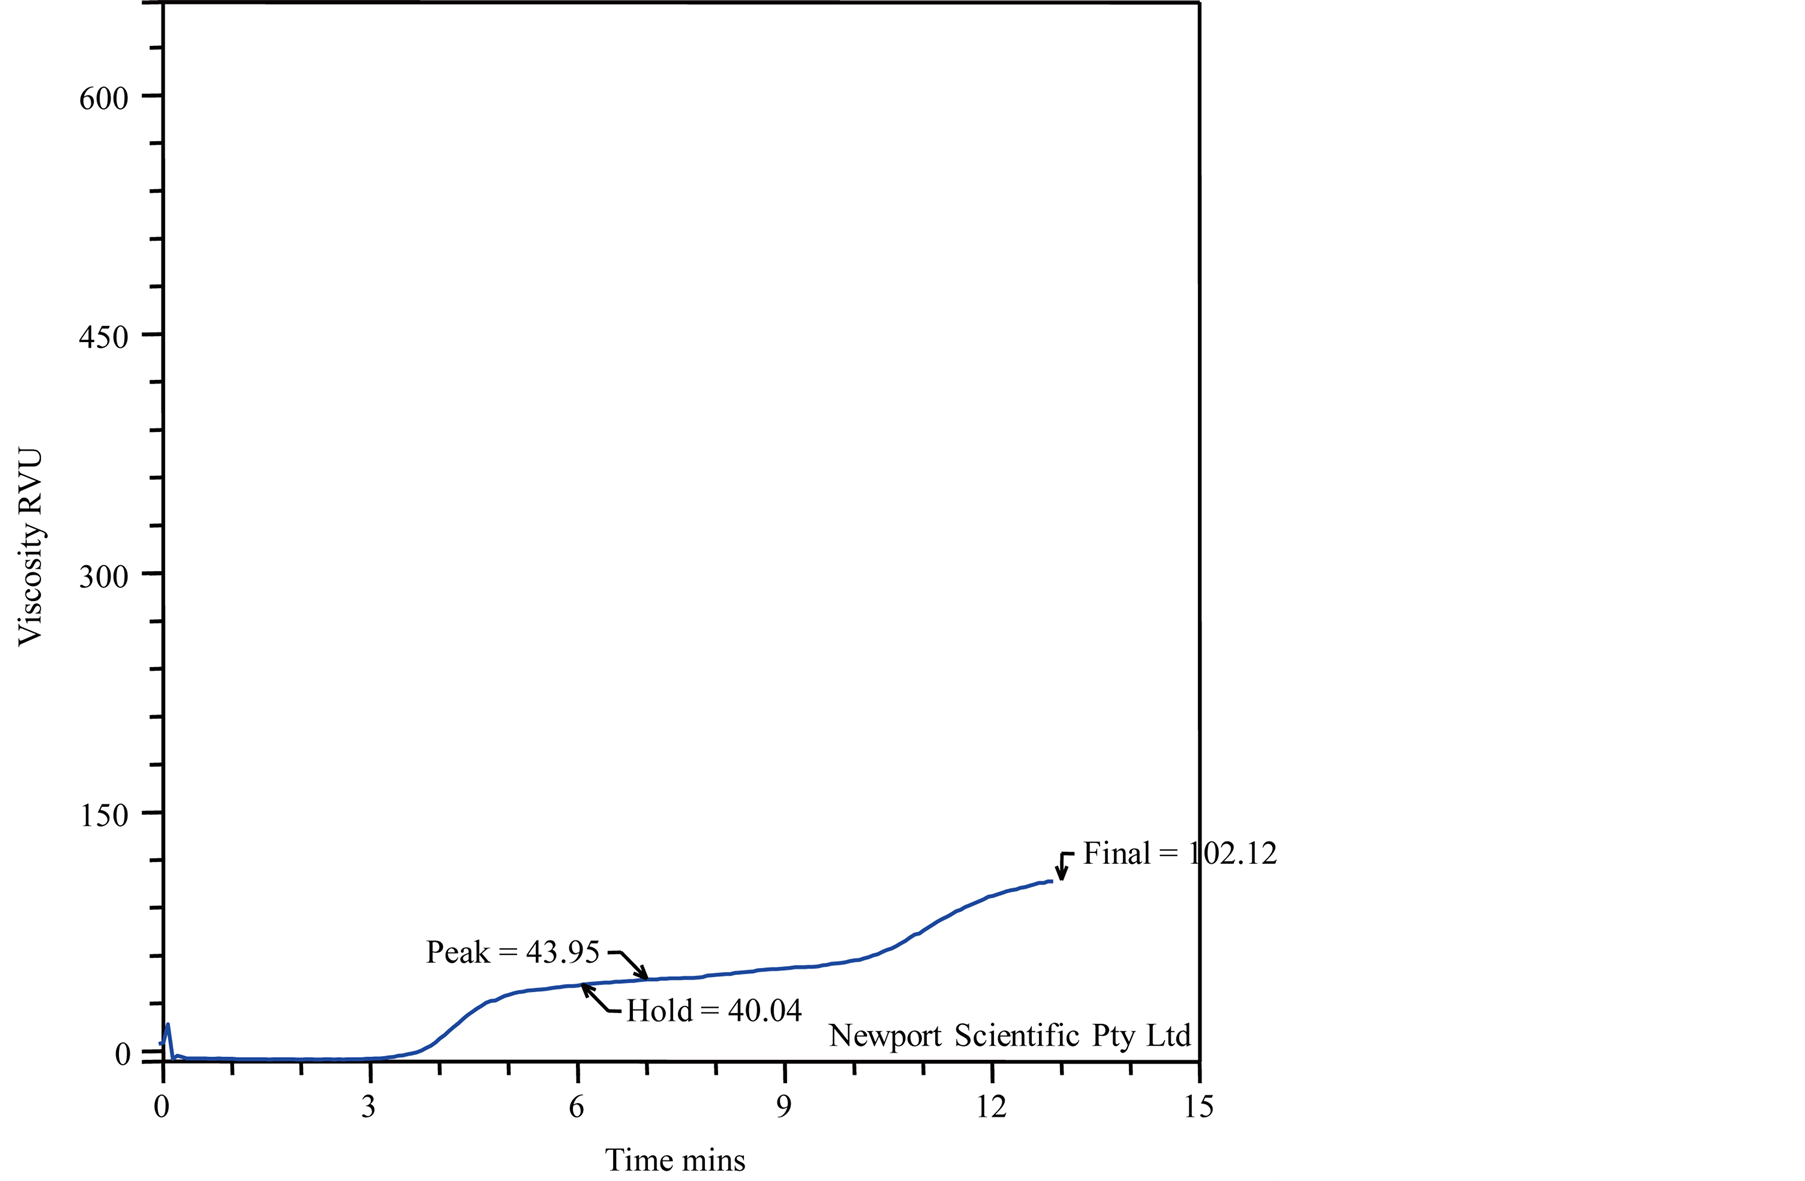
Figure 4. Influence of heating time on the viscosity of sample AB4 (70% wheat flour and 30% walnut flour).

Figure 5. Influence of heating time on the viscosity of sample AB5 (50% wheat flour and 50% walnut flour).
252.09, 146.78, 107.69, 102.12, 95.51 Rapid visco analyzer units (RVU), and trough value 59.19, 55.09, 42.16, 40.04, 39.06 Rapid visco analyzer units (RVU) respectively (Table 3).
These observations could be attributed to the differences in chemical composition of starch and the nature of bonding within the starch structure [38] . [39] also reported that starch damage influences dough rheology and the baking quality of flour. The rheological behavior of dough has been reported to depend on its flour composition.
5. Conclusion
The result obtained from the study has shown that supplementing wheat flour with walnut flour resulted in considerable improvement in the protein and fat content of the flour. The inclusion of 50% walnut flour to wheat flour improved the crude protein and ash contents from 12.7% to 25.17% and 2.4% to 37.57% respectively. However, adequate care needs to be taken during the storage of the composite flour sample to prevent oxidative rancidity due to the high fat content and the quality of walnut oil. The result of some of the functional properties of the composite flour samples showed high water absorption capacities which ranged between 4.03 g/g and 5.17 g/g and swelling power which ranged from 2.00 g/g to 7.53 g/g which indicated that they could find useful application for making of pastries like cakes and other snacks, since hydration is required, to improve the handling characteristics of baked products. The pasting properties result showed that the substitution of wheat flour with walnut flour had reduced the pasting properties, however the values were still high and within the range for stable products during processing and storage.