Interpretation of Pharmaceutical Pictograms by Pharmacy and Non-Pharmacy University Students ()
1. Introduction
Pictograms can be defined as descriptive symbols that illustrate information [1] . According to the United States Pharmacopeial Convention (USPC) [2] , pharmaceutical pictograms are defined as “standardized graphic images that help convey medication instruction, precautions and/or warnings to patients and consumers” [3] . Pictograms can be used both as substitute and as an enhancement for the written and verbal language [4] . Pictograms are not only useful for the poor literacy patients but also for the literate individuals because they can serve as one of the easiest, most important means of providing information to patients [5] . They can be also helpful to visually impaired, elderly people, or those with language barrier. An integral part of the pharmaceutical care process involves patients counseling and education to prepare and motivate them to comply with their medication regimens and monitoring plans [6] . The presence of pharmaceutical pictograms enhances compliance and improves patient comprehension of instructions. Pictograms are also important to the pharmacists, as they are directly involved in providing information to the patients when dispensing medication [7] .
Illiterate patients are at risk of misunderstanding and may not easily comprehend written instructions [8] . This also applies to elderly patients and those with impaired vision and receiving multiple medications. Pictograms have also been found of some assistance to tourists and immigrants who do not understand the native language [4] . Several studies showed that there are considerable problems with the pharmaceutical pictogram implementation, and it has been suggested that in practice they are not always effective [5] [8] -[11] . Culturally inappropriately designed pictograms may lead to wrong interpretation particularly to illiterate populations [4] [8] [9] .
International standards have been established for evaluating the comprehensibility of pictorial symbols. It has been suggested by the ANSI that in a comprehension test, a pictogram must reach at least a criterion of 85 percents of correct answers [12] . These standards have been used by many researchers in the evaluation of pharmaceutical pictograms. The present study was carried out to compare between the ability of pharmacy and pharmacy students to correctly interpret international pharmaceutical pictograms.
2. Methods
A cross-sectional study was conducted at the University of Sharjah, Sharjah, United Arab Emirates during the fall semester of the academic year 2013-2014. A total of 300 students participated in the study comprising 150 pharmacy students (12 males and 138 females) 150 non-pharmacy students (55 males and 95 females) from various non medical colleges of the university. The participants were selected using convenience sampling and voluntary participation. The study was approved by the research and Ethics Committee of the Colleges of Medicine and Health Sciences, University of Sharjah, United Arab Emirates (UAE).
Twenty-eight pharmaceutical pictograms of the United States pharmacopoeia (USP) were used in this study [2] . These 28 pictograms were selected as they are used commonly by other investigators in previously reported studies [3] . They were mounted on A4 papers in black and white. The pharmaceutical pictograms were classified into three categories: mandatory, prohibition and warning. Mandatory pharmaceutical pictograms indicate that the corresponding pictogram requires an action, prohibition pharmaceutical pictograms forbid an action, and warning pharmaceutical pictograms refer to a definite hazard. The fourteen mandatory pictograms included: “take 1 hour before meals”, “store in refrigerator”, “take by mouth”, “take at bed time”, “dilute with water”, “shake well”, “drink additional water”, “take 3 times a day with meals”, “place eye drops in the lower eyelids”, “inhaler”, “wash hands/insert into rectum/wash hands again”, “chew”, “read the label” and “for headache”. The twelve prohibition pictograms involved: “do not take if pregnant”, “do not use with additional salt”, “do not drink alcohol while taking this medicine”, “do not share your medicine with other”, “do not freeze”, “do not swallow”, “do not take with milk or other dairy products”, “do not crush tablets or open capsules”, “do not store medicine where children can get it”, “do not take other medicines with this medicine”, “if this medicine makes you dizzy do not drive” and “do not store near heat or in sunlight”. The two warning pictograms were: “poison” and “this medicine may make you drowsy”.
A structured questionnaire was designed to collect the data. At the onset, participants were informed about the study and the purpose of the study. Participants were told that this survey is conducted only to assess their interpretation of pictograms to examine whether they convey the intended instruction. For each participant a verbal consent was obtained. The demographic data of the participants like the age, gender and their educational level were collected. The participants were asked to answer relevant questions about whether they recommend the inclusion of pictograms as an illustrating tool in medication leaflet and label or not, and whether they are helpful for illiterate, elderly, visually impaired, people with language barriers, or for all individuals. The participants were asked as well if they pay attention to the auxiliary warning label on the medication package or insert. The participants were instructed to study the pictograms and write the relevant interpretation in the space beneath each pictogram. After collecting the surveys back, the correct meaning of each pictogram was explained to all respondents.
In assessing the interpretations of pictograms provided by the participants, a response was considered fully correct (C) if the participants’ answer is complete as stated in the USP-DI, while answers that were partly correct but not complete were considered partially correct (PC). On the other hand participants who wrongly expressed the meaning, their answers were considered not correct (NC). If a participant did not write an answer for a pictogram, their response considered as not answered (NA).
Statistical differences between pharmacy and non-pharmacy groups in term of comprehension of pictograms were calculated using SSPS (version 18). The level of significance was set at p < 0.05.
3. Results
The questionnaire was distributed 300 students of the University of Sharjah. The current study was conducted in the University of Sharjah. Response rate was 100%. Participants were grouped as pharmacy (150, 50%) and non-pharmacy (150, 50%) students. The latter group included students from various non-healthcare colleges. Out of the total number of participants, 67 (22.3%) were males and 233 (77.7%) were females. The mean age was 21 (17 - 25) years.
Paying attention to auxiliary warning label in the medication package or insert was reported by 113 (75.3%) and 86 (57.3%) students of pharmacy and non-pharmacy students respectively. Again, more pharmacy (144, 96%) than non-pharmacy (129, 86%) students approved the inclusion of pictograms in medication leaflet and label. Responses to questions regarding the usefulness of pictograms to all patients, those with language barrier, elderly patients, illiterate patients or those who are visually impaired are illustrated in Figure 1.
The results of correct interpretation of mandatory, inhibitory and warning pictograms by pharmacy and nonpharmacy students are shown in Table 1 and Table2 Interpretation percentage of the mandatory pictograms by the pharmacy students ranged from as low as (2.7%) to as high as (95.3%), whereas among the non-pharmacy students the percentage ranged from as low as (10.7%) to as high as (91.3%). Statistically significant differences were observed in 11 out of 14 (78.6%) mandatory pictograms (Table 1). There was no statistically significant differences with regard to 3 out of 14 (21.4%) mandatory pictograms, these pictograms are: Take 1 hour before meals (P = 0.512), Shake well (P = 0.376), Place drops in lower eyelids (P = 0.06).
Concerning the prohibition pictograms, the percentage of correct interpretations by pharmacy and non-pharmacy students ranged from as low as (20%) to as high as (98%). Ten pictograms from the 12 prohibition pictograms (83.3%) showed statistically significant differences were observed between the two groups in their interpretation of 10 out of the 12 prohibition pictograms (Table 2). Regarding the other two prohibition pictograms Do not take if pregnant (P = 0.065), Do not share your medicine with others (P = 0.4), there was no statistically significant difference observed between the two groups.
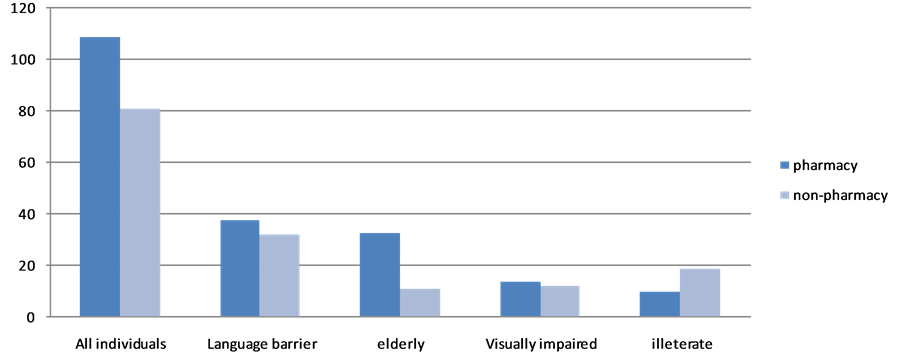
Figure 1. Responses of pharmacy and non-pharmacy students to question with regard to which patients pictograms are most useful.

Table 1. Interpretation of mandatory pictograms by pharmacy and non-pharmacy students.
*P < 0.05 is considered statistically significant.
Table 2. Interpretation of prohibition and warning pictograms by pharmacy and non-pharmacy students.
*P < 0.05 is considered statistically significant.
As shown in Table 2, statistically significant (P < 0.0003) difference was observed between the two groups in interpreting the warning pictogram “This medicine makes you drowsy” while there was no statistically significant differences with regard to the pictogram “Poison” (P = 0.172).
4. Discussion
For effective medical treatment, patients need to use medicines as directed and pictograms are of benefit to the comprehension and recall of prescription instructions. It has been suggested that patients who are given “natural language plus pictogram” labels understand information better than patients with only “natural language labels” [6] . In addition to influence of age, impaired vision, lack of literacy skills and language barriers, heavily loaded physician and pharmacists may not provide patients with enough instructions on how to store and use medicines. One approach to help patients to understand medication instructions, improve compliance and decrease adverse events is to use visual aids such as pictograms. This study was carried out to assess the understandability and interpretation of pharmaceutical pictograms by pharmacy and non-pharmacy university students in order to assess the impact of medical background on the interpretation and understanding of pharmaceutical pictograms. The higher female: male ratio is a general trend in all medical and health sciences colleges of the university. Participants were young with an average age of 21 years. It has been suggested that young population a high degree of visual literacy because of frequent exposure to video games and computers [13] . Moreover, standard education has been reported to influence the ability to interpret pictorial pharmaceutical instructions [4] .
In the present study, about one third of the participants reported that they do not pay attention to the auxiliary warning labels on the medication package or medication insert, this can be due to the small handwriting or difficulty to understand them [14] . However, in agreement with earlier findings [8] , slightly more than 90% of the students reported that the inclusion of pharmaceutical pictograms as an illustrating tool in medication leaflet is beneficial.
Regarding the interpretation of the mandatory pictograms, the most comprehensible pictogram by the pharmacy students was “Take at bed time” which was recognized by 95.33% of students, while for the non-pharmacy students, the most comprehensible pictogram was “shake well” that was interpreted correctly by 91.3% students. The pictogram “for headache” scored the lowest percentage of correct answers, 2.7% and 10.7% for the pharmacy and non-pharmacy participants respectively, the interpretation that was suggested for this pictogram by the participants was that “taking this medication will cause headache”. Results of the pictogram “chew” also showed low level of comprehension and the percentage of correct interpretation was below 50% in both groups. Frequent wrong interpretations that were provided for “chew” pictogram were “place under the tongue”, “do not crush” and “dissolve in the mouth”. Regarding the interpretation of prohibition pictograms, the percentage of correct answers varied between pharmacy and non-pharmacy students. The Pictogram “Do not store medicine where children can get it” scored the highest percentage of correct answers (98%) by the pharmacy students. Among the non-pharmacy students the pictogram “Don’t take if pregnant” had the highest percentage of correct answers (92.7%). The high percentage of correct interpretation in these 2 pictograms is due to the simplicity and connection with things encountered in daily life. In both groups, the lowest percentage of correct answers by pharmacy (24%) and non-pharmacy (20%) students was scored by the pictogram “do not share your medicine with others”. For this pictogram, wrong interpretations suggested by the students included “don’t touch your medicine by hand”, “don’t take an overdose from your medication” and “don’t throw the medicine”. In addition, many students did not attempt to interpret the pictogram and stated that it is not clear or difficult to interpret.
One of the most frequent comments and feedbacks from pharmacy and non-pharmacy students was that the “Rx” symbol that is present in many pictograms is not understood and confusing for them and many students did not provide an answer just because they did not know what the “Rx” means. Pictograms with “Rx” symbol include “do not freeze”, “do not share your medicine with others”, “do not take other medicines with this medicine”, “dilute with water”, and “store in refrigerator”.
For the pictogram “Do not drink alcohol while taking this medicine”, the incorrect interpretations given clearly indicate a cultural influence. Many respondents suggested “not to be taken with soft drinks”, “not to be taken with food” or “not to be taken with desserts”. This recalls the culture and sensitivity issues of pictograms that were frequently stressed by other investigators [8] [9] [15] . Previous studies have shown that patients not only prefer but are also more likely to correctly interpret pictograms which reflect their cultural beliefs and surrounding environments [16] .
Consistent with earlier findings [3] , the “Poison” pictogram achieved a high percentage of correct interpretation in both groups. This is most probably because the “skull” sign is a very common sign and is used worldwide. Concerning the pictogram “This medicine makes you drowsy” there were surprising interpretations suggested by pharmacy and non-pharmacy students. These include: “this medicine cause cough”, “breathe deeply before taking medicine” and “take the medicine at bedtime”. As a matter of fact, many students were confused between the pictograms “take at bed time” and “This medicine makes you drowsy”.
The level of understandability and interpretation of the pharmaceutical pictograms shows a difference between the pharmacy and non-pharmacy students. Twelve (42.9%), and only 5 (17.9%) of the 28 pictograms achieved the ANSI requirement of 85% correctness criterion by the pharmacy and non-pharmacy students respectively. These differences can be attributed to the medical background of the pharmacy students, their familiarity with the medications and their instructions, and maybe this low level of pharmaceutical pictograms comprehension by the non-pharmacy students is because they do not have any pharmacy related topic in their curriculum, and this explains why they took a long time to answer the survey. Furthermore, upon asking the non-pharmacy students about their feedbacks, they complaint of the difficulty of the pictograms and stated that most of them were ambiguous.
These differences can be attributed to the medical background of the pharmacy students, their familiarity with the medications and their instructions, and maybe this low level of pharmaceutical pictograms comprehension by the non-pharmacy students is because they do not have any pharmacy related topic in their curriculum, and this explains why they took a long time to answer the survey. This finding is in contrast with a comparative study that assessed the understanding of pictograms among pharmacy and non-pharmacy students and revealed that non-pharmacy postgraduates were better placed than the pharmacy students [17] .
Furthermore, upon asking the non-pharmacy students about their feedbacks, they complaint of the difficulty of the pictograms and stated that most of them were ambiguous.
5. Conclusion
The findings of this study emphasize the need for locally designed and culturally customized pictograms. Culturally relevant pictograms will be easier to understand and interpret than the international pictograms that might not be suitable for certain societies. Pharmacists can play a crucial role in counseling patients and helping them understand and interpret the pictograms correctly. Moreover, pharmacists should be involved in the designing of pictograms along with the graphic artist. Local pictograms designing should use minimal distracting details, simple language and linking captions with pictures [8] . This study suggests and reinforces the idea of introducing pictograms as a topic in pharmacy curriculum. Moreover, educational sessions of pictograms for all university students and the public to increase their awareness and better understanding of pharmaceutical pictograms will be certainly beneficial.
Acknowledgments
We are indebted to all the students of the University of Sharjah-United Arab Emirates who voluntarily participated in the study.
NOTES
*Corresponding author.