Determination of Young Olive-Tree Water Consumption with Drainage Lysimeters ()
Keywords
Evapotranspiration, Crop Coefficients, Irrigation Requirements, Olea europea L.

1. Introduction
The olive tree is traditionally grown in rainfed conditions in a Mediterranean climate. However, there are several studies proving that this crop has a good response to irrigation, as it enhances young plant growth, increases adult plant olive production in weight [1] -[3] , and shows a rapid adaptation in the transition from a rainfed to an irrigated system [4] .
An important expansion of olive-tree production began in Uruguay in 2003. With a sustained increase, the cultivated area has now reached 9000 hectares, according to the Uruguayan Olive-tree Association [5] . Most of the information regarding olive trees has been generated in arid or semi-arid climates, while there is scarce information for this crop in sub-humid climates, as Uruguay. Generation of local knowledge on crop evapotranspiration (ETc) is crucial for an efficient irrigation management, which would enable fitting irrigation volume and frequency to crop requirements.
ETc can be determined exactly with the use of lysimeters [6] . It is possible to adjust crop coefficients (Kc) using this data and that of the reference evapotranspiration (ETo) obtained from weather data supplied by a nearby climate station. The use of these coefficients enables to estimate ETc with a simple method of double step estimation: first ETo is calculated using climate parameters; then it is multiplied by Kc to consider crop specificity (ETc = ETo × Kc). The Penman Monteith-FAO equation (ETo-PM) gives a rather accurate estimation of ETo. Therefore, estimating ETc successfully with this double step method depends greatly on the accuracy of the Kc adjustment, which varies according to species, developmental stage and orchard management [7] .
The aim of our study was to generate information regarding olive-tree water consumption in Uruguay allowing irrigation adjustment, in order to promote a rational and sustainable use of both water and energy.
2. Materials and Methods
Six drainage lysimeters (1.9 × 0.9 × 1.35 m depth) were located in the National Agriculture Research Institute, INIA-Las Brujas Experimental Station (34˚40'S; 56˚20'W). These devices were protected from rain by a rain-out shelter, which would close automatically every time rain exceeded 3 mm.
In each lysimeter an olive tree (Olea europea L. cv. Arbequina) of different age and size was planted. We measured the water consumed by the plants during two seasons: 2010-2011 and 2011-2012. Lysimeters #1 and #12 had plants brought directly from nursery; lysimeters #2 and #11 got 2-yr-old plants; and lysimeters #3 and #10 got 4-yr-old plants (Figure 1). Grown plants were obtained from a commercial orchard.
Lysimeters were surrounded by irrigated crops to avoid an “oasis” effect as a consequence of advective processes, alternating oat and wheat in the first and second winters, respectively with sorghum in summer. The separation between lysimeters with olive trees simulated a plantation framework of 2.5 × 5.5 m (Figure 1).
The lysimeters were backfilled in layers, following the local profile horizons sequence and respecting bulk density corresponding to each horizon. The soil profile consisted of a sequence of four horizons (0 - 0.20 m; 0.20 - 0.40 m; 0.40 - 0.60 m and >0.60 m), mainly silty clay loam texture, described in detail in a previous work [8] .
Each lysimeter was irrigated with three self-compensating drippers (4 L∙h−1 per emitter) located in line spaced at 0.63 m (Figure 1). Excessive irrigation prior to the evaluation period assured that the whole backfilled soil had a water content corresponding to field capacity (FC). Irrigation management was adjusted so as to produce a slight drainage within the lysimeters with the largest plants, which would imply non-limiting water content in all of them.
Soil moisture corresponding to FC was determined for each horizon in a lysimeter without vegetation. There the soil was saturated with water, covered with a polyethylene film and left to drain for four days. Following, two soil samples of each depth were taken to determine soil moisture by the gravimetric method. Values were averaged for each horizon. Soil moistures corresponding to permanent wilting point (PWP) was estimated using Equation (1), which has been calibrated for Uruguayan soils [9] :
 (1)
(1)
where FC is field capacity (percent dry weight).
Soil water content variation in backfilled soil of each lysimeter was measured with a neutron probe (model 503 DR Hydroprobe). A 1-meter aluminum access tube was installed in each lysimeter to monitor soil moisture through the whole depth. This tube was located 0.20 m from the surface drip line (orthogonally), and at an equal

Figure 1. Schematic presentation of the lysimeter disposition, irrigation equipment, and access tubes for a neutron probe.
distance from the two nearest emitters (Figure 1). Measurements at the depths 0.20; 0.40; 0.60 and 0.80 m, were conducted twice a week, before irrigation, following published methodology [10] -[12] . The neutron probe was calibrated with the gravimetric method for each measured depth and then multiplied by bulk density to obtain volumetric moisture content [13] . Irrigation and drainage water volumes in each lysimeter were recorded on a daily basis. There were no rain entries due to the rain-out shelter.
ETc was calculated by water volume balance following Equation (2):
 (2)
(2)
where ETc is real olive-tree evapotranspiration; I is irrigation; D is drainage and ∆Hs is soil moisture variation.
Stem water potential (ψ stem) was measured with a Scholander pressure chamber [14] , on clear days every fortnight at noon, during months of maximum atmospheric demand, to contrast the appropriate plant water status. Each date, two small branches of the current year per tree were measured. These branches were selected from the sunny periphery and located in the mid height of the canopy [15] [16] .
Longitudinal and transversal diameters and upper and lower canopy heights were measured with a ruler every three months. The area corresponding to the horizontal canopy projection was calculated as a circle and the canopy volume as a sphere.
Periods of water consumption which met the following criteria were eliminated:
1) Available water descended below 50%. This is a safe criterion since it is stated in the literature that it is possible to allow 75% of available water depletion without stomatal adjustment [17] . Decrease in soil moisture in the first 0.20 m was not considered for this study, since water in this depth may be lost by evaporation, independently from crop water consumption [18] .
2) Lysimeters drainage was obstructed and available water increased over 100%.
3) ψ stem values were below −1.5 MPa. There are references in the literature of normal ψ stem values for irrigated trees within the range −0.8 to −2.0 MPa [15] [19] .
4) Plants showed stress symptoms. 4-yr-old plants suffered leaf drop immediately after transplant in the lysimeters. The plant in lysimeter #10 recovered by 21st December 2010, while the plant in lysimeter #3 never reached an optimum foliage density, and was therefore eliminated from the evaluation process.
ETo was calculated with ETo-PM [7] , using daily climate data provided by the INIA-Las Brujas Experimental Station located 500 m from the experiment. Water consumption values, ETc L∙d−1, were averaged within 7- to 14-day periods, due to changes in soil water retention [6] [20] . These values were expressed in mm∙d−1, and referred to a 2.5 × 5.5 m plantation framework without vegetation cover.
The crop coefficient corresponding to summer months (Kc mid) was adjusted as the ratio between ETc (in mm∙d−1) and ETo-PM, from 21st December to 21st March. The functions of plant water consumption (in L∙d−1) and Kc mid were adjusted with: age of trees, canopy cover percentage (horizontal projection of the canopy divided by the plantation framework of 2.5 × 5.5 m) and canopy volume (in m3).
3. Results and Discussion
3.1. Soil Water Content
Soil water parameters of the lysimeters’ backfill indicate a similarity among available water storage capacities of all the horizons (Table 1).
Figure 2 shows the neutron probe calibration for the four measured depths. Volumetric soil moisture and relative count (ratio) showed a linear relation with determination coefficients which ranged from 0.66 to 0.80.
Discrete measurements of soil moisture are shown as continuous lines to facilitate their visualization (Figure 3 and Figure 4). The irrigation strategy sought to maintain soil moisture at FC in the following depths: 0.40, 0.60 and 0.80 m. Within the first 0.20 m, water may have been lost due to evaporation independently from the crop water consumption [18] .
Monitoring soil moisture allowed discarding data of periods in which available water descended below 50% in any of the following depths: 0.40, 0.60 and 0.80 m. This occurred in lysimeter #2 from November 22, 2010 to February 25, 2011 (Figure 3) and in lysimeter #10 from February 22 to April 4, 2011 and November 5 to 12, 2012 (Figure 4). The rapid increase in the water consumption rate of these plants, due to a higher canopy density, produced a fast decline in soil moisture, which was difficult to revert given the low irrigation rate applied by the drippers.
Lysimeter #1 had the period from February 23 to April 2, 2012 discarded (Figure 3), since a temporal drainage obstruction saturated the soil, increasing soil moisture over 100% available water. There was no need to discard data periods of lysimeters #11 and #12, where the soil moisture was successfully maintained close to FC, making sure the plants developed under proper water availability conditions.
3.2. Stem Water Potential
All stem water potential measures ranged from −0.4 to −1.2 MPa. Values within this range have been cited as corresponding to plants in good water status conditions [3] [15] [19] , therefore there was no need to discard periods based on these measures.
3.3. Vegetative Growth
Figure 5 shows plant size expressed as the area of the horizontal projection and canopy volume reached in summer of both evaluated seasons.
In their transition from 3 to 4 years old, the intermediate plants duplicated their canopy area and quintupled their canopy volume; while the largest plant (lysimeter #10) increased its canopy area 40%, and its canopy volume 50% in its transition from five to six years old (Figure 5). This important growth took place under nonwater-limiting and good-drainage conditions.
Important increase in canopy volume in well irrigated trees compared to trees under continuous deficit irrigation (CDI) and under regulated deficit irrigation (RDI) has been reported before [11] .

Table 1. Soil water parameters of lysimeter backfill: Field Capacity (FC); Permanent Wilting Point (PWP) and Available Water (AW).

The largest plant (lysimeter #10) suffered total defoliation immediately after transplant and it slowly recovered during summer, the first evaluation season. Because of this, one of the intermediate plants which was 4 years old in the second evaluation year reached a larger canopy size in area and volume than this 5-yr-old plant in lysimeter #10 (Figure 5).
3.4. Water Consumption
Water consumption in L∙d−1 of all five plants followed the same seasonality pattern as the atmospheric demand


Figure 5. Relation between plant size (expressed both as projected area in m2-circlesand as canopy volume in m3-triangles-) and age of trees.
(ETo), recording the maximum values during December, January and the first fortnight of February (summer in Southern Hemisphere), while the minimum values were recorded during June, July and August (Figure 6).
The smallest plants reached their maximum water consumption of 12 and 13 L·d−1 during January 2011 in the first evaluation season. The following season, the maximum water consumption values of the same plants, also reached in January, were 16 and 18 L·d−1. The atmospheric demand (ETo) in January was c.a. 7 mm·d−1 in both seasons (Figure 6).
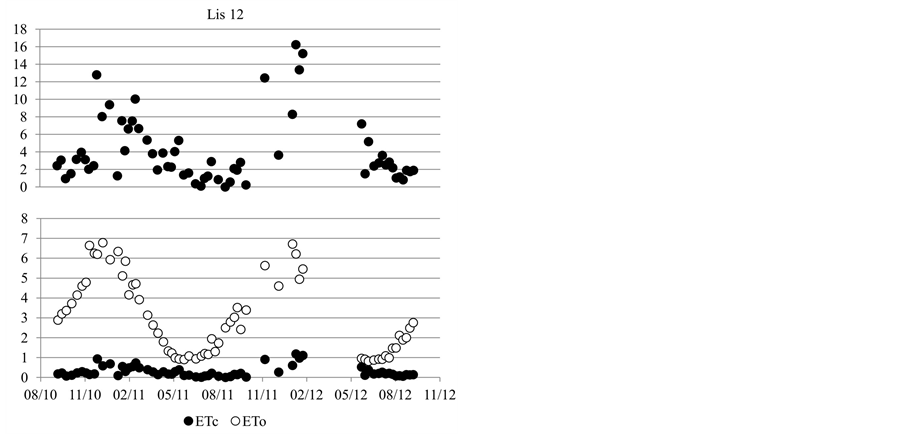

Figure 6. Water consumption in L∙d−1 of the two smallest plants, located in lysimeters #1 and #12 (above). ETo and ETc of the 2.5 × 5.5-m framework without vegetation cover (below).
The intermediate plants, in lysimeters #2 and #11, had maximum water consumption values of 14 and 13 L∙d−1, respectively, in the first season; and of 27 and 24 L∙d−1 respectively, in the second season (Figure 7). These consumption differences respond to differences in plant size, being the olive tree in lysimeter #2 larger than that in lysimeter #11, in the second evaluation season it presented 30% more area and 50% more canopy volume (4-yr-old plants in Figure 5).
The largest plant presented in January a maximum consumption of 19 L∙d−1 in the first evaluation season and of 30 L∙d−1 in the second one. As mentioned earlier, data of this olive tree corresponding to the period prior to 21st December 2010 was eliminated due to post-transplant defoliation.
Summer water consumption was analyzed relative to age of trees, canopy cover percentage, and canopy volume (Figure 8). The maximum water consumption included in the regression was the average of the summer month values of each plant each season. A significant positive linear relation was found (p < 0.01).
Canopy cover percentage was the parameter to explain most of the variation of plant water consumption (R2 = 0.85). Tree height, involved in the canopy volume calculation, did not improve the explanation to this variation. According to some authors, water consumption in humid and sub-humid climates should be more influenced by the net available radiation and its interception by the canopy, than by the aerodynamic phenomena which are enhanced by plant height [21] .
3.5. Maximum ETc and Kc Mid
As in the case of water consumption, ETc of all five evaluated plants (referred to the 2.5 × 5.5-m framework without vegetation cover) followed the same seasonality than ETo, recording the maximum values during December, January and the first fortnight of February, while the minimum values were recorded during June, July and August.
Both small plants had a maximum ETc slightly over 1.2 mm∙d−1 in the second season (Figure 6). A similar value, 1.29 mm∙d−1, has been reported for plants with the same features of age, cover percentage and interrow management; and with similar ETo values [22] .
The maximum ETc values of the intermediate plants in the second season were 2 mm∙d−1 and 1.7 mm∙d−1, corresponding to lysimeters #2 and #11, respectively (Figure 7). These values were slightly lower than those reported in the literature for plants which were one year younger (3 yrs old) and had a lower cover percentage than our plants [22] .
Some authors have stated that ETc determinations conducted in small areas surrounded by lower green crops should not be extrapolated to large areas with the same crop [21] . Generally, research papers report adult orchard data [23] [24] . However, one of the few papers that do report ETc values for young olive orchards with similar


Figure 7. Water consumption in L∙d−1 of the two intermediate plants, located in lysimeters #2 and #11 (above). ETo and ETc of the 2.5 × 5.5-m framework without vegetation cover (below).


Figure 8. Maximum plant water consumption in L∙d−1 plotted against age of trees, canopy cover percentage (within a 2.5 × 5.5-m plantation framework), and canopy volume.
atmospheric demands to those recorded in our study [22] , got similar ETc values to ours. This would imply that even if the installation of the lysimeters was not within an olive orchard of the same age, differences in aerodynamic phenomena may have played a minor role in determining ETc in our young plants.
The maximum ETc value of the largest plant in the second season was 2.2 mm∙d−1 (Figure 9).
Kc mid used for the regression was the average of the summer month values of each plant each season. There was a significant (p < 0.01) positive linear relation of Kc mid with age of trees, canopy cover percentage in the plantation framework, and canopy volume. Canopy cover percentage was the parameter to explain most of the variation of Kc mid (Figure 10).

Figure 9. Water consumption in L∙d−1 of the largest plant, located in lysimeter #10 (left). ETo and ETc of the 2.5 × 5.5-m framework without vegetation cover (right).

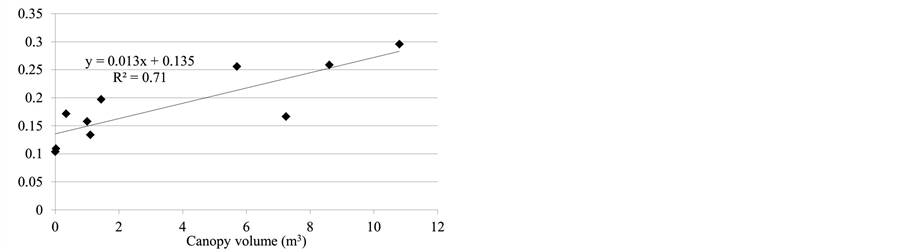
Figure 10. Summer crop coefficient (Kc mid) for the plantation framework 2.5 × 5.5 m relative to age of trees, canopy cover percentage in the plantation framework, and canopy volume in m3.
Other authors who have studied different fruit trees agree that the proportion of canopy intercepted light at midday, which essentially coincides with the percentage of shaded area, explains well both seasonally and yearly Kc variations [25] -[27] .
A similar relation has been found between the percentage of shaded area and averaged Kc of the summer months, in young orchards with a shaded area below 25% and in dry periods [22] . Our estimation for an orchard with 5% cover (small plants in their first evaluation year) corresponded to a Kc mid value of 0.14, similar to the 0.15 Kc value reported in the work cited above. Kc mid value for 46% cover, the maximum cover percentage reached by our large plant, was 0.29. This value was lower than a reported value for Córdoba, Spain, of 0.40, which had been adjusted with a simulation model [24] . This difference could be related to the relative impact of climate on Kc mid, presenting higher values for Córdoba’s arid summer, compared to lower values in a more humid climate, as in Uruguay. This effect grows stronger as the crop height increases [7] [18] .
4. Conclusions
This is one of the first studies in the world using lysimeters to measure water consumption of olive trees. Results of evapotranspiration and Kc mid presented herein are representative of young orchards, where radiation received by plants is not affected by shading of contiguous plants, and where aerodynamic phenomena influence each plant individually.
A positive linear relation was found between Kc mid (adjusted for the 2.5 × 5.5-m framework without vegetation cover) and canopy cover percentage. This relation is only valid for dry periods, on silty clay loam soils, with drip irrigation, and in orchards whose canopy cover does not exceed 46%.
Water consumption in L∙d−1 was strongly related to plant size. Canopy cover percentage was the variable to explain most of the variation in plant water consumption.
Full irrigation associated to good soil drainage resulted in a rapid growth of young plants. In one growth season, in their transition from 3 to 4 years old, intermediate plants duplicated their canopy area and quintupled their canopy volume. The larger plant increased the canopy area and canopy volume an average of 36% and 40%, respectively, in its transition from five to six years old. This rapid growth would accelerate the orchard’s entrance into full production, reaching it at a younger age.
In order to be able to separate the evapotranspiration into its two components: transpiration and direct evaporation from the soil, this study should be continued for at least another year. This is the information needed to enable the adjustment of Kcb and Ke coefficients, which, alongside with Kcb adjustment with the percentage of canopy radiation interception, will offer useful information to estimate ETc. Hence, it may be applied to a broader range of agriculture systems, including different plantation frameworks, as well as different wetting patterns caused by variations in a number of drippers per plant, water volume and/or spacing between drippers. However, the use of this information should be restricted to plants when they are young.