Electrical Resistivity Survey for Predicting Aquifer at Onicha-Ugbo, Delta State, Nigeria ()
1. Introduction
Onicha-Ugbo is a town located within latitude 6˚18'N and 6˚22'N and longitude 6˚20'E and 6˚26'E in the northern boundary of Aniocha North Local Government Area of Delta State, Nigeria. It is situated on a highland about 40 km from Asaba on the Asaba-Benin Express Road connecting the West to the East of Nigeria. OnichaUgbo is bordered to the East by Issele-Uku and Idumuje-Unor, to the West by Igbodo and Obior, to the North by Idumuje-Ugboko and Ewohinmi and to the South by Ubulu-Uku. The area is about 16 square kilometers and lies on a flat topographical terrain at an elevation of 260 m above mean sea level. There is no solid rock near the surface which is covered with clayey brick red sand. The vicinity of Onicha-Ugbo has no river. The nearest river is the Iyi Ugo in Aniofu and until recently people walked 6 km to the river or 4 km to the Oba-Bioseh spring in Idumuje-Ugboko or the Mkpitime Lake near the Igbodo border in search of clean water. In the rainy season, the people depended on family ponds and water collected during the rains as it cascades down the roofs of houses. In recent times, concrete underground wells were dug and rainwater is directed into them through gutters made round the base of corrugated iron sheet roofs. These wells serve the homes as water reservoirs against the dry seasons.
The increasing demand of water for domestic, industrial and agricultural purposes has led to widespread search in all geologic formation in Nigeria. The increasing population and reducing financial resources have led to a greater need for efficiency in sitting abstraction boreholes to sustain yield of good quality water. For development cost to be kept to a minimum, it is important to gather and assess, prior to drilling, as much information as possible relating to the aquifer, their structures, possible sources of recharge, variations in formation characteristics, the degree of saturation and, if possible the chemical quality of the groundwater within the area of interest. In an effort to locate good aquifer in Onicha-Ugbo, many wells have been drilled or dug with little success. This is because aquifers in structures near the top surface are often not capable for providing large and dependable supply of water needed for a city water system. Hence, the study reported here sought to examine the subsurface structures using geoelectrical resistivity techniques, with the aim of predicting a good aquifer suitable for both domestic and industrial use. This geoelectric method has been used successfully for subsurface investigation for groundwater conditions in the world [1] -[5] .
2. Geological Setting
The study area lies within the Niger Delta Basin situated in southern Nigeria (Figure 1). It covers an area of 75,000 sqkm. It is bounded to the west and northwest by the western African shield, which terminates at the Benin hinge line and to the east, by the Calabar hinge line. The Anambra basin and Abakaliki anticlinorium mark its northern limit. To the south, it is bounded by the gulf of Guinea [6] [7] .
The Niger Delta complex consists of sedimentary formations deposited in a high-energy deltaic environment and the overall sedimentary sequence is dominantly composed of sand, shale and clay [8] . The prodelta developed on the northern part of the basin during the Campanian transgression and terminated with the upper Maastrichian regression. The formation of the modern Niger Delta is made up of marshy land masses criss-crossed by numerous rivers and creeks whose banks are made up of levees with back swamps. The formation of the land mass has been explained to be a result of sediment deposition generally associated with the River Niger and its tributaries. The Cenozoic delta basin is said to have developed during the Cretaceous times from the RRR triple junction [9] . It is bounded by the basin flank to the northwest, the Calabar flank to the east west and the Anambra Basin to the north. Stratigraphically, the Niger Delta is made up of three lithologic units—Benin, Agbada and Akata Formations (Table 1). The Benin Formation is described as “Coastal plain sands”. It consists mainly of sand and gravels with thicknesses that can reach 2100 m [10] . The sands and sandstones are coarse to fine granular in texture and can be unconsolidated. The Agbada Formation consists mainly of sands, sandstones and siltstones. The sandstones or sands are very coarse to fine grained. They are often poorly sorted except where sand grades into shale. The Akata Formation is the major basal unit in the Niger Delta Complex. This is a marine pro-delta megafacies, comprising mainly of shales with occasional turbidite sandstones and siltstones. The dominant fresh water aquifer is found within the Benin Formation which consists mostly of continental sands with clay and silt.
3. Methodology
The physical quantities measured in a field determination of resistivity are the current (I), flowing between two electrodes A and B, the difference in potential, V between two measuring points, M and N and the distances between the various electrodes. To measure these parameters, in this research, five vertical electrical soundings (VES) were conducted at preferred points in the study area (Figure 1). The Schlumberger array method with a maximum separation of 1362 m between the current electrodes was employed. The Schlumberger array was chosen for several reasons. It is best used at many scattered sites within a large region where estimates of the thickness and resistivities of assumed horizontal layers are required and it has a moderate depth of investigation. The equipment used for the measurements of the earth’s resistivity is the ABEM Terrameter (SAS) 300c together with the SAS 2000 booster. During the field work, the Terrameter performs automatic recording of both voltage and current, stacks the results, computes the resistance in real time and digitally displays it. From the theory,

Table 1. Geologic units of niger delta.
the resistivity  of a homogenous earth is given by
 (1)
(1)
where I is the current, ∆V is the measured potential difference, and K is the geometric factor that depends on the electrode configuration [11] . The geometric factor K of the Schlumberger configuration used in this work is
 (2)
(2)
where “a” is the distance between the midpoint and electrode A or B and b is the distance between M and N.
The resistivity data obtained from the field Equation (1) is not the true resistivity of the subsurface but an apparent resistivity  calculated from the measured voltage, current and electrode spacing. This gives rise to the inverse problem—the problem of converting field measurements into geoelectric sections. The serious concerns in solving inverse problem are existence, uniqueness and stability. [12] for the first time in electrical method, studied the problem of existence and uniqueness of the inverse solution with the conclusion that if the earth’s resistivity varies continuously with depth and the potential distribution about a current electrode at the surface is completely known, then the inverse potential problem has a unique solution.
For a long time, the interpretation of VES data remained confined to curve matching procedure through theoretical curves prepared using different computational methods due to excessive computational requirement. However, due to improved computational facilities currently, some canonical form for inverse methods have been distilled and refined to solve resistivity inverse problem reasonably well. In this research work, the apparent resistivities are converted to true resistivity values using a numerical inversion that determines the best least-squares fit to the observed data with an objective function smoothing term that stabilizes the inversion by using a program of computer iteration IP12WIN [13] . The curves were interpreted with a minimum number of layers that are deemed necessary, and that are qualitatively recognizable on the field curves. Another way to reduce non-uniqueness is to use additional data/information from other sources to constrain geophysical inversion. We used borehole data to limit the resistivity values within the acceptable range for different lithological formations. It is possible that more layers than the recognizable ones are present, which we then declare as being electrically suppressed. We only add suppressed layers if borings or models from adjacent soundings suggest their existence and if they produce an acceptable fit. Also, the degree of uncertainty of the computed model parameters and the goodness of fit in the curve fitting algorithm are expressed in terms of residual error (RMS). The resistivity of the different layers and the corresponding thickness are reproduced by a number of iterations until the model parameters of all the VES curves are totally resolved with minimum residual error. At this stage, the final subsurface 1-D resistivity image that best explains the data is obtained.
4. Result and Discussion
Inversion Results are shown in Figure 2. The geoelectric section derived for all the VES points established is shown in Figure 3, the isoresistivity map at various depths is shown in Figure 4, while Figure 5 shows the borehole log used to correlate the geoelectric survey.
The inversion of the interpreted field resistivity data was aimed at investigating the aquifer conditions such as the depth and thickness beneath the subsurface. The geoelectric section suggests that the subsurface comprises of 5 - 6 layers. The uppermost layer depicts wet clayey sand with resistivity values ranging from 251 - 424.5 m and thickness values ranging from 0.44 - 3.64 m. In VES 3, it is however a sandy lateritic topsoil with resistivity
 (a)
(a) (b)
(b) (c)
(c)
Figure 2. (a) Response/Inversion Curve of Onicha-Ugbo VES 1; (b) Response/Inversion Curve of Onicha-Ugbo VES 2; (c) Response/Inversion Curve of Onicha-Ugbo VES 3; (d) Response/Inversion Curve of Onicha-Ugbo VES 4; (e) Response/Inversion Curve of Onicha-Ugbo VES 5.

Figure 3. Geoelectric section of onicha-ugbo vES.

Figure 4. Isoresistivity map of onicha-ugbo.
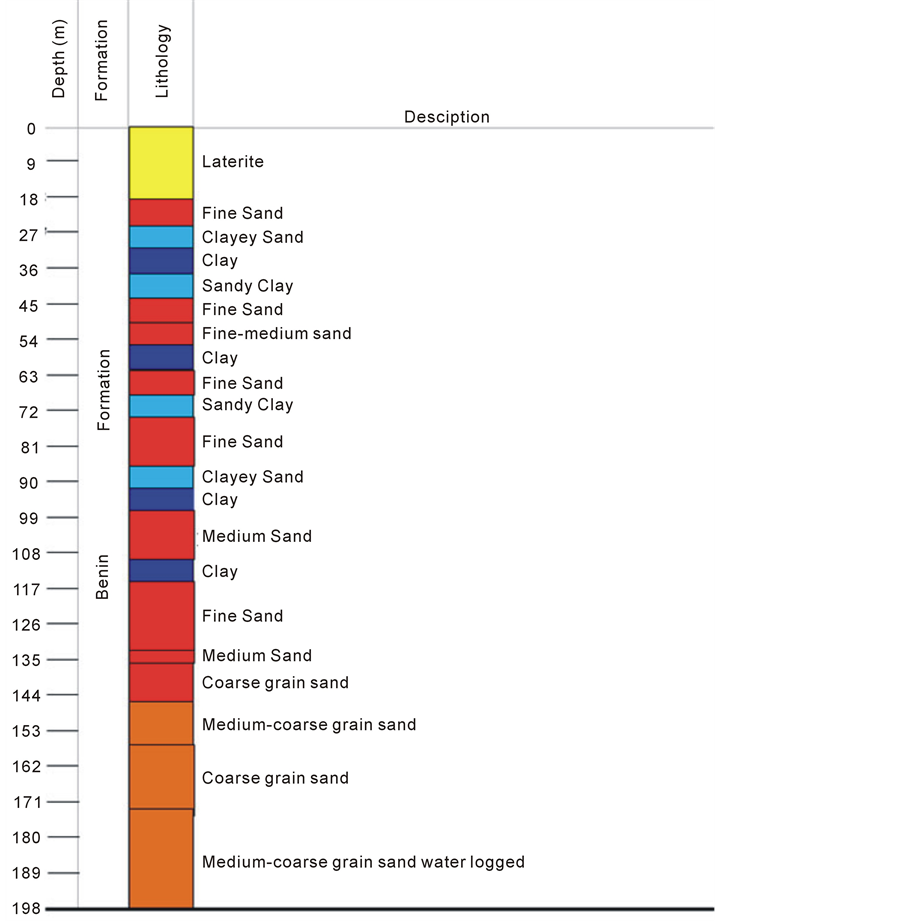
Figure 5. Bore hole log in the study area.
of 3145 m and 1.14 m thick. The second layer has two classes of lithologies. VES 1, 3 and 4 is a dry sandy unit with resistivity values ranging from 1222 - 4144 m and a thickness that ranges from 1.97 - 4.74 m, while the second class has resistivity in the range of 301.4 - 458.3 m and is considered a silty-clayey sand.
The third, fourth, fifth and sixth layers is interpreted as sand of differential wetness and clay content except for VES 1 and VES 4 that has clayey sand in layer 3 and 4 respectively. The depth to water-table in this area is above 150 m. The isoresistivity map reveals relatively continuous sandy unit underlying loamy sandy topsoil. The summary of resistivity sounding results is shown in Table2
5. Conclusion
The geophysical investigation results obtained agree with the possibility of having a successful borehole in the area. The geoelectric section and isoresistivity map developed from the interpretation of the VES investigations reveals loamy sandy top formations which are relatively dry. Underlying this top formation is a relatively continuous sandy unit. This correlates to some extent with the borehole log. The depth to the aquifer unit is above
Table 2 . Summary of resistivity result.
150 m. The aquifer seems to be effluent to the head waters of river Iyi Ugo that flows north. Thus adequate quantity of groundwater in Onicha-Ugbo can be tapped at depths exceeding 150 m. The depth may vary laterally due to the topography of the area.