An Integrated Location-Routing-Inventory Problem by Considering Supply Disruption ()
1. Introduction
The ability to develop a decision to support system appears to be essential and can be regarded as a strong tool for integrating the key components of the supply chain and for maintaining the organization in the competitive markets atmosphere. Hence, Models of location-routing-inventory are proposed. However, with regard to previous studies provided in the area of integrated supply chain problems, it is usually assumed that the facility is permanently available, while, in the real world, facilities are always at the risk of partial or complete disruptions [1] . The reasons of disruption in supply can be related either to the process or to the market [2] . Regarding the previous studies in which random disruptions in facilities location were considered, the present study has assumed that distribution centers encounter with failure are completely disrupted. While, in this study it has been assumed that when disruption occurs, distribution center doesn’t complete fail, but it might lose some part of its capacity and is still able to service. Also, if a distribution center encounters with failure and is unable to fulfill all customers’ demands, it will be caught in deficiency. In this study, a compound state of two types of deficiency has arisen including shortage of backorder, also lack of resulting from lost sale and lack is considered as a partial backordering on the problem. In such conditions, customers encounter with shortage become dubious, whether they to get their products with delayed or to desist shopping. The modified inventory policies, not only are closer to reality, but also significantly affect system costs [3] . The main contributions of this paper can be summarized as follows:
• This paper considers designing of the integrated supply chain network with regarding to random disruptions in facilities.
• The problem examines both types of partial and complete disruptions in distribution centers.
• Another contribution of this paper is including the application of continuous review inventory control policy by considering shortage of partial backordering.
This article considers designing of the integrated supply chain network with regarding to random disruptions in facilities and the locations of distribution centers are introduced. The paper is organized as follows: In Section 2, the literature review of the related to topics is presented. In Section 3, the model’s mathematic formulation and the explanation of the problem are described. Section 4 presents a solution approach, the numerical examples, case study and finally, in Section 5, conclusion and future research are discussed.
2. Literature Review
For the first time in 2003, Liu and Li discussed the modeling of location-routing-inventory [4] . Supply chain reviewed had two levels including customers and depots. The problem is considered to depots’ unlimited capacity. Liu and Lin (2005) presented in an innovative approach based on Tabu search and simulated annealing method that it was proposed by Liu and Li (2003) to solve the proposed model [5] . The solution way has been evaluated through simulation. Ambrosino and Scutella (2005) proposed four-levels single product supply chain. This model has been developed in both static and dynamic models.
Shen and Qi (2007) examined three level's single product supply chain [6] . In their model, the nonlinear inventory cost and an approximate routing cost are considered. Ma and Dai (2007) investigated stochastic location-routing-inventory problem in logistic distribution systems [7] . Zhang et al. (2008) have developed the problem in the state of multi-period and single product for three-levels’ supply chain. Javid and Azad (2010) presented a model that it is simultaneously examined decisions of location, allocation, capacity, inventory and routing [8] . For the first time, yang et al. (2010), examined distribution network of perishable items based on Just In time distribution (JITD) in three levels state [9] .
Review of literature is limited in the area due to complexity of inventory management problem under supply disruptions and partial backordering. Moeinzadeh (1989) considers a base-stock level inventory system with Poisson demand, constant resupply times, and partial backorders. Raisa and DeCroix (1998) studied an inventory system with uncertainty demand in which product demand is accidentally impaired in random periods. They have proposed a modified inventory model (S,s) with partial back ordering shortage [2] .
Li and Chen (2010) investigated a three-level supply chain in which the supplier was unreliable and was encountered with random disruptions [10] . Policy of inventory control to retailer is periodic review and when shortage occurs, it has used partial backordering. In this model, customers are divided into two classes according to possibility of their backorder. Azimi et al. (2012) have offered a model similar to Li and Chens’ model under continuous review inventory policy. Results have shown that the average of total cost of inventory system (r, Q) is lower than Li and Chens’ developed model [11] . Smith (2011) modeled multi-step system in which disruption can occur in each step and multiple strategies were assessed to protect service level to customer at the time of occurrence of disruption [12] .
3. Problem Description
In this study, three-level supply chain network design is studied including supplier, distribution centers and customers. In this model, facilities may be broken for reasons such as equipment failure, lack of parts or labor. It has been assumed that when distribution center is disturbed it loses only some capacity and is able to still serve. In this case, it may be unable to response to all customers’ demands of its allocation; but it won’t lose all unmet demand. The only those customers who have essential need for the product, leave the system and may provide their application from other source. In this state, the system suffers lost sale cost per unit of lost demand and the remaining customers should wait until the end of distribution period and they might receive the goods with delay. The distribution percentage is uncertain in each distribution center, which means, each center may face the different amounts of disruptions with different probabilities. To formulate the disruptions at the DCs, a scenario based modeling approach is used, in which each scenario specifies the percentage of disruptions for each DC. In Figure 1 a general structure of the model is demonstrated.
The assumptions of problem:
• Customers demand is independent of each other, demands are assumed to be stochastic, which follows a normal distribution.
• Each customer is served by exactly one vehicle.
• Capacity of the vehicles is the same and limited (Fleet type is homogeneous).
• Each route starts and ends at the same distribution center.
• A customer demand is supplied by only one distribution center.
• Distribution centers have a limited capacity.
• Inventory policy for each distribution center is (r, Q) Inventory System by considering Partial backordering when a stock out occurs. When the Inventory level reaches r, a constant quantity Q is ordered to supplier. Also, each distribution center stores safety stock to prevent the shortage during the order delivery time.
• There is no time dependent backorder cost. There is a fixed shortage cost,  , for each unit of demand occurring during the stock out period whether that unit is backordered or lost.
• There is never more than a single order outstanding.
• The stock out period during a cycle is small enough to be neglected so that the average number of cycles per year is D/Q, where D is the average annual demand.
3.1. Indexes, Parameters, Decision Variables
Indexes
 Set of customers
 Set of potential distribution centers
 Set of routes or vehicles
 Set of customers and distribution centers
 Set of scenarios Definition of parameters Parameters
 Mean of yearly demand at customer k
 Variance of yearly demand at customer k
 Number of customers contained in set k
 Yearly fixed cost for opening and operating distribution center j
 Fixed cost per order placed to the supplier by distribution center j
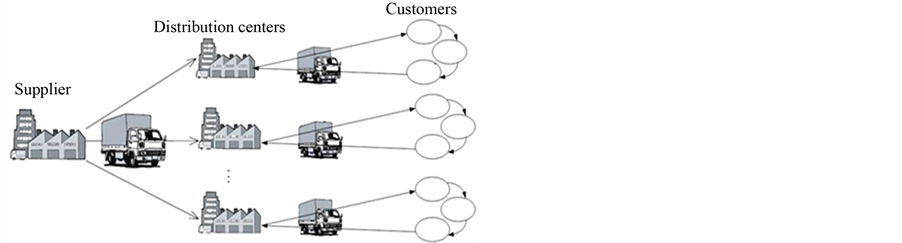
Figure 1. Geometric representation of model.
 Inventory holding cost per unit of product per year at distribution center j
 Fixed cost per shipment from the supplier to distribution center j
 Per-unit shipment cost from the supplier to distribution center j
 Per-unit cost to ship between the two nodes k and l
 Lead time of distribution center j in years
 Lost sales cost per unit product at customer k
 Fixed cost per unit time per unit product for customer k
 Maximum capacity available for distribution center j
 The annual capacity of each vehicle
 Number of visits of each vehicle in a year
 Probability that scenario s occurs
 Percentage of supply at distribution center j which is disrupted in scenario s
 Standard normal deviate
 Fraction of the demand during the stock out period will be backordered.
 Weight factor associated with inventory cost
 Weight factor associated with transportation cost Decision variables


 = Percentage of customer k demand which will be fulfilled under scenario s
 = order quantity for distribution center j
 = An auxiliary variable used for sub-tour elimination in the route of vehicle v
3.2. Mathematical Formulation
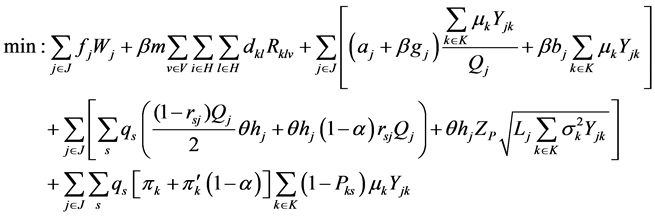 (1)
(1)
Subject to:
 (2)
(2)
 (3)
(3)
 (4)
(4)
 (5)
(5)
 (6)
(6)
 (7)
(7)
 (8)
(8)
 (9)
(9)
 (10)
(10)
 (11)
(11)
 (12)
(12)
3.3. The Description Objective Function and Constraints
Objective function (Equation (1)) is minimized to the total cost expected to include fixed costs and variable operating distribution centers, the annual cost routing distribution centers enable clients to cost shipped direct from supplier to distribution center j, the cost of inventories annually, including costs of ordering and holding inventory deficiency and Shortage costs.
Equation (2) ensures that each customer is placed only on the one vehicle route.
Equation (3) indicates that any vehicle route can depart a depot only once.
Equation (4) indicates the capacity constraints of each vehicle.
Equation (5) out of the vehicle after it ensures that each node.
Equation (6) ensures that assign a client to a distribution center if they both have the same direction.
Equation (7) is the sub-tour elimination constraint which, ensure that each tour starts from a distribution center and multiple customers.
Equation (8) shows the capacity constraint of each the distribution centers.
Equation (9) determines the Percentage of demand for each customer which will be fulfilled under scenario s.
Equation (10) is limitation of the sign.
Equation (11) represents zero oranissue of some variables.
Equation (12) indicates that the non-negativity of the variables.
4. Solution Approach and Computational Results
Since finding the optimal solution(s) for this problem is a non-polynomial (NP) problem, meta-heuristics method for searching optimal solution have been applied. In this study, first the proposed model is solved using Lingo 11 software; then, Genetic meta-heuristic algorithm is used to solve the problem for larger size. The proposed genetic algorithm chromo some to represent a solution is encoded in three separate integer array which is following:
• One related to order of service to customers.
• Another one is related to assignment of customers to vehicles which depends on the customer’s number.
• The other one is associated with vehicles number and each array number parallels to number of a distributer.
The genetic algorithm assumptions are listed in Table 1.
The results of the calculations are presented by both the exact solution and meta-heuristic method. In our study, we considered 15 instances, whose parameter values are listed in Table 2.
Results illustrate that objective function values obtained by Lingo 11 software of global solution parallels to objective values in proposed algorithm (Table 3). Hence, proposed algorithm is reliable.
From the global optimal results obtained by algorithm in Small size examples, we can use in medium and large examples. Because of optimal method would not be responsive for these problems.
Moreover the GA algorithm in compare to exact method would reach to a solution in a shorter time. For medium and large instances Lingo not to be able find the optimal solution after passing more five hours (Table 4).

Table 1. Genetic algorithm parameters.
Table 3. Comparison between Lingo and GA algorithm solution.
The Case Study
In order to evaluate the model a case study according to literature is place. Considering the article [13] , a drink company decide to redesign the distribution network of middle and northern areas of Jiangsu province. Three potential distribution centers are considered by a group of experts. The coordinates of the cities are taken from the map. Service level is 97.5% and lead time is 2 days. The information of customers and distribution centers are given in Table 5 and Table 6.
Since previous study is by considering time window, we eliminated the parameters of assigned to the time. The parameters of the model are applied uniformly to solve the model. Problem is calculated considering a disruption scenario with probability of failure 20% and Percentage of disruption is uniform distribution between 5
Table 4. Comparison between Lingo and GA algorithm solution.
Table 6. Distribution centers information.
and 25 for distribution centers. We assume percentage of back order shortage is 70 and the lack of fixed costs is uniformly drawn from between 20 and50 and lost sale cost is uniformly drawn from between 100 and 300.The parameters of the GA algorithm will be as follows: Population size is equal 50, iteration number is 1000, Crossover Rate is equal 0.7 and Mutation Rate is equal 0.3. Using meta-heuristic algorithm to optimize distribution net work and the presented results is shown in Table 7.
By comparing the results of the model and the results of the previous paper, we realize the number and mark of opened distribution centers and the allocation of customers to distribution centers, the allocation of customers to route and the order of their sequence is identical. Allocation of customers and routing are shown in Figure 2.
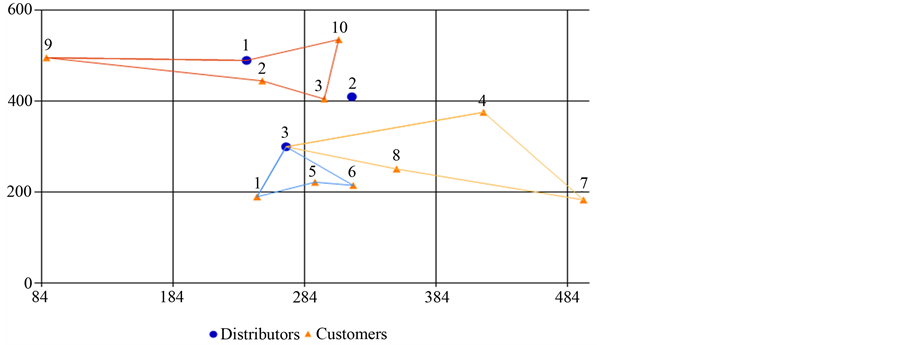
Figure 2. Distribution network design of case study.
5. Conclusions and Suggestions for Future
We investigated designing of the integrated supply chain network with regarding to random disruptions in facility. We hypothesized that when distribution center is disrupted, it may be lost only part of its capacity and it will also response to customers need. Moreover, by considering partial backordering of inventory policy, disruption’s distribution centers can provide remains of customers demand after the elapse of disruption period or inventory receiving of supplier. The problem has been formulated as a mixed-integer nonlinear programming, which minimizes the expected total cost of the network and the model is solved by using meta-heuristic methodology. Computational results and Sensitivity analysis are conducted to determine the effects of important parameters on the model and results have been evaluated.
For future research, we consider as follows: 1) Considering the duration and frequency for random disruption. 2) Developing the model for three level supply chains with considering the products distribution to customers through DCs or directly from plants to customers. 3) The extension is to consider customer differentiation with partial backordering in the inventory model.