The Effects of Forest Thinning Practices and Altered Nutrient Supply on Soil Trace Gas Fluxes in Colorado ()
1. Introduction
Our knowledge of the complex interactions between fire and climate is steadily increasing (Moritz et al., 2005; Westerling et al., 2006). As fire activity has increased in recent decades (Westerling et al. 2006), so too has public awareness. Concerns have developed in light of last century’s fire exclusion practices, how these now affect wildfire potential, and the uncertainty of how future climate change will affect fire regimes (Veblen et al., 2000). Forest managers in the Colorado Front Range and elsewhere in the American West have begun to use a variety of forest management practices to direct forests back to a natural range of variability that could be better buffered against future changes in climate (Kaufmann et al., 2005; Veblen & Donnegan, 2005). These practices include prescribed burning and/or thinning each with the goal of reducing fire risk and hazard (Fule et al., 2001). Currently, there is relatively little ecological knowledge to use in evaluating the ecosystem consequences of these practices in the Colorado Front Range.
In southwestern US ponderosa pine forests, these restoration practices have altered forest structure (Covington et al., 2001), microclimate (Hungate et al., 2007), substrate quality and availability (Grady & Hart 2006), and microbial communities (Boyle et al., 2005). Hungate et al. (2007) developed a general framework to depict how restoration treatments influence the properties and processes of the plant and microbial community in southwestern ponderosa pine forests. We apply that framework, and adapt it to explaining how we expect restoration treatments in the northern Colorado to change trace gas flux rates that are regulated by biological activity that in turn is controlled by the physical environment (Figure 1).
Among the important ecological consequences of forest management practices are trace gas fluxes, which are the product of multiple biogeochemical processes that are sensitive to environmental change (Mosier, 1998). Carbon dioxide (CO2), methane (CH4) and nitrous oxide (N2O) act as greenhouse gases in the atmosphere (Conrad, 1995; Conrad, 1996) and knowledge of how forest management practices affect their flux rates is largely unknown. In addition, data about trace gas exchanges can provide insights into ecosystem functioning, carbon balance, nutrient cycling and microbial activity (Figure 1). Both CO2 and N2O fluxes are primarily by substrate availability and biological activity. Biological activity is constrained by two parameters, water availability and temperature, which have changed significantly in response to forest thinning. Methanotrophs are responsible for CH4 oxidation in upland soils and the rate of CH4 uptake is constrained by the biotic activity and the diffusion of atmospheric CH4 into the soil (diffusivity). Both of them are sensitive to changes in soil moisture, which again have been found to be significantly altered following forest thinning.
In this study, our overall aim was to assess the effects of forest management practices on trace gas fluxes, with the general hypothesis that soil CO2 and N2O flux rates would increase with forest management practices that increased soil substrate (carbon or nitrogen) availability, or soil moisture, and soil CH4 fluxes would be primarily affected by forest management practices that altered soil microclimate. In a first study, referred to hereafter as
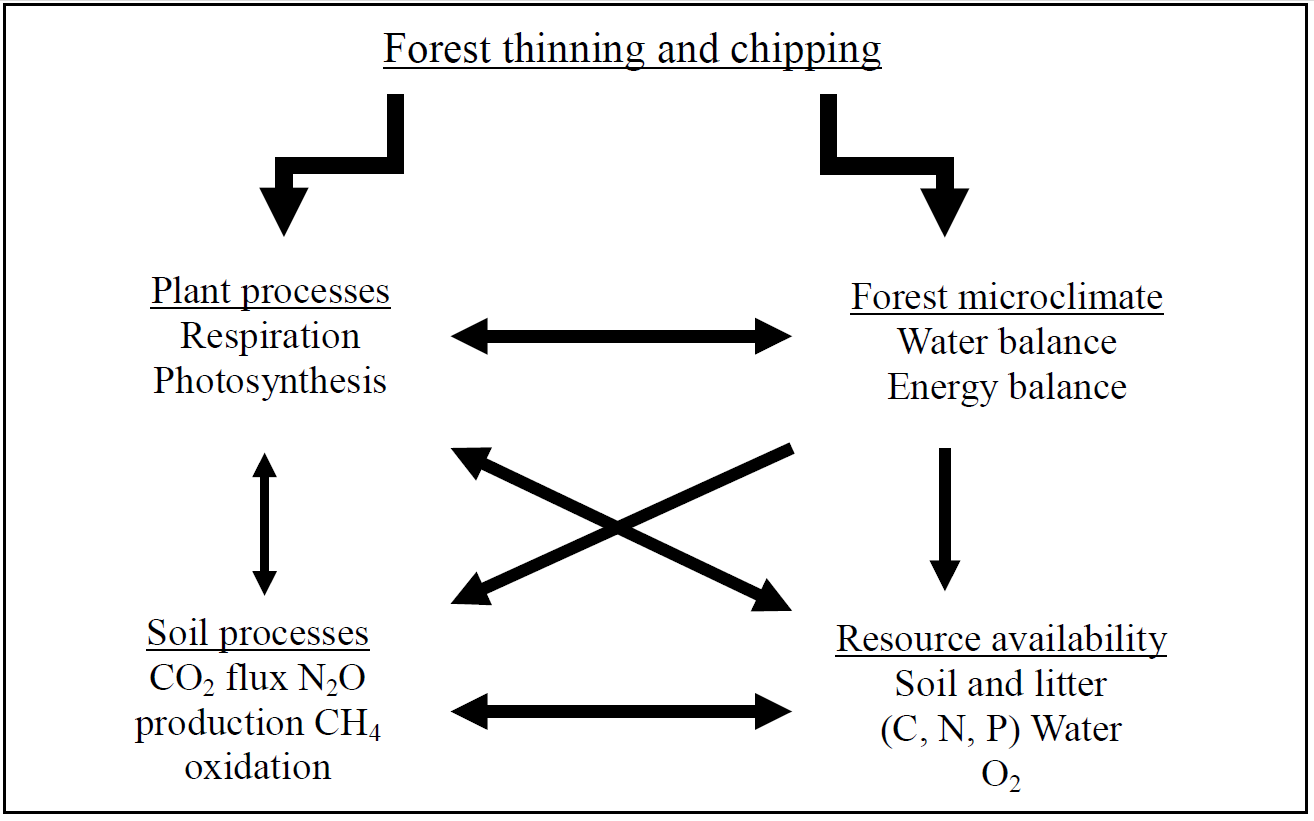
Figure 1. This diagram depicts the potential consequences of forest thinning practices at these sites (modified from (Hungate et al., 2007). Primary consequences are alterations to plant processes and the forest microclimate. Changes in these lead to secondary changes in soil resources and soil processes.
the “stand management” study, we had two objectives: 1) to measure changes in litter mass and soil carbon (C) and nitrogen (N) following forest thinning, and 2) to understand how thinning treatments affect the soil flux rates of methane, carbon dioxide, and nitrous oxide. In a second study, which we refer to as the “fertilization” study, we sought to determine nutrient (carbon, nitrogen, and phosphorus) controls of these gas fluxes from the forest soil.
2. Methods
2.1. Study Site
Heil Valley Ranch is located approximately 15 kilometers north of Boulder, Colorado, and is owned and managed by Boulder County Open Space and Mountain Parks. Forest thinning practices began on the property in 1999 with the objective of reducing canopy fire risk. The forest canopy is dominated by ponderosa pine (Pinus ponderosa), with a Douglas-fir (Pseudotsuga menzeii) component. Soils are generally shallow (<1 m), and described as coarse sandy loams common to the Typic Haplustalfs series in the region. According to the Soil Survey Staff (2007) of the Natural Resource Conservation Service (NRCS), the following series can be found at Heil Valley Ranch: Fern Cliff, Baller, Allens Park, Goldvale, & Nederland Series. All of our sampling locations were on a shallow slope (5% - 15%) and with the same aspect (southeast).
2.2. Stand Study
Boulder County Open Space and Mountain Parks initiated thinning treatments at Heil Valley Ranch in 1999 in response to increased wildfire activity in surrounding forests. All stems <15 cm dbh (diameter at breast height) were selectively cut. As these small stems were not merchantable, the managers elected to dispose of the biomass using two methods, broadcast-chip and thinning-only. In the broadcast-chip plots, all of the cut stems were mechanically chipped and broadcast onto the forest floor with a 7.5 cm target depth. In the thinning-only plots all stems <15 cm dbh were cut, subsequently removed from the plots, and mechanically chipped into large piles at specific locations on the property. We sampled the three broadcast-chip plots that were thinned in 2002. These broadcast-chip plots had an average size of 27 acres. Thinning-only plots were thinned in 2003 and had an average plot size of 27.5 acres. We randomly selected control plots from the untreated area of the property while still being within 1 - 2 km of the thinning-only and broadcast-chip plots.
To compare the effects of the treatments, we established a 20-m transect in each of the three treated plots (thinning-only and broadcast-chip) and at four untreated control sites. We measured trace gas flux and associated soil properties in the summer of 2006. During June we sampled two transects from each treatment (thinning-only, broadcast-chip) and un-thinned controls, and in August we sampled one transect in both thinning-only and broadcast-chip and two in our control, un-thinned forest. June and August sampling dates were separated by no more than 42 days.
At the time of sampling we placed five 20 cm diameter chambers every 5 m along transects. We used a landscaping tamper to drive PVC chamber bases into the soil until secure; we recorded heights at three points within each chamber base to calculate chamber volume. At time zero we placed the chamber lid on the base, sealed it with a rubber gasket and collected a 25 mL air sample from the chamber headspace. Similar samples were collected at 10, 20, and 30 minutes after chamber closure. Each air sample was collected with a 30 mL BD nylon syringe and then injected into pre-evacuated (200 millitorr) serum vials sealed by rubber septa. Vials were stored at 25˚C until gas chromatographic analysis.
Upon completing air sampling, we removed chamber covers and collected soil cores (to 5 cm) and all litter (including woodchips where present) within each chamber base (0.0314 m2). We dried all litter and soil at 55˚C for 24 hours, or to a constant weight. We calculated soil moisture for both the soil and litter as the % change between field moist and dry mass. Soils were then sieved through a 2 mm mesh and analyzed for total soil C and N using a Leco analyzer. We converted soil C and N data to a volume basis using bulk density estimates. Litter mass was corrected to a per area basis (m2).
2.3. Fertilization Study
We utilized an ongoing small plot fertilization study that measured the responses of under story plant community to the addition of woodchips, and the manipulation of nitrogen and phosphorus levels that included either increased, ambient or decreased levels. These plots were established in an area of the forest that had been thinned in the early winter of 2004, approximately 2 years prior to this study.
The woodchip addition was meant to serve as a carbon addition that would result in N immobilization; a 7.5 cm thick layer of woodchips was placed on half of the plots (n = 36). Woodchips were added to the 2.25 m2 plots at the beginning of the 2005 growing season. These chips were from an adjacent thinned stand that had been piled in 2003. The chips applied to these small plots were taken from the interior of the large (~5 m diameter) chip pile so as to access “fresh” chips that had experienced relatively little decay. At the time of this study, the chips had been on the treated plots for nearly two full growing seasons with nutrient amendments being added to the plots during that same time period. For the nitrogen treatments,  fertilizer (10 g∙N∙m−2∙yr−1) was applied to increase N availability, sucrose (500 g∙C∙m−2∙yr−1) to decrease N availability, and we refer to plots receiving no manipulation as ambient, or control N. Similarly to N, P availability was increased with phosphate fertilizer (2 g∙P∙m−2∙yr−1), decreased with gypsum (10 g∙Ca∙m−2∙yr−1), with untreated plots as ambient P controls. Nutrient amendments were made monthly through the 2005 and 2006 growing seasons. We collected air samples for trace gas analysis in September 2006, two weeks after the last amendments were made for that season. At each plot (n = 72), we placed a single chamber, collected and stored air samples as described above.
2.4. Gas Chromatography and Lab Analyses
Trace gas concentrations were measured using a Shimadzu GC 14B with electron capture detector (ECD for N2O) and flame ionization detector (FID for CH4 and CO2). Nitrogen gas (N2) was used as the carrier gas. Oven and column temperatures were set at 280˚C and 60˚C, respectively, for CH4 and CO2. We utilized a linear, 3- point calibration curve for each of the three gases of interest and standardized chamber gas samples with field standards (Hutchinson & Mosier, 1981; Hart, 2006) which underwent the same sampling procedures and served as a control against collection and storage bias. Flux rates (mg∙C or mg∙N∙m−2∙h−1) were derived from the change in concentration over the 30-minute sampling period (Robertson et al., 1999).
2.5. Statistical Methods
We used a one-way analysis of variance to determine the effect of treatments (broadcast chipping, thinning only & control) on three environmental variables; litter mass, soil C & soil N. If a significant (p ≤ 0.05) treatment effect resulted, we used the LSD post-hoc analyses to determine which treatments were different from one another. Other variables we measured, such as flux rates and soil moisture, are more sensitive to inter-annual changes in the environment (local weather). To address our second objective―the effect of treatments on trace gas fluxes― we analyze the effects of treatment and sampling date on CH4 uptake and CO2 and N2O flux. We used a two-way analysis of variance to examine the effect and relative importance of treatments and date on trace gas fluxes. To compare significant (p ≤ 0.05) treatment or date effects (or their interaction), we used LSD post-hoc analyses.
To test the effects of nutrient amendments on trace gas fluxes in the fertilization plots described above, we treated the results as a randomized complete block (4 blocks as reps) experimental design. This setup allowed me to evaluate direct and interacting nutrient controls on CH4 uptake and CO2 and N2O flux. We conducted all analyses with α = 0.05, using SPSS Version 15.0 (SPSS-Inc., 2006).
3. Results
3.1. Stand Treatments
Our first objective for the stand management study was to measure changes in the litter mass and soil C and N following forest thinning. We did not find broadcast chipping or thinning-only to have any significant effect on soil carbon (p = 0.973) or nitrogen (p = 0.856) relative to controls. We did, however, find that the treatments differed (p = 0.05) in forest floor litter (g∙m2). Post-hoc analyses show that sampled locations within the thinning-only treatment had significantly less litter (g∙m−2) than sampled locations within broadcast-chip (p = 0.026) and controls (p = 0.05), which were not significantly different (p = 0.599) from one another (Figure 2). Soil moisture, but not soil temperature, was significantly different between time periods. Averaging over treatments, which were not significantly different, soil moisture (mean % ± SE) for June and August was 3.1 ± 0.5 and 8.5 ± 0.5, which were respectively significantly different (p < 0.05). Similarly, litter moisture (%) was 6.6 ± 0.8 and 9.8 ± 0.9 during June and August sampling, respectively.
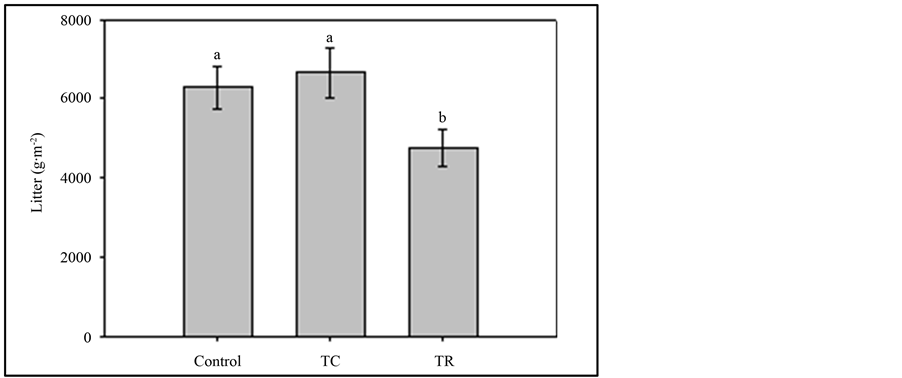
Figure 2. Bars represent mean litter mass measured in thin-chipped, thin-removed, and controls (error bars are the standard error of treatment means). Lower cased letters that differ indicate treatments that are significantly (p ≤ 0.05) different from one another based upon LSD post-hoc analyses.
Date of sampling had a strong impact on CO2 flux rates (p < 0.001) where they increased between June and August. In addition, the interaction between treatment and sampling date was significant (p = 0.02) for CO2 flux rates, suggesting that differences among treatments were dependent on the sampling date. CO2 fluxes were higher in August than in June for each of the three treatments. This most likely reflects the significantly higher moisture content of both the soil (p < 0.000) and litter (p = 0.01) during August. The greatest increase in CO2 flux rates between June and August sampling dates was observed for the broadcast-chip plots (Figure 3).
Methane uptake rates were most significantly affected by the month in which measurements were made. In the month of June, we found significantly less (p < 0.001) methane uptake (0.012 ± 0.003 mg∙C∙m−2∙hr−1) than in August (0.032 ± 0.003 mg∙C∙m−2∙hr−1). We did not observe any significant differences for methane uptake between treatments or for the interaction term.
We found no significant differences for N2O flux rates between treatment types or sampling date. However, the interaction of the two factors was significant (p = 0.027), suggesting that the magnitude and/or directionality of the treatment effects were dependent on the date of sampling. In control plots, there was no difference among sampling dates (Figure 4). In contrast, the broadcast-chipping led to an increase in N2O flux from June to August, whereas thinning-only had lower N2O fluxes between the two sampling dates.
3.2. Flux Rates of the Fertilization Study
In the full RCB analysis of variance, no main factor (wood chip, nitrogen, or phosphorus) had a significant influence on CO2 flux rates. The addition of wood chips did, however, interact significantly (p = 0.03) with the altered phosphorous availability (Figure 5). Increasing phosphorous availability on chipped plots caused a positive linear increase in CO2 flux. In contrast, un-chipped plots showed a slightly negative response to increasing levels of phosphorous. Post hoc analyses showed that plots with added woodchips had significantly (p = 0.002) greater CO2 flux rates (310.2 ± 50.0) than plots without woodchips (193.1 ± 19.4).
Methane flux rates at the small plots were significantly (p = 0.028) affected by an N*P interaction (Figure 6). At reduced levels of P, there was a positive relationship of increasing N on methane flux (decreased uptake). At control levels of P, the opposite pattern occurred, with a negative relationship of increasing N with methane flux (increased uptake). Last, with increased P levels, there was no effect of N on methane flux. N2O Flux rates ranged between 18.7 - 107.3 mg∙N∙m−2∙h−1 with no significant main or interaction effects of nutrient treatments.
4. Discussion
Ponderosa pine forests are distributed widely across the western United States. The stand structures vary greatly with respect to the climate and fire regime of a particular area. Therefore, restoration strategies vary by region
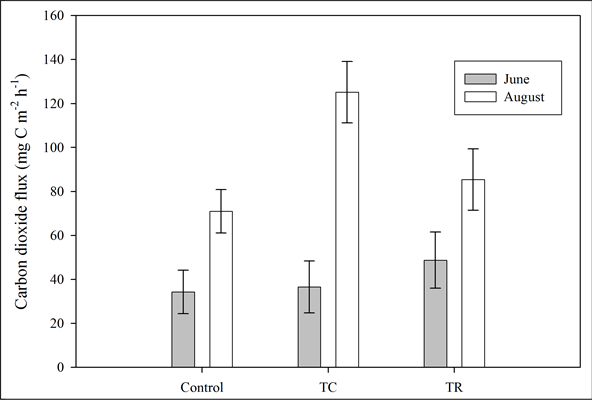
Figure 3. Carbon dioxide flux rates with respect to sampled treatments. Bars represent means measured in June (dark) and August (light).
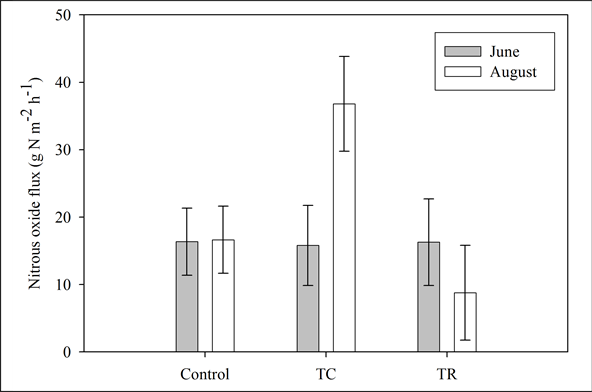
Figure 4. Nitrous oxide flux rates with respect to sampled treatments. Bars represent means measured in June (dark) and August (light) for each of the measured.
(Shinneman & Baker, 1997). A large quantity of the current understanding of ponderosa pine ecosystems has been developed in the southwestern US and particularly in Arizona. In a recent study, Hungate et al. (2007) proposed and experimentally tested the effects of forest restoration (thinning and burning) on nitrogen cycling in those ecosystems. Here we present a modified version of their “framework” as it applies to this forest with respect to the influence of management practices on trace gas exchanges (Figure 1).
Forest management and restoration practices, such as thinning and broadcast chipping, can have significant effects on forested ecosystems (Resh et al., 2006), though the changes are not always as expected and often the mechanisms have yet to be tested. Forest thinning can have immediate impacts on plant communities, soil organic matter, and forest microclimate (Figure 1). These impacts may be enhanced in the case of broadcast-chipping treatments where there is a large amount of substrate rapidly made available for decay. Reduction of the canopy cover directly reduced canopy photosynthesis and indirectly changes the water and energy balance of the ecosystem. For instance, we expect greater differences in maximum and minimum temperatures at the soil surface relative to untreated controls and alteration of the soil water balance (reduced transpiration, increased evaporation and through fall). The changes in the canopy structure and microclimate are expected to affect the quan-
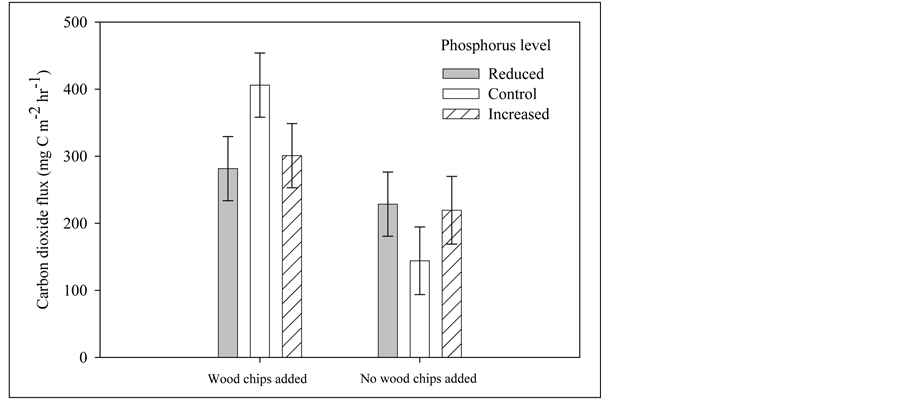
Figure 5. Interaction of wood chip additions, phosphorus, and soil carbon dioxide flux in a recently thinned ponderosa pine forest in the Front Range of Colorado. Bars are treatment means and error bars are standard error of the mean.
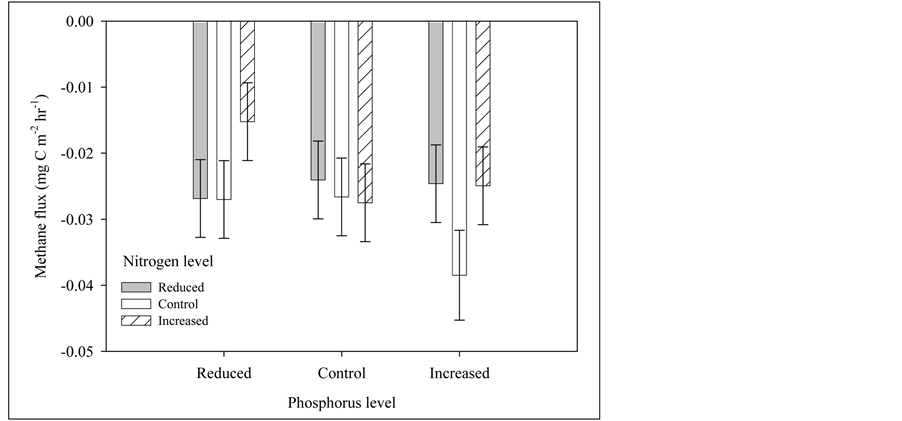
Figure 6. Interaction between phosphorus and nitrogen as they control methane flux (net uptake) in a ponderosa pine ecosystem. Error bars represent standard error of the mean.
tity and quality of soil resources available to plant and microbial communities, consequently affecting trace gas fluxes.
4.1. Forest Floor, Soil C & N―Stand Management Study
Our study found that thinning-only significantly reduced litter mass relative to broadcast-chipping and controls. The litter mass was not different between broadcast-chip (which included chips) and control treatments. However, the horizontal and vertical structures of the forest floors were different, as the chipped layer of the broadcast-chip areas had a more compact layer of woodchips on the forest floor. While even distribution was the goal, there was great variability in both the depth of woodchips and their patchiness. In contrast, control plots were more uniform in the distribution of litter. These patterns are likely associated with the distribution of trees. For the purposes of restoration with respect to litter, thinning-only treatments may be most effective in these forests.
Forest managers have long been interested in soil carbon and nitrogen as they influence forest productivity (Ballard, 2000; Birdsey & Lewis, 2002). With an increasing awareness of carbon storage (and credits) managers are interested in the effects of their management decisions on the ecosystem and economic budget. In their review of the effects of forest thinning (and broadcast chipping), Resh et al. (2006) found mixed results for positive, negative, or no change in soil C and N stocks. Our data show that 5 years after thinning any changes that may have occurred during that period were short-lived.
4.2. Flux Rates in Managed Forest―Stand Management Study
We conducted all of our fieldwork during June and August 2006. We found no difference in soil temperatures among sampling dates. However, soil moisture was significantly different between June and August sampling. This relationship has been found elsewhere in the American West (Boyle et al., 2005; McLain & Martens, 2006). In semi-arid vegetation of southeastern Arizona McLain and Martens (2006) described the ability of soil temperature and moisture to control CO2 and N2O fluxes and CH4 uptake.
We observed a similar correlation in our study since differences between June and August moisture levels reflected the differences in CO2 flux rates. The treatment effect was dependent on the sampling date (Figure 3). For the summer season (averaging across sampling date), we found no significant difference in CO2 flux rates between treatments. The most dramatic increase in CO2 flux was seen in broadcast-chip where the flux tripled between sampling dates, which correlated with increased moisture availability. Carbon substrate availability is the initial limitation to soil CO2 fluxes, but our data suggest water availability is of primary importance and supports the assertion of Smith et al. (2003) that CO2 flux from soils is a “function of water content as soils dry out”.
This forest is described as “dry” or “semi-arid” with ~500 mm of precipitation each year. We observed a difference between wet and dry conditions with respect to methane uptake. Our data showed greater uptake during months when soil moisture was greater. According Del Grosso et al. (2000) maximum CH4 uptake (0.05 mg∙C∙m−2∙h−1) in coarse soils occurs at 7.5% WFPS (water filled pore space). At our sites, soil moisture increased to a level that appeared to stimulate biological activity (Figure 4), whereas further increases of soil moisture should be expected to decrease the uptake rate. Castaldi et al. (2006) reviewed the literature research on CH4 flux rates in seasonally dry savannas. They examined the influence of land management as well as determining the effect of wet and dry seasons on the soil to atmosphere exchange of these trace gases. They found that CH4 fluxes were significantly different among managed (0.005 mg∙CH4∙m−2∙h−1, net source), burn only (−0.020 mg∙CH4∙m−2∙h−1) and control (−0.086 mg∙CH4∙m−2∙h−1). Within each land use type, they found a significant difference between wet and dry seasons.
Thinning treatments did not directly affect methane uptake. Other studies have examined the direct effects of forest management on the rates of CH4 exchange. Teepe et al. (2004) found that soils that had been compacted by heavy equipment and trucks had significantly lower methane uptake relative to adjacent undisturbed soils. As methanotrophic bacteria rely on the atmosphere for their substrate (methane) the rate of diffusion through the soil exerts a strong control on the rate at which methane oxidation may occur (Smith et al., 2003). Our sample collections were made three to four years after heavy equipment had been used to thin these areas. We was unable to visually identify areas that may have had compacted soils and may therefore be a potential source of variability in our data.
Nitrous oxide flux rates were greatest in the broadcast-chip treatment during August. The significantly higher moisture content of the soil and litter also had a positive effect on CO2 flux and CH4 uptake. While we can easily attribute a similar correlation between N2O fluxes and greater water availability, our observations only support that conclusion for a single treatment, broadcast-chip (Figure 4). Castaldi et al. (2006) did not find any significant effect of wet versus dry season on N2O flux rates in seasonally-dry ecosystems. In the cases they reviewed, intra-site and intra-season variability was greater than the variability among sites or seasons. Other studies have been inconclusive in trying to determine the effect(s) of management on N2O fluxes at the site level (Castaldi et al., 2006).
4.3. Flux Rates and Nutrient Amendments―Plot Level Study
Fertilizer additions to forests are a common practice throughout the world (Papen & Butterbach-Bahl, 1999; Palm et al., 2002) and the United States (Johnson, 1992; Johnson & Curtis, 2001). To our knowledge, there has not been any research on the response of soil trace gas fluxes to fertilization in northern ponderosa pine forests. We had predicted that wood, as a C substrate for heterotrophs, would increase CO2 fluxes, and that N and P would increase CO2 and N2O fluxes as we expected microbial community to respond with increases in activity. We expected methane uptake would be directly influenced by nitrogen and phosphorus additions and indirectly by wood chip additions and changes in soil moisture availability.
The significant interaction between woodchip addition and phosphorus showed support for the idea that substrate availability is of primary importance. This finding is different from our stand management study suggesting that newer chips may undergo a short period (0 - 4 years) of decomposition, but stabilizing when most labile compounds have been accessed. We found that wood addition, like water addition for Illeris et al. (2003), made the greatest difference, but appeared to then be enhanced in some manner by phosphorus manipulation. Interestingly, we found the greatest difference for wood and phosphorus manipulation to be between the wood additions versus no wood additions at control levels of phosphorus (Figure 4) indicating the greater importance of carbon substrate availability.
Other studies have found the same directional responses to nutrient additions for CO2 flux. Schaeffer and Evans (2005) found the greatest CO2 flux rates in plots with added C and N (360 mg∙C∙m−2∙h−1), or just added C in the Canyonlands National Park of Utah. These differences were greatest just three days after precipitation and nutrient pulses, both of which were undetectable after seven days. These soils show greater activity; without water additions, we observed significant differences between treatments in which fertilizers had last been added two weeks prior to our sampling. Maljanen et al. (2006a, 2006b) examined the affect of ash and nitrogen additions in coniferous forests of Finland. They did not observe any in situ differences in CO2 fluxes in soils where ash, nitrogen, or ash +N had been added. Like our study, they found that sampling times were significantly different from one another, suggesting that environmental controls, particularly soil temperature in their case, were more important than nutrient addition.
In our study, the smallest CH4 uptake rate was observed at high N and low P availability. These results confirm the observations of others where increased N availability can decrease CH4 oxidation (Mosier et al., 1996; Gulledge & Schimel, 1998; Bowden et al., 2000). Maljanen et al. (2006a) found that long term additions of wood ash increased CH4 uptake. They found no effect of N addition or ash*N interaction. These findings differ from our observations, where wood addition had no direct effect on CH4 uptake which was significantly affected by N*P (Figure 6).
Nitrous oxide fluxes were not significantly affected by any nutrient amendment. This result was somewhat surprising, as these plots had received monthly N additions for two full growing seasons, which we would have expected to increase both nitrification and denitrification rates (Davidson & Verchot, 2000). The same results have been observed in various locations. In Canyonlands National Park of Utah, Schaeffer and Evans (2005) found soil N2O flux measurements on day 7 (following N addition and moisture pulse) were not significantly different from one another from day zero. They concluded that the microbial community is most limited in these dry systems by water. Other studies have suggested that C and N may accumulate during dry periods (Davidson et al., 1993; Austin et al., 2004) which may then generate a flush of available soil resources once water becomes available (Hungate et al., 1997; Fierer & Schimel, 2002). The same pattern was observed in Finland where neither ash or N affected N2O production, whereas sampling date did (Maljanen et al., 2006a). Extensive studies have been conducted in Germany, particularly at Hoglwald Forest, to investigate the effects of N deposition (Butterbach-Bahl et al. 1997; Brumme et al., 1999), forest type and management (Butterbach-Bahl et al., 2002a), and distance to trees (Butterbach-Bahl et al., 2002b) on N-gas fluxes. In their continuous 4-year study of gaseous N fluxes, Butterbach-Bahl et al. (2002a) found that of the gaseous N fluxes, N2O fluxes exhibited the greatest inter-annual variability (>7-fold).
5. Conclusions
We found no direct effect of forest thinning on soil trace gas fluxes. In our study, soil moisture was highly correlated with sampling dates, and sampling date interacted significantly with treatments for CO2 and N2O suggesting that moisture levels exert a strong level of control over biological activity. This suggests that broadcastchipping and thinning-only treatments may significantly impact soil CO2 and N2O fluxes, but only at times when soil moisture is high. Similarly, CH4 uptake rates tripled among sampling dates (Figure 4), but were not influenced by management treatments. Since forest thinning practices impact trace gas fluxes only when soil microclimate is not limiting, substrate availability may not be the main limitation. In the fertilization study, we found that nutrient manipulation significantly affected CO2 flux and CH4 uptake.