Microbiological Identification of Atmospheric Particles in Hermosillo, Sonora, México ()

1. Introduction
In most cities, the increase of air quality deterioration has reached a level that affects the population’s health. One of the most serious pollutants are atmospheric particles, such as dust, pollen, carbon and metals like lead and cadmium, asbestos, salts, sulfuric acid droplets, dioxins, pesticides, etc. [1] , that remain suspended in the atmosphere.
These particles are capable of blocking the respiratory system air defense mechanisms at the upper airway level and alveoli which may carry biological elements such as pollen, bacteria, fungi and viruses that are conducted to the lungs. Particles larger than 10 microns are retained primarily in the upper respiratory tract; particles which are less than 10 microns remain in the breathable fraction and penetrate into the alveolar space of the lungs, Mexican Official Norm (NOM) [2] . High concentration of airborne particles can cause or worsen cardiovascular and lung diseases, heart attacks and arrhythmias, they also affect the central nervous and reproductive systems and may cause cancer [3] [4] .
The atmosphere lacks a native microbiota, which acts as a dispersion medium for many types of microorganisms (spores, bacteria, viruses and fungi), from others environments. Microorganisms dispersed into the air have a high biological and economic importance; they also produce illness in plants, animals and human beings since they can quickly be transported in bioaerosol forms causing alterations in foods and organic materials, and contribute to the deterioration and corrosion of monuments and metal buildings.
Several viral, bacterial and fungal infections of human beings and animals are airborne transmitted and often produce epidemic outbreaks. These can be classified into respiratory diseases (pneumonia, whooping cough, tuberculosis, legionellosis, cold, flu), systemic diseases (meningitis, measles, varicella, fungal infections) and allergies [5] . Acute respiratory infections are not produced by inert particles, but by a microorganism that is associated to them, therefore the importance of biological identification of PM10 and TSP.
In the city of Hermosillo, Mexico, the number of cases of Acute Respiratory Infections (ARI’s) between 2006 and 2010, were provided by the Sonora State Children’s Hospital. The number of ARI’s between 2006 and 2010 affected mainly children ranging ages from 1 to 4 years. The causal agents of these infections were, among others, Klebsiella pneumoniae sub pneumoniae and Pseudomonas.
Microbiological analysis of atmospheric particles including infectious, allergens and fungal agents among others, were determined by capturing them in solid, liquid or agar media for subsequent qualitative or quantitative analysis using biochemical, microscopic, immunochemical, microbiological and molecular techniques, that offer various degrees of sensitivity and specificity [6] . Many of the aerosols sampling devices use particle separation methods from airflow through capture in preselected medium. More common sampling methods used to separate and capture bioaerosols include impaction, filtration and impingement. Impaction method employs a surface of a broad spectrum solid medium (agar); the filtration uses a membrane filter and the impingement an isotonic liquid medium (water-based) [7] . These techniques are used for low volume samples and work for small periods (minutes).
The main goal of this investigation was to identify the microflora present in the air of Hermosillo, México, using high volume samplers, which suck air from the environment and retain particles in glass and quartz microfiber filters. Then the particles were analyzed using biochemical techniques for microorganism identification. As we know, there are no previous studies on bacterial analysis of air quality using this type of filters with samples of PM10 or TSP.
2. Methodology
Three sampling periods were analyzed during 2011; February 8 to 26, April 27 to May 15 and August 25 to September 12 at four different sampling stations. Samples were obtained every six days at each sampling station following the NOM protocol. For the PM10 a Wedding and Associated Brand high volume sampler was employed using quartz filters (Whatman), whereas for TSP sampling, a high volume sampler TSP model TE-5000 with fiber glass filter was used. The size of the filter was 20.3 x 25.4 cm. For PM10, the sample had a continuous flow of 1.02 to 1.24 m3/min, and 1.1 to 1.7 m3/min for TSP, for 24 consecutive hours. The samplers used are property of Municipal Institute of Ecology and employees through the program assessment of air quality.
2.1. Sample Locations
High volume samples were strategically located in four sampling stations in the city, being each one of these:
South station: COBACH High School; coordinates 29˚02'40.15''N and 110˚57'30.46''W. This site is surrounded by residential and commercial offices, high traffic areas and unpaved roads.
Central station: Direction of Inspection and Vigilance Building of the City of Hermosillo; coordinates 29˚04'44.01''N and 110˚56'31.91''W. Surrounded by residential and commercial offices and high traffic areas.
North station: Sonora State University (UES); 29˚07'17.70''N and 110˚57'40.12''W. Surrounded by residential and medium traffic areas.
Northwest station: CBTIS 206 High School; located at 29˚07'07.25''N and 111˚00'23.86''W. Surrounded by residential areas and unpaved roads. Figure 1 shows the four sampling sites.
2.2. Stabilization of Filters
The filters were stabilized and weighed before and after sampling under the same conditions of temperature and humidity. Filters were kept for 24 hours in a desiccator with humidity indicator. An analytical electronic balance was used, Sartorius Brand model A200S-D1B installed on anti-vibration table. The filters were handled using powder-free gloves.
2.3. Calculation of Particles Concentration PM10 and TSP in the Air
The concentration of particulate matter in air at standard conditions (P = 760mmHg and T = 298 K) is determined by the mass of collected particles and the volume of air suctioned by the equipment during the sampling time (24 hours) following the protocol established in the Code Federal Regulation from United State Environmental Protection Agency [8] .
2.3.1. Concentration of PM10
The equation used for calculating PM10 concentration (1):
 (1)
(1)
where P1= Initial weight; P2 = Final weight; V = Volume of air sampled.
Air sampled volume is calculated by equation (2):
 (2)
(2)
where: Qstd = Standard flow Air sampled volume Standard flow was determined by equation (3):
 (3)
(3)
where: Qa = Current volumetric flow We obtained the current volumetric flow by using the Look Up Table (manual) where we calculated ratio pressure (Po/Pa) using formula (4):
 (4)
(4)
where Pa = Standard pressure (760 mmHg).
Pf = Average pressure drop.
where: Pf was determined by equation (5):
 (5)
(5)
The average equipment pressure drop was determined using data readings taken before and at the end of sampling with water manometer.
2.3.2. Concentration of TSP
The equation used for calculating the concentration of TSP (6):
 (6)
(6)
where P1= Initial weight; P2 = Final weight; V = Volume.
The volume is calculated with equation (7):
 (7)
(7)
where: Qptn = Standard flow; t = Time.
For calculating Qptn equation (8) was used:
 (8)
(8)
where:
M = Slope of the sampler calibration curve.
I = Average flow indicated in the flow recorder (letter Dickson).
P3 = Average flow indicated in the flow recorder (letter Dickson).
T3 = Average temperature during the sampling period (in Kelvin degrees).
Pptn = Standard pressure (101 kPa or 760 mmHg).
Tptn = Standard temperature (in Kelvin degrees, 298).
B = Intersection point of the sampler calibration curve line.
2.4. Sampling for Bacteriological Analysis
Samples for analysis were obtained from the filters PM10 and TSP in which small portions were taken with an area of 28.27 mm2. The number of samples per filter was calculated taking into consideration that the filter has a sampling area of 41,617.50 mm2 and a volume of 1627.20 m3 of air sampled in 24 hours. The unit sample area considered was 28.27 mm2 because it is the standard measure. Canon and Roe’s formula was used, considering that expected prevalence of bacteria on the filter was 50% and sensitivity of the techniques employed 95%. According to these operations, the number of sampling units was four.
2.5. Bacteriological Analysis
Samples taken from the filters were placed in tubes containing nutritive broth BHI (Brain Heart Infusion) and incubated at 37˚C for 24 hours. The following enriched culture mediums were used for sample incubation: Blood and chocolate agar. Colonies were selected according to morphological differentiation and Gram staining was used to differentiate cell morphology. To gram positive cocci, a catalase test was applied to differentiate Micrococaceae and Streptococaceae family. The gram positive cocci catalase negative was cultured in selective medium KF. Gram negative bacilli were cultured in MacConkey agar and the harvested microorganisms were tested with oxidase. The identification of the isolated microorganisms was done by a biochemical test recommended in Bergey’s Manual [9] for each particular case.
Colony forming units (CFU) were counted from the total microorganisms in the filters. The concentration was calculated for a sample area of 41,617.50 mm2 and a volume of air sampled of 1627.20 m3 in 24 hours and in accordance with the procedures established on NOM [10] .
2.6. Statistical Analysis
A SigmaPlot 11 software was used to determine statistical analysis using one way ANOVA.
3. Results
3.1. Respiratory Infections in Hermosillo’s Population
Acute respiratory infections are not produced by inert particles, but by a microorganism that is associated to them. In the city of Hermosillo, ARI’s affects mainly people in ages between 1 and 4 years
(as shown in Figure 2). The most common infections are: Klebsiella pneumoniae sub pneumoniae and Pseudomonas. However, there is no evidence that these bacteria are airborne.
3.2. Concentration of PM10 and TSP
Comparing the PM10 concentrations values found in each of the sampling dates with the value of the maximum permitted concentration established by the Mexican Official Norm [11] which is 120 µg/m3, only the South Station exceeded the permitted concentration during the second sampling period, with a value of 139.71 µg/m3. TSP concentration values obtained in all sampling dates were below the Mexican Official Norms. In Figure 3, particles concentration and maximum permissible by NOM is observed.
3.3. Identified Microorganisms
The results of the microbiological analysis, using traditional techniques, revealed the presence of microorganisms associated with respiratory diseases, such as Klebsiella pneumoniae sub pneumoniae and Citrobacter sp10 mainly. Besides Enterococcus faecalis, other bacteria present in samples were the Pseudomonas genus and the Enterobacteriaceae family.
In the south and northwest sampling locations, E. faecalis was found in 50% of the samples, 100% in the center location and 33% in the north one. In the center and north locations, Klebsiellapneumoniae sub pneumoniae was found on February 8. Citrobacter sp.10 was found once in the south and northwest locations, each in different dates. Butiauxella agrestis and Proteus penneri were found only in the south location. On May 15, Salmonella paratyphi A and Enterobacter sacazakii were found in the northwest location. Table 1 shows the microorganisms found and Figure 4 shows the results of CFU at each station and period analyzed.
3.4. Antibiotic Sensitivity Analysis
Since E. faecalis was the microorganism with higher number of appearances, an antibiotic sensitivity analysis was performed with the support of a local laboratory. (LaboratoriosAcuña, Hermosillo, Mexico). Results can be observed in Table 2.

Figure 2. Number of ARI’s in the city of Hermosillo, México, during the period 2006-2010, Source: Children’s Hospital of the State of Sonora (HIES).

Figure 3. PM10 concentration in different sampling sites a) First sample, b) Second sample, c) Third sample and TSP d) First sample, e) Second sample, f) Third sample.There is not a statistically significant between sampling dates North (P = 0.421), South (P = 0.201), Northwest (P = 0.344) and Center (P = 0.154).
4. Discussion
Air pollution has been widely studied in different countries to identify potential risks of respiratory diseases in human beings. However, the main focus of these studies is about air chemical contamination regarding the presence of carbon monoxide (CO), sulfur dioxide (SO2), nitrogen oxides (NOx and NOy), reduced nitrogen (ammonia, NH3; ammonium, NH4), ozone (O3) [12] -[17] , heavy metals [18] [19] and particulate matter PM10 [12] [20] [21] .
Some authors have been analyzing the possible transmission of pathogens through air, but these studies have been targeted to areas where high content of potential pathogens are present, such as water treatment plants and garbage dumps [22] . Few investigations have been done to look for biological contaminants in the air; the most common is the search for particles that cause allergic diseases such as pollen [23] [24] .
 (a)
(a)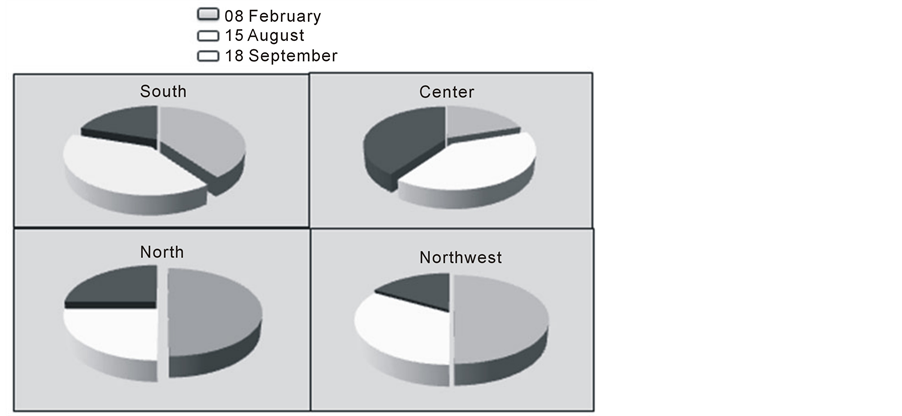 (b)
(b)
Figure 4. CFU of mesophylls bacteria obtained at each sampling location at three different periods (a). Sampled area distribution (b). There is not a statistically significant between sampling dates (P = 0.274).

Table 1. Microorganisms identified using traditional biochemical tests.
Table 2. Antibiotic sensitivity test of 6 isolated of E. faecalis.
S = Sensitive; MR = Moterately Resistant; R = Resistant.
The concentration of PM10 was analyzed in four different locations in the city of Hermosillo, México. Concentration levels above the Mexican Standard Norms where only observed during May, in the south location. The results indicate that Hermosillo, at least in 2011, did not present mayor problems of pollution for PM10 in the sampled areas.
This investigation also covered the analysis of filters containing particles PM10 and TSP to determine the load and variety of bacteria. The results demonstrated a high bacterial concentration in the city’s air. The greatest concentration was observed in February and the lowest in September.
When bacterial concentration was analyzed separately, the lowest number of bacteria was observed during February for the south location and in August for the north location. The highest degree of bacterial air pollution was found in the central area of the city.
Cases of acute respiratory infections (ARI’s) in the city occur mainly in younger age groups, as shown in Figure 2. The pathogens identified as generators of these ARI’s were, Klebsiella pneumoniae sub pneumoniae and Pseudomonas, among others. It was possible to isolate the bacteria found in the air samples; therefore the conclusion is that air is one of the main routes of transmission of pathogens of ARI’s.
In the analysis of isolated bacteria, genres that cause health problems were identified. The most vulnerable population groups are children and the elderly. Some of these bacteria such as Klebsiella pneumoniae sub pneumoniae and Pseudomonas sp. are opportunistic pathogens of nosocomial infections (intra hospital), while Salmonella paratyphi A, E. faecalis and generally Enterobacteriaceae cause intestinal infections when contaminated foods are consumed. Contamination means of these foods can be direct (hands and contaminated water) or, as demonstrated in this work, air.
Isolated colonies of E. faecalis were resistant to almost all antibiotics and in most cases; patients receiving treatment for this bacteria will generally not be effective. According to the presented results, vancomycin is the only antibiotic recommended to treat affected patients by this type of bacteria. Due to the toxicity level of this antibiotic, it is recommended to use it as a last option treatment.
This is the first report of systematic measurements looking for bacterial air contamination. The results shown in this paper suggests that respiratory tract pathogenic bacteria can be transported through the air. Specific pathogens research such as Mycobacterium tuberculosis, Streptococcus pneumoniae, Haemophyllus influenzae and coccidioides sp. is still necessary.