LVDC: An Efficient Energy Solution for On-Grid Photovoltaic Applications ()
1. Introduction
Nowadays, world uses a high amount of energy. Moreover, electricity is becoming an essential part of the society, perhaps because electricity may be seen as a green energy. Concerning the energy production, a new requirement concerns a low rate of emissions of green-house gases and particularly the carbon dioxide (CO2) into the atmosphere to limit the global warming.
So, in recent years an important increase of renewable energy sources like the solar photovoltaic energy has been seen. The use of these energies locally produced in offices and houses will continue to increase in future and no one can predict its amplitude.
The solar PV systems connected with public power systems (On-Grid Solar Energy Systems) are the most current way to use renewable energy. This solution avoids the use of accumulators for the energy storage. A PV cell directly converts some solar energy in to some direct-current (DC) electricity but additional converters are required to connect them to the grid. The efficiency of the global PV system depends on PV cells’ efficiency, converters’ efficiencies and global conversion chains’ architecture [1] .
Classically, in housing and office applications, the use of the electric energy is achieved from the alternative current plugs even if PV panel systems are locally connected to the power grid. This process can considerably increase system losses especially when DC electricity is used at the load levels.
In practice, electronic appliances, such as computers, gaming consoles, printers, economic or LED lights, televisions and so on need DC supplies. Additional AC to DC converters are needed in such equipments [2] -[5] .
The main object of this paper is to show the importance of the saved energy values when LVDCs are used. As it is described in following section of the paper, the issues are important. A LVDC bus in a PV system is regulated by acting on converter control.
In the first section of the paper the state-of-the-art DC current supplies are described and the need of power factor correction, PFC, systems to improve absorbed current waveforms from the grid are recalled.
In the second section, we have proposed practical PV conversion chains which provide a direct use of the DC current for DC loads applications. The PV system is connected to the power grid and no accumulator battery is used. The different converters modeling are performed using non ideal averaged modeling techniques based on the switching cell configuration [6] [7] . This technique was considered to be efficient especially for semiconductor losses estimation as it is proved by refined simulations and experiments [7] . The averaged modeling of the different converters constitutes an important way to efficiently model a complex PV system. The refined simulation of the global conversion chain, in a circuit simulator, is not easy and tedious because many semiconductor devices operating with high switching frequency are used.
The last section treats the quantitative evaluation of the efficiency of the different proposed PV chains compared to the classical one. A practical profile of consumed power evolution in an office with a PV panel (600 W peak) generating power magnitude during one day is considered. An important saved energy when a DC voltage bus is used directly for DC loads applications has been registered. The practical application was studied for two different geographic places, with two different solar profiles, Lyon in France (a standard solar radiation location) and Sfax in Tunisia (a high solar radiation location). Annual saved energy can exceed 25% of the annual PV generated energy. It is noticeable that the importance of the performed studies is even more interesting when the main consumed power is achieved during daytime.
2. Direct Current Supplies
2.1. Power Factor Correction Systems
Most of loads daily used in offices and at home require direct current power supplies to operate. Despite this, these loads use the standard alternative current grid as a first energetic input. Therefore, this operation needs alternative to direct current conversion (Switch Mode Power Supplies SMPS as shown in Figure 1) which is not without consequences on the supply network as well as the system sizing and the global losses [8] -[10] .
One problem with switch mode power supplies (SMPS) is that they do not use any form of power factor correction. Moreover, the input capacitor CIN only loads when V1 is greater than the voltage across the capacitance VCIN. If CIN is designed from the input voltage frequency, the current is looked much closer to the input waveform (load dependent). However, any little interruption on the mainline will cause the entire system to react negatively. In saying that, in the designing of a SMPS, the hold-up time for CIN is designed to be greater than the period of VIN, so that if there is a glitch in VIN and a few cycles are missed, CIN will have stored energy enough to continue to power its load.
The power factor, PF, of any component consuming an instantaneous power p(t) in a cyclic operation of period T may be defined as
 (1)
(1)
where P, is the real power (W) given by,
 (2)
(2)
and S, is the apparent power (VA) is given by,
 (3)
(3)
where i(t) is the instantaneous current flowing through the component and v(i) its instantaneous across voltage.
The power Factor PF is expressed as decimal number between zero and one.
The typical switched mode power supply should have a power factor of about 0.6, therefore having considerable odd-order harmonic distortion. That reduces the real power available to operate the device. To operate a device with these inefficiencies, the power company must supply additional power to make up for the loss.
This is why a Power Factor Correction (PFC) on the device side has become an important part of the final power system design for so many products.
There is a lot of standards (For example, EN 61000-3-2 in Europe) to drive power consumption near a power factor of 1 and keep the total harmonic distortion to a minimum. Depending on the output power and the designer’s needs, a SMPS can be designed with either a discontinuous or continuous mode standalone PFC controller, or a continuous PFC/PWM mode device (Figure 2).
Many types of PFC are used in practice, the best known one is the boost converter. The boost converter topology is used to accomplish this active power-factor correction in many discontinuous/continuous modes (Figure 3). The boost converter is used because it is easy to implement and it operates well.
The input of the converter is a full-rectified AC line voltage. No bulk filtering is applied following the bridge rectifier. So the input voltage of the boost converter varies (at twice the line frequency) from zero to the peak value of the AC input.
2.2. Classical Photovoltaic Systems Connected to the Grid
The photovoltaic electricity has initially been developed for standalone applications without connection to a power grid. For example, it was the case of satellites or isolated housings. Nowadays, it is found in various power applications such as personal calculators, watches and other objects of daily use. Indeed, the electricity produced by photovoltaic cells can supply various individual continuous loads without difficulty. More recently, with the emergence of photovoltaic systems connected to the grid, the PV has significantly expanded as a way to generate electricity.
Connecting PV systems to the grid (Figure 4) has many advantages compared to standalone installations, for example:
• The produced current is conforming to the current network (230 V, 50 Hz, in Europe) and can be used directly by consumers (appliances, light bulbs, etc.).
• Solar power users do not need a separated network;
• In case of overproduction (or inversely, over consumption) balancing energy is performed automatically through the network connection;
• A “virtual storage” of energy is provided by the electric network and batteries are superfluous;
Figure 4 shows one of classical configurations used to connect PV panels to the standard low voltage grid without the need of transformer. The DC/DC converter, Converter #1, allows extracting the maximum power from the PV panels when climatic conditions like the solar radiation changes. The Maximum Power Point Tracking (MPPT) algorithm is often used by acting on the DC/DC converter control.
The DC/AC converter, Converter #2, can transfer the PV generated power to the grid and insures the regulation of the input DC voltage value (400 V) of the inverter. This value allows obtaining easily the standard 230 V
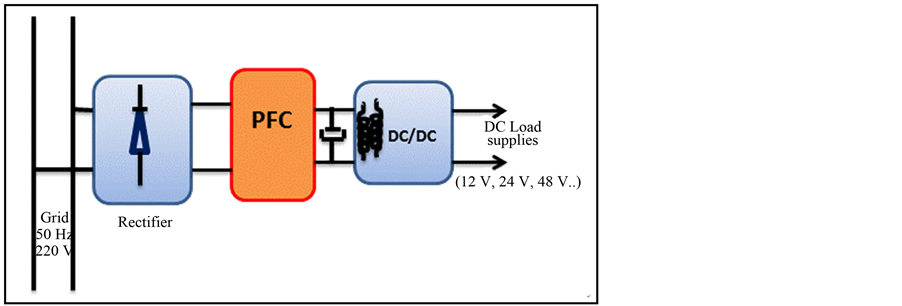
Figure 2. An SMPS with a power factor correction bloc.
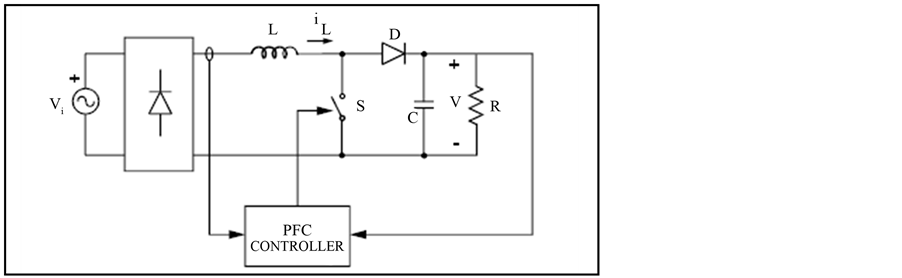
Figure 3. PFC circuit based on the boost converter.
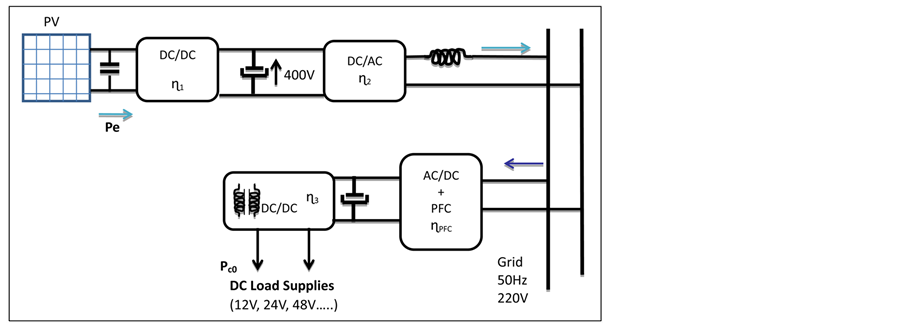
Figure 4. Classical configuration of the PV panel and DC load connected to the grid.
AC. The injected current to the grid have a quasi-sinusoidal waveform and is in phase with the imposed grid voltage. The power factor is near 1.
As previously described, a power factor correction stage below the rectifier is frequently used in power DC supplies. The output stage, the DC/DC converter, converter #3, often with a galvanic isolation (using HF transformer) is used to adjust the PFC output voltage to the direct current loads.
Table 1 resumes the used converters, in the different studied PV chains, and their specifications.
The classical configuration in Figure 4, shows that a portion of photovoltaic generated power should pass through four converters to honor the load demand. So, the system efficiency is low in the case of DC loads and a significant part of the PV power (Pe) is lost.

Table 1. Used converters and their specifications.
3. On-grid Photovoltaic System Configurations and the Direct Current Use
3.1. Proposed On-Grid PV Chains
In this section, some photovoltaic architectures with a direct current chain form PV to load. The object of this study is to show that using direct current from a DC bus (for DC loads), without need of any alternative current grid, is very economic and increase the global system efficiency.
The first proposed architecture is shown in Figure 5. The idea is to use directly the regulated DC bus (400 V). The DC/DC  converter adapts LVDC loads to this bus.
The second architecture is shown in Figure 6. In this structure, a second regulated bus (<120 V) is created which is in agreement with actual standards. Indeed, 120 V is considered to be the secure limit for people in a dry environment [11] . For wet environment this limit is 60 V. The safe low voltage DC bus requires the use of an additional reversible DC/DC converter . When generated PV power at the LVDC bus is greater to the consumed power, the additional converter operates as a boost. Otherwise it operates as a buck converter.
It is obvious that the second solution decrease global system efficiency but has the advantage to generate a safe low voltage bus allowing more security for people.
Figure 7 shows the third proposed PV architecture. It consist to create a Safe Low Voltage DC bus (<120 V) as the LVDC bus. The additional DC/DC converter  is a buck converter.
As well as the second solution, the proposed architecture sweet well with standards in office and domestic applications because its ability to be easily connected to the grid.
3.2. Analysis of the Power Balance in the Proposed PV Architectures
The object of this section is to compare the proposed PV architecture to the classical one which is widely used today.  and
and  are the DC/AC converter efficiencies when it operates in PWM inverter mode and PWM rectifier modes respectively.
 and
and  are the DC/DC converter efficiencies when it operates in buck mode and boost mode respectively.
 is the maximum output power of the PV panels. The efficiency of the MPPT algorithm is included in the DC/DC efficiency value
 .
.
Pc0 is the DC load consumed power. Pi is the injected power to the grid after honoring the loads. This power is positive if the PV generated power is greater than consumed one (obviously, different converter efficiencies are taken into account). Otherwise Pi is negative.
Table 2 resumes the expressions of the injected power Pi. These expressions are function of the input power Pe, the consumed power Pc0 and the different converter efficiencies. The classical system is used as a reference structure.
To compare the proposed PV architectures to the classical one and to evaluate the magnitude of the lost in the different converters it is necessary to develop accurate models of these converters. The proposed models should take into account the static and dynamic losses in the different power semiconductor devices.
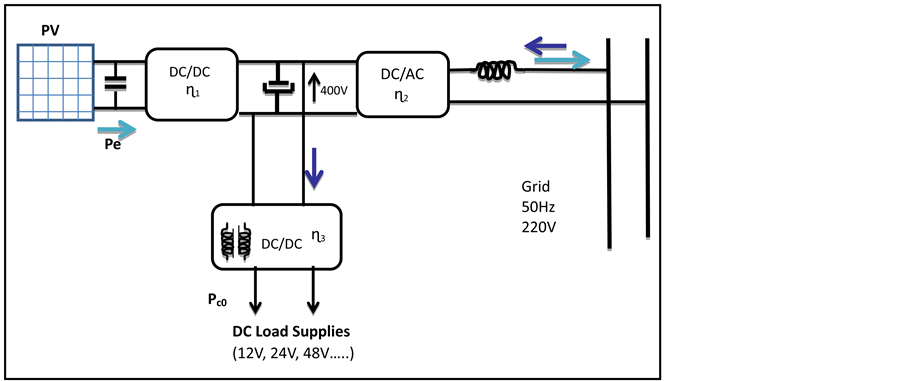
Figure 5. First proposed PV system architecture for DC supplies (System #1).
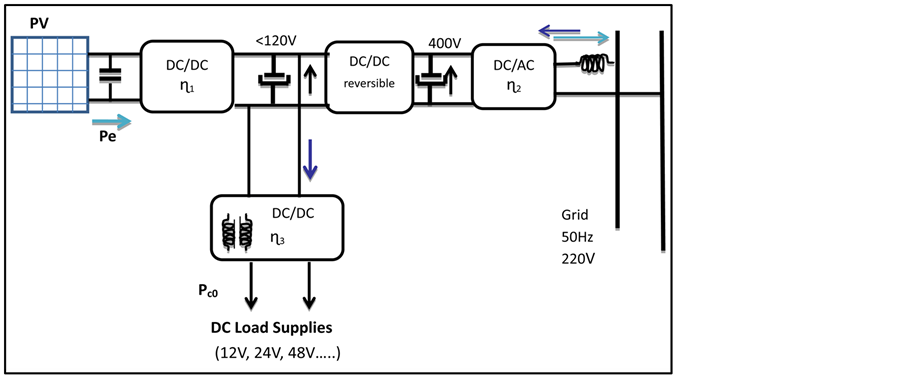
Figure 6. Second proposed PV system architecture for DC supplies (System #2).

Figure 7. Third proposed PV system architecture for DC supplies (System # 3).
Table 2. Expressions of the injected power Pi to the grid.
4. LVDC Advantage in On-Grid PV Generation Systems
4.1. Application Description
To show the efficiency of the proposed PV systems compared to the reference structure, a 600 W PV panel is chosen. In our case this panel is destined to office applications where the PV power is generated locally. It can be used to supply administrations, laboratories and domestic applications too.
The next study was achieved for two cities, the first one is Lyon in France (Europe) and the second is Sfax in Tunisia (North Africa).
In Lyon the average annual sunshine duration is 2006 h and the average annual radiant energy is about 1400 kWh/m2/year.
In Sfax the average annual sunshine duration is 3000 h and the average annual radiant energy is about 2400 kWh/m2/year [12] .
Assuming a PV panel efficiency equals to 0.15, the annual electrical energy registered in Lyon is about 210 kWh/m2/year and the electrical energy obtained in Sfax is 360 kWh/m2/year.
Figure 8 shows the considered power profile of the office load consumption and the PV locally generated power during a good weather day. Indeed, around 13 o’clock, the maximum PV power is generated and a considerable decrease on office consumption was registered because of office staff breaks.
The injected power into the grid (Pi) is calculated and the daily evolution of this power is registered.
Figure 9 shows the evolution of Pi obtained by the different PV systems (the classical and the proposed chains conversion). At this stage of the study, constant converter efficiencies are considered (Table 1). These efficiencies values are considered as an example of typical values for the chosen converters operating at nominal power.
In order to evaluate the efficiency of each studied, chain conversion, architecture, the difference ΔP is integrated during one day. ΔP is the difference between the injected power obtained by each proposed PV system and the injected power obtained by the classical system.
So,
 (4)
(4)
where k = 1, 2, 3 corresponds to the index of the proposed chain systems. The energy balance between the PV system (k) and the reference PV system, is defined as,
 (5)
(5)
When  is positive, the use of PV system (k) is better than the classical system. In the later case,
  is the saved energy. Contrarily, if this energy is negative, the reference PV system is the more efficient architecture solution.
With the converter efficiency values considered in Table 1 and the injected power Pi expressions (Table 2), the different PV converter energy balances W(k) are given in Table 3. These values are obtained in the case of a given weather and fixed converters efficiencies value.
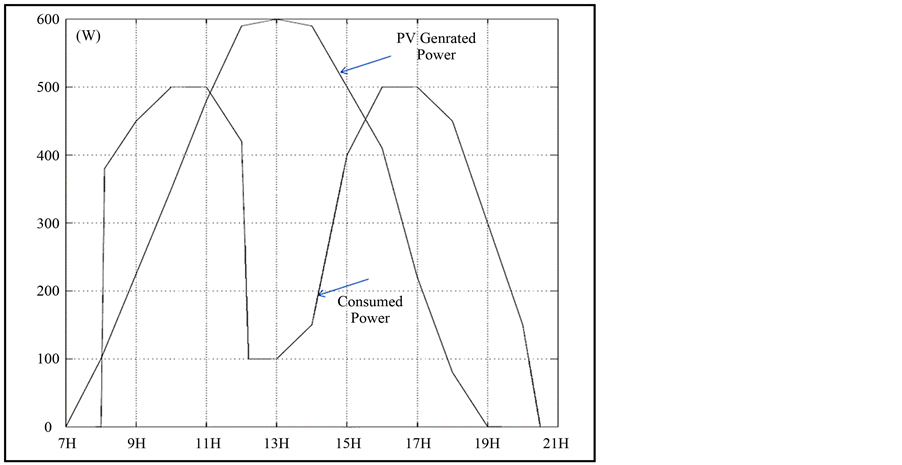
Figure 8. PV generated power and load consumed power during a good weather day.

Figure 9. The injected power (Pi) evolutions for the different PV system configurations.
All the energy values given in Table 3, are positive, so the proposed converter chains architectures are always better than the reference PV system configuration. For a given PV system architecture, the energy value depends mainly on radiant energy and converters efficiencies.
For further accuracies of the efficiency analyses, we have proposed to take into account the non-ideal behavior of the different converters in the proposed PV converter chains.
Table 3. Energy balance 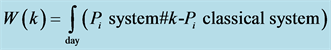 of the proposed PV systems.
4.2. Proposed Converters Model
To estimate the energy efficiency of the different studied circuit. The classical approach consists in using a circuit simulator and a model of the complete circuit included the power switches, the filtering elements and also a layout parasitic representation that dramatically act on the converter losses. However such an approach demands lot of efforts and a high simulation cost. Fortunately there exist other simplified approaches based on averaged models that enable to reduce the simulation cost. The proposed analyses are based on the representation of the converters in the different photovoltaic chains by non-ideal averaged models. The model takes into accounts the semiconductor non linearity. Static and switching characteristics of the different devices are considered [6] [7] . The DC bus inductance Ls, the diode inverse recovery phenomenon and the dead time of the governed signals are taken into account too. L is the storage inductance in the converter (Figure 10).
The proposed averaged model corresponding to the PWM-cell of Figure 10 is shown in Figure 11. The controlled voltage sources (V1) and current source (I1) are given by.  and
and .
.
Where  and
and  are the time averaged values of the instantaneous terminal waveforms Uas(t) and Ie2(t) respectively over the switching period Ts.
The accuracy of the proposed averaged models was largely proved by comparisons to refined simulations and experimental tests [6] [7] .
The non-ideal averaged model estimates the dissipated power in the different semiconductor devices. This is the first important criterion to use this type of models in an application. The second criterion is the improvement in simulation cost (a ratio of about 104) in favor of the non-ideal averaged model with respect to refined models.
The averaged models of the different proposed PV systems are implemented in Matlab simulator. They can be implemented in any circuit oriented simulation tools too.
4.3. Energy Balance Study
The efficiency of each converter depends on different considerations like the semiconductor types and the input power magnitude.
Considering the following semiconductor devices used in the different proposed converters:
Stth2002 diode and stw52nk25z MOSFET are for the very low DC voltage bus. Stta2006 diode and the irfps43n 50 k MOSFET are for the low DC voltage bus. In this application, the active devices are driven by a 40 kHz switching frequency value. The DC/DC converter  is assumed to have the same architecture in the different PV chains.
  is the efficiency of a diode rectifier converter followed by a boost converter.
Figure 12 shows the evolution of the different converter efficiencies as a function of transferred power. When the delivered power is very low with regards to converter nominal power, the converter efficiency considerably decreases.
In the same power conditions as defined in the last section, the integral of ΔP(k) quantity during a good weather day (Figure 13) is registered.
Taking into account the converter nonlinearities it is noticed that saved energy W(k) values are different from estimated values when converters efficiency are considered as constants.
The best saved magnitude value is registered by system number 1. This is predictable, because of the use of a minimal number of converters and semiconductors. The disadvantage of this architecture is the value of the DC bus voltage (400 V) which not satisfy security standard for people. This doesn’t exclude the use of this kind of DC bus in future but with additional security devices.
In the case of a very bad weather day (Figure 14), the energy balance W(k) value can be negative and classic-
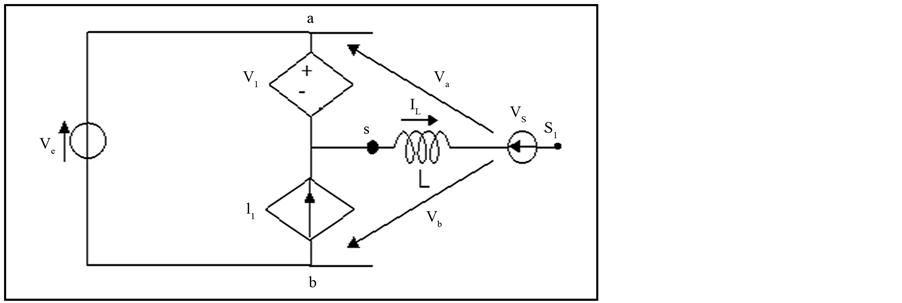
Figure 11. Proposed averaged model of the PWM-cell.

Figure 12. Converter efficiencies as function of power magnitude.
al configuration gives the best global PV system efficiency as shown in Figure 15.
It is clear that the efficiency of the proposed PV converter chains depends mainly on weather conditions. In the following section, the global energy balance of the different architectures during one year in the two considered cities, Lyon and Sfax is considered.
Four different average weather states, in the year, have been considered as shown in Figure 16. The annual produced PV panel energy is about 1.4 MWh in Lyon. The four averaged energy values are 5500 Wh/day, 4500 Wh/day, 3000 Wh/day and 1100 Wh/day.
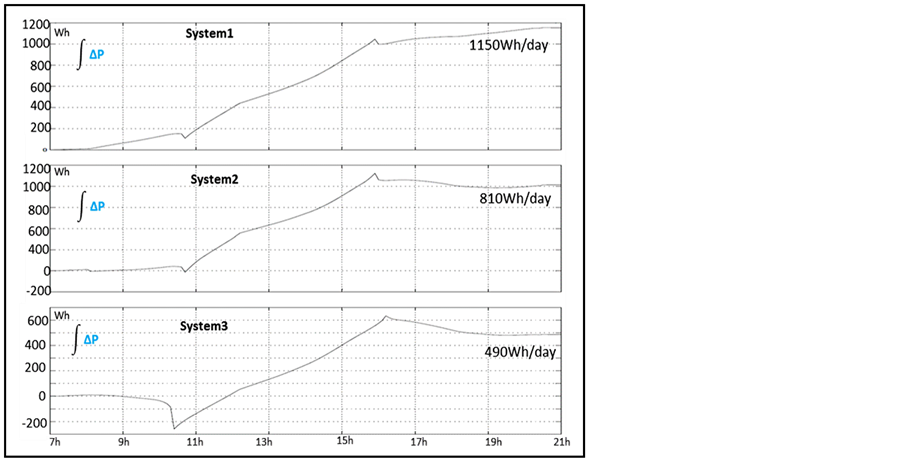
Figure 13. W(k) energies evolution during a good weather day.
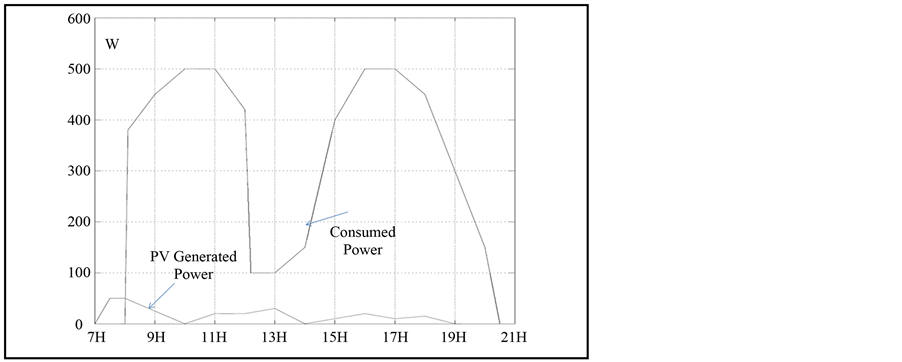
Figure 14. PV generated power and Load consumed power during a very bad weather day.
The daily averaged energy balance of the different proposed converter chains W(k) is illustrated in Figure 16 too. The annual saved energies are equals to 404 kWh, 278 kWh and 176 kWh when using the three defined systems respectively. The saved energy obtained by the proposed system number 1 for example, corresponds to 28.8% of the total PV annual produced energy. This rate is very important and should be considered for future PV converter chain topologies.
In the case of Sfax city the four assumed averaged PV produced energy (7500 Wh/day, 6500 Wh/day, 5500 Wh/day and 4000 Wh/day) are shown in Figure 17. The annual produced PV panel energy is about 2.3 MWh.
The annual saved energies are equals to 616 kWh, 548 kWh and 421 kWh when using the system #1, system #2 and system #3 respectively instead of classical PV chain configuration. For example, the saved energy obtained by using the proposed system #1 is equal to 26.7% of the total PV panel produced energy in a year.
Table 4 resumes the obtained results for the different proposed PV system in Lyon and Sfax Cities.
It is clear that in all the cases that system number 1 gives the best saved energy value compared to other PV system architectures. The advantage of system number 2 and 3 is a very low voltage DC bus is used which is in agreement with actual standards and security limits for people. In the future, many standards should be changed in industrial and domestic applications for a suitable energy management of energy use.
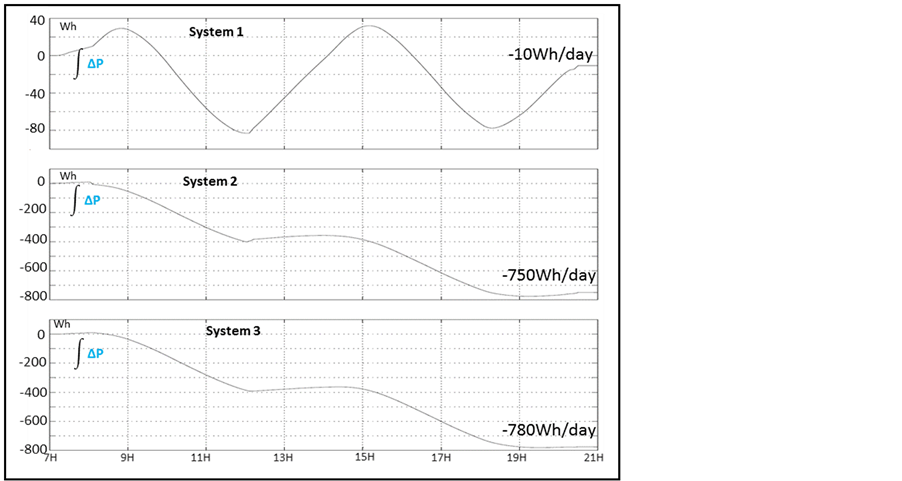
Figure 15. W(k) energy evolutions during a very bad weather day.

Figure 16. Assumed PV energy and the resulting energy balance W(k) evolutions during a year (Lyon city).
These studies clearly show the importance of the use of a DC bus voltage for DC load supply without using PFC converters and AC plugs. The significant magnitude of the saved energy in these cases should not be ignored. This must incite us to change traditional DC loads input and review the supplying loads modes, especially when PV panel systems are locally used for on-grid applications.
We notice that experimental validation of the obtained results, in this paper, is possible. In our case we had the object to shows the efficiency of the LVDC use by using an accurate model of the different converters. These models are validated experimentally in previous works.

Figure 17. Assumed PV energy and the resulting energy balance W(k) evolutions during a year (Sfax city).
Table 4. Saved energy by the proposed PV chains in the two studied cities.
5. Conclusions
In this paper we have focused on the utilities of the DC bus use, as an input supply for numerous DC loads, in the on-grid PV conversion chains. Classically, in home and office applications, DC loads need alternative to direct current conversion which is not without consequences on the supply network as well as the system sizing and losses. Additional circuits like PFC are often used to improve absorbed current quality. In PV applications, a DC bus is often available and the direct use of this bus to supply DC loads increases considerably the efficiency of the global PV system. To evaluate the efficiency of the different proposed PV chains, non-ideal averaged models of the different converters, have been used. These models are accurate and suitable to complex system studies.
It is registered as an important efficiency of the proposed PV chains, compared to the classical one where supplying DC loads needs standard AC plugs.
Evaluating the annual saved energy of a typical application in two cities, Sfax in Tunisia and Lyon in France, shows that this energy exceeds 25% of the PV generated energy.
The advantage of the proposed studies is more significant when the main consumed energy is in daytime. In this case DC input loads should be used. This is the case of most of the office applications. Probably, the electric system supplies and demands in future will be different from that of today.
Looking for environmental context and economic considerations, close cooperation among many different participants should be deployed to introduce a new standard and to provide suitable power inputs for DC loads.