Processing-Microstructure Relationships in the Plasma Electrolytic Oxidation (PEO) Coating of a Magnesium Alloy ()
1. Introduction
Magnesium’s combination of high strength-to-weight ratio and lightness is especially useful in automotive and aerospace components where it can reduce vehicle weight, thereby improving fuel economy and, hence, environmental friendliness [1] . The protective properties of passive films on Mg are lower than those on Al and Ti, so they are less able to protect this very active metal against corrosion. Hence, magnesium alloys usually need an appropriate surface treatment [2] . Plasma Electrolyte Oxidation (PEO) is considered to be one of the most cost-effective and environmentally friendly ways to improve the corrosion and wear resistance of magnesium and magnesium alloys [3] . The PEO method can be used to form a thick, hard and adherent ceramic coating on the surface of Mg alloys, as well as other light weight metals Al and Ti, and their alloys [4] -[7] . Many processing parameters can affect the PEO process, including electrolyte composition [8] , substrate material [9] , and electrical parameters, mainly current mode and current density [10] . Different current modes have been utilized in the PEO treatment including, DC, AC, unipolar and bipolar current modes 5 which play important roles in the consequent voltage breakdown, local melting and oxidation of the substrate, quenching and re-crystallization processes. Hence, the formation mechanisms for the coatings are complex due to the involvement of electro-, thermal-, and plasma-chemical reactions in the electrolyte [7] [11] [12] .
Hussein et al. [13] have shown that in PEO process, the ceramic coating grows inwards to the alloy substrate (inner layer) and outwards to the coating surface (outer layer) simultaneously. Also they conclude that the rates of growth of the PEO oxide outer and inner layers are process parameter dependent and result from a combination of three processes namely, 1) discharge processes causing the substrate to melt and oxidize when flowing out through the discharge channels and rapidly cooled at the surface-electrolyte interface, 2) partial destruction of the outer layer due to strong discharges and 3) diffusion processes.
It has been recognized that when using either DC or pulsed unipolar modes of PEO processing for Mg [14] , the resulting oxide coating is porous, contains other defects, and is only partially adherent. Varying the current mode produces changes in the PEO discharge events both in terms of discharge intensity (how strong they are) and discharge density (number of discharges). The differences in the nature of the discharges have a profound effect on the coating microstructure, thickness, roughness, porosity, hardness, and the corrosion resistance of the coated magnesium alloy. PEO coatings formed using a bipolar current mode have been reported to have a more compact structure with fewer defects, and a more uniform coating thickness compared to coatings formed using a unipolar mode [12] [15] [16] .
As noted by Dunleavy et al. [17] , methodologies to obtain quantitative data on the PEO discharge events and the associated plasmas, which are integral to the growth mechanism and strongly affect both the microstructure and properties of the coating, fall into three categories-optical, spectral and electrical. Optical measurements can provide information on the duration, size (spatial extent) and spatial distribution of the discharges. Optical measurements on Mg have shown discharge event durations of 50 to 1100 µs [12] . Electrical measurements can provide information on discharge currents, which are typically in the range of 1 to 100 mA [17] . Current density values can also be obtained if the discharge diameters are estimated using optical measurements [17] . Spectral analysis can provide information on the temperatures, densities and chemical compositions of plasmas [18] .
The spectral diagnostic technique is an effective way to study the physical phenomenon in the PEO process by investigating the emission spectra of plasma. Optical emission spectroscopy (OES) has previously been applied to the PEO process for the detection and analyses of light that is emitted from the plasma species for Al [18] [19] , Mg [12] [20] [21] and Ti [22] alloys. OES has also been used in the study of coating mechanisms in the PEO process [13] [20] -[22] .
The effects of hybrid current mode on the tribological and corrosion properties of the PEO coatings have previously been studied [15] [16] . In this paper, the plasma-microstructure relationships in the PEO processing of magnesium alloy AM60B are studied by optical emission spectroscopy (OES). The acquisition system for the plasma spectrum is described, and the effect of hybrid current modes (combination of bipolar and unipolar) on the plasma is analyzed through a comparison of the plasma spectra and plasma electron temperatures for two different hybrid current modes, unipolar followed by bipolar and bipolar followed by unipolar. The single modes, unipolar and bipolar were, used for comparison purposes. The temporal characterizations of the lines for Hβ, Hα, Na I and Mg I are used in the analysis. These OES observations are then related to the microstructure of the resultant PEO coatings.
2. Experimental Arrangement and Diagnostic Methods
2.1. Material and PEO Process
Due to good ductility and toughness with reasonable yield and tensile properties, AM60B magnesium alloy (MgAl 6.4 Mn 0.4 Zn 0.2) disc coupons (Φ25 × 5 mm) were used as the test samples in this study. The coupons were manually ground and polished on 240, 400, 600, and 1200 grit silicon carbide (SiC) waterproof abrasive papers. The coating was obtained in an alkaline electrolyte containing 7 g/l K4P2O7, and 3 g/l Na2Al2O4 and potassium hydroxide (1 g/l KOH). A cooling system maintained the electrolyte at a temperature below 25˚C during the process. The processing parameters are listed in Table 1.
A PEO coating system as described in Hussein et al. [19] was used to produce the oxide coating on the samples. Two different current generators operating under a constant current control function were used, which deliver current to the substrate with an amplitude in the range of 0 - 5 A and 0 - 15 A and the voltage was increased gradually with time, as the coating thickness increased.
To examine the effects of current mode on the resultant properties of the coatings, the PEO coating process was carried out using different current modes. Four different sets were prepared, with each set consisting of four coated samples. Set U was coated using a unipolar current mode for 30 minutes. Set B used a bipolar current mode for 30 minutes. Set H1 used a combined unipolar (H11 for only 15 min) followed by bipolar (H12 for another 15 min) current mode for a total of 30 minutes. Set H2 switched the sequence for the unipolar and bipolar modes compared with Sample H1 (H21 treated firstly using bipolar current mode; H22 completed the treatment using unipolar mode for second 15 minutes) as shown in Figures 1(a) and (b).
The process parameters, including frequency (f), the duration of each pulse ( and
and ) and the resting gap (break) between the positive and negative pulses (
 and
and  respectively) and the charge ratio parameter [16] , CR, are listed in Table 1.
Scanning electron microscopy (FEI Quanta 200 FEG with solid state backscattered detector operated at 10 KV) in both the secondary electron (SE) and back-scattered electron (BSE) modes was used to observe both the coating surface morphology and, through observation of sample cross sections, coating thickness and integrity. The samples were first sputtered with a gold film to make them conductive for SEM analysis.
2.2. Optical Emission Spectroscopy
Passive spectroscopy diagnostics, in which light emitted from the plasma itself is recorded, are well established

Table 1. PEO process parameters for coating AM60B Mg alloy.

Figure 1. Schematic representation of the experimental setup for PEO coatings using (a) Single current mode and (b) Two current modes (hybrid).
in plasma physics since they are non-destructive, and consequently do not affect the plasma. Radiating atoms, molecules and ions can provide an insight into plasma processes and plasma parameters, with the possibility of performing real time observations. In the passive method, one of the basic underlying processes is the excitation of particles (atoms, molecules, ions) by electron impact from level q to level k and the decay to level i by spontaneous emission with the transition probability Aki resulting in line emission εki.
The importance of the population models is to determine the quantity of emitted photons and its dependency on the plasma parameters. In thermal equilibrium in a plasma, the population density of excited states is described by a Boltzmann distribution. However this equilibrium is essentially never achieved in laboratory plasmas. Therefore a less complete form of thermal equilibrium, known as Local Thermal Equilibrium (LTE), is considered [23] .
Figure 2 is a schematic diagram showing the PEO plasma source and the optical detection and data acquisition systems for the emission spectroscopy measurements. The observed spectral range was from 200 to 775 nm. A specially designed PC2000-UV-VIS Fiber Optic Spectrometer (Ocean Optics Company) was used. A 1200 line holographic UV for bandwidth 200 - 500 nm and 1200 line holographic VIS for bandwidth 450 - 770 nm gratings with the spectral resolution of 1.0 nm at mid to high sensitivity, were used to acquire the total spectrum from 200 nm to 770 nm. The spectral signals were then acquired by Sony ILX511B silicon CCD detector which consists of a 2048-element linear CCD-array (a charge-coupled device array detector). As only relative intensities have to be measured, the intensity is in arbitrary units. The intensity of spectrum is the cumulative result of an acquiring cycle. Since the discharges occur randomly (the source does not always emit equally over the whole sample area), an integrated signal was used which was collected from the total sample surface facing the fiber optic. Before the experiments, a cross-check of the manufacture spectrometer wavelength calibration was done using two different laser beams (He-Cd with λ = 442 nm and He-Ne with λ = 632.816 nm). An intensity sensitivity calibration was also performed using SL2 calibrated Lamp (StellarNet Inc.): excellent matching was found.
The emission intensities of the plasma species were monitored as a function of both time and current mode using the OES system. Six different spectral lines were recorded simultaneously, which eliminates discrepancies that may otherwise happen if the spectra are recorded at different times or with different samples.
2.3. Diagnostic Method
Plasma emission intensities were measured and analyzed by using optical emission spectroscopy to determine the plasma compositions and to calculate the electron temperature. The plasma electron temperature Te, can be determined from the relative intensities of spectral lines of the same atomic species [23] . This method is valid if the level populations of the lines in question are populated according to the Boltzmann law: in other words, at least local thermodynamic equilibrium (LTE) must exist for these levels.
Figure 3(a) shows the atomic level for hydrogen Balmer series whereas Figure 2(b) shows the atomic level configuration for magnesium which is a two electron system. The levels are separated into two multiplet sys-
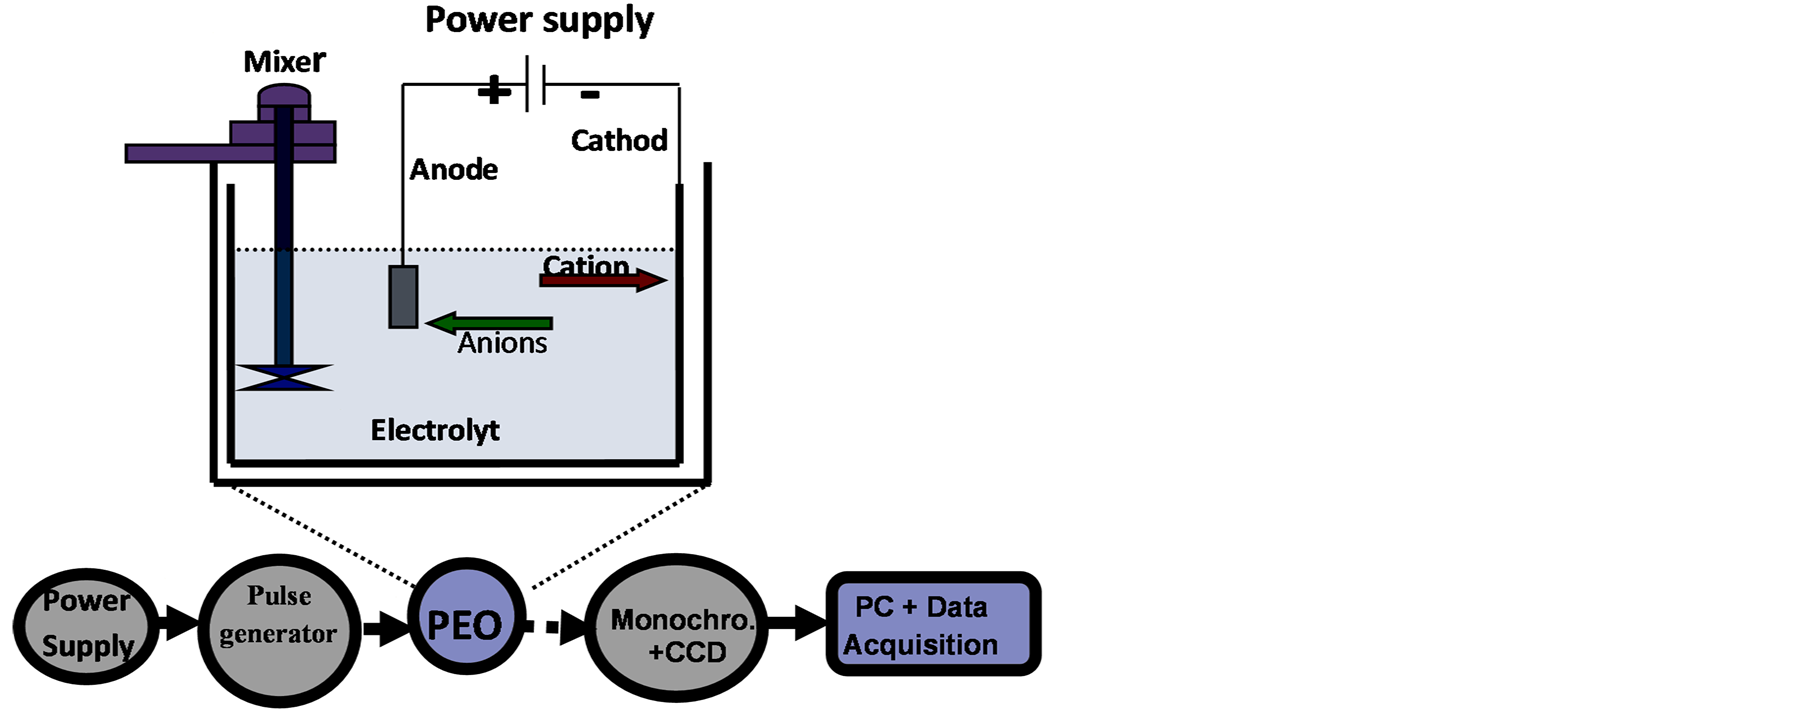
Figure 2. Schematic diagram of the experimental apparatus.
tems: a singlet and a triplet system. Optically allowed transitions (used in this calculation) which are excited from the same energy level are indicated by an arrow and labeled with the corresponding wavelength. Energy is measured relative to the ground state 3s 1S.
3. Experimental Results
3.1. Voltage Behavior
Figure 4 shows the average output anodic voltage as functions of PEO processing time using four combinations of current modes. The average voltage-time profile for PEO process is highly reproducible. Clear differences were seen between the curves for the four current modes. The voltage behaviour has been shown to be a limiting factor on the intensity of plasma discharges during PEO processing [17] [24] . For the unipolar current mode, Figure 4(a) the anodic potential raises quicker than that for the bipolar current mode, Figure 4(b). It then continues to rise gradually, reaching ∼510 V after 30 minutes. For H1 current mode when changing the mode from unipolar (H11) to bipolar (H12) current mode after 15 minutes, the voltage drops from 500 to 480 V then rise gradually to 504V, Figure 4(c). However, for the H2 when the current mode changes from bipolar (H21) to unipolar (H22) after 15 minutes the voltage increased from 490 to 510 V and then further increased gradually to 520 V (Figure 4(d)). According to the evolution of voltage (for example Figure 4(b)), the PEO process can be divided into four discharge stages, which have been described in detailed by Hussein et al. [18] . In the early stage of the process, which mainly involves the rapid electrochemical formation of an initial insulating oxide film, a sharp increase in the voltage was seen where the breakdown voltage is not yet reached. Then the rate of voltage change starts to decreases. However, numerous sparks moving rapidly over the whole sample surface area start to appear, which indicates a start of the breakdown of the oxide layer. After that the rate of voltage increase becomes slower and concentrated discharges appear as relatively large and long lasting sparks. Finally, for the last stage, stage IV, the distribution of discharge is non-uniform and there are small variations in the voltage values. For hybrid1 (H1) current mode, the changing of current mode delays the transaction from stage III to stage IV (see Figure 4(c)) however, for H2 mode the current mode change accelerates the transition from stage III to the stage IV, which is dominated by the relatively strong discharges.
3.2. Temporal Characterization of Line Spectrum
In order to study the influence of the current modes on the PEO plasma, it is necessary to investigate the changes in plasma spectrum with time. The acquisition frequency is about 3 Hz. The intensity of spectrum corresponds
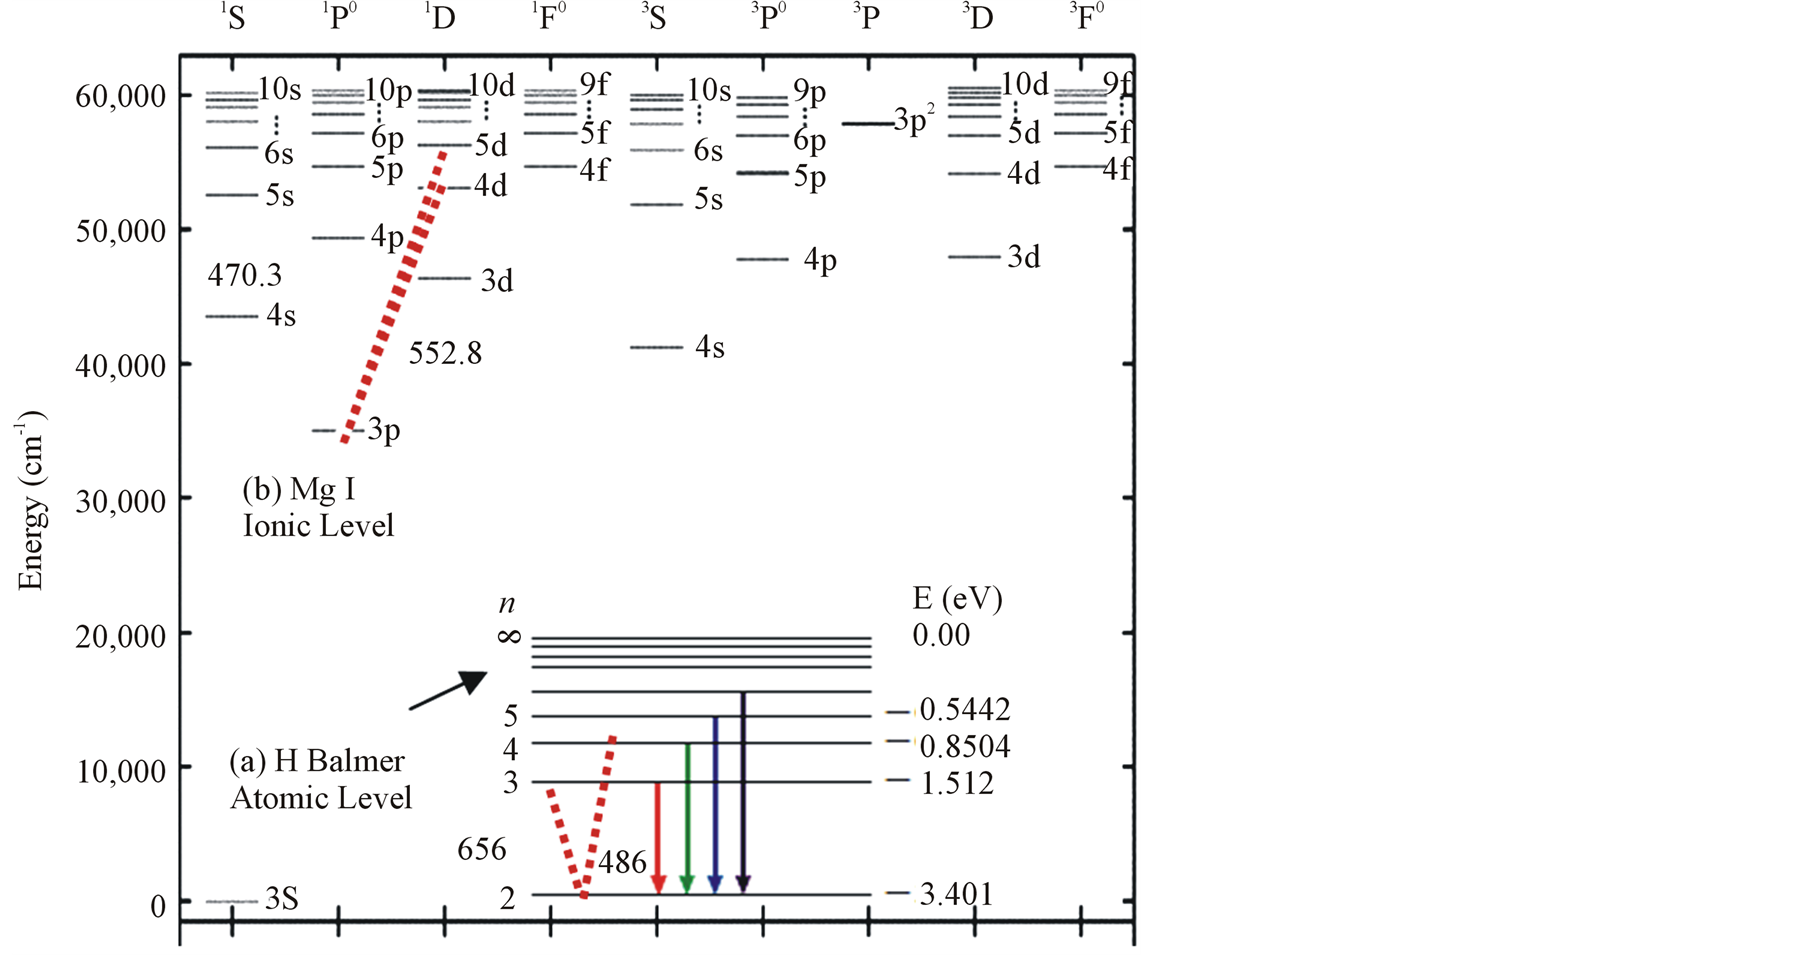
Figure 3. Atomic level configuration of Mg I and H-Balmer series.
to the cumulative result of all discharge events during the acquisition period. An OES spectrometer was used to record the key spectral lines at 383.8 nm (Mg I), 518.3 nm (Mg I), 470.3 nm (Mg I), 552.8 nm (Mg I), 486.1 nm (Hβ), 589.5 nm (Na I), and 656.2 (Hα) (see Table 2) [25] , and their variation with time.
The spectra of the PEO plasma for different species of PEO coatings using H1 and H2 current modes are shown in Figures 5 and 6 for a total coating process time of 30 min. The characteristic peaks that were observed are the result of excitation of these specific elements during the PEO process. Figures 5 and 6 show that the discharges are from the components of the electrolyte (Na and Hβ) and the substrate (Mg) which are excited during the process. The emission line intensity results indicate that most of the species in the plasma exhibited similar trends over the treatment time. This confirms that during the discharges the local plasma temperature is high enough to excite all the species that exist in those locations at that particular time. The line intensities produced using unipolar current mode, U, were higher than the intensities of the samples produced using a bipolar current mode, B. By using the bipolar current mode, there will be a balance of the discharge effects. The cathodic component of the bipolar current mode, as well as the longer Toff duration, has a significant effect on the
Table 2. Spectral lines observed in this experiment with the wavelength (λ), transition, statistical weight of the upper and lower state gk and gi (respectively), photon energy (ΔE) and the transition probabilities (Aki) [25] .
discharge behavior [20] .
For the singlet spectral lines of Mg I 470.3 nm and 552.8 nm, the intensity does not increase as much as that of the triplet Mg I lines (518.3 nm and 383.8 nm), because these singlet lines require a higher excitation energy. The observed strong excitation of sodium seems not contribute to the coating structure, since the EDX analysis of the coatings in a previous study [26] demonstrated that Na was not incorporated into the coating. This suggests that the PEO plasma discharges provide the required energy for the coating formation but all the elements excited by the plasma do not get incorporated into the coating.
For the hybrid current mode starting with unipolar followed by bipolar (H1), Figure 5, distinctive intensity spikes of Mg 518 nm can be seen in the period between 7 to 15 minutes from the start of the process. These spikes may be attributed to the strong discharges as well as to the particular discharge stages (I-IV) as described in ref. [18] . On the other hand, the intensity of the same Mg I 518 nm line shows fewer spikes with lower intensities in the bipolar current mode period indicating weaker discharge events. Also the spikes only start to appear during the last six minutes of the processing time. For the hybrid current mode (H2), Figure 6 shows that by starting with a bipolar current mode the Mg I 518.0 nm emission intensity signals are weak. When the current mode was switched to the unipolar mode, the intensity of the spectral lines increase rapidly and, although the spark sizes were small, they later grow to a larger size.
3.3. LTE Analyses and Self-Absorption
The LTE model describes a state of plasma in which a population distribution is determined by the law of statistical equilibrium except that radiation processes are not in a detailed balance. The population distribution of LTE plasmas can be described by Boltzmann and Saha equations [23] and free electrons have a Maxwellian energy distribution [23] . The LTE state is often found in laboratory plasmas of relatively high density and relatively low temperature when collisional processes are far more important than radiative processes. Even in non-LTE plasmas, it is always possible to find levels for which collisional transitions are dominant compared with radiative transitions depending on plasma conditions. Those levels said to be in partial LTE. The Boltzmann and Saha equations can be conveniently applied for the relative population distributions among the levels in partial LTE. The partial LTE state occurs when the collisional de-excitation rate from the upper level to the lower level greatly exceeds the spontaneous decay rate.
The assumption of LTE is fulfilled when the electron density is high enough so that:
Ne ≥ 1.6 × 10¹⁸Te1/2 (ΔE)3 (m−3) (1)
where ΔE (in eV) is the largest energy gap in the atomic energy level system and Te (in K) is the electron temperature of plasma [23] . When the electron temperature is 6000 K, the threshold value of electron density to fulfill the LTE assumption is about 5.4 × 10²² m−3. Plasma electron densities of the PEO plasmas from our previous measurements [18] are lower than the threshold value. Therefore partial LTE should be considered where the concentration yield is given by [27] :
 (2)
(2)
where kT is the electron temperature in (eV), EH (eV) is the ionization potential for the corresponding element, z is the ionization stage (z = 1 for neutral atoms) and n is the principle quantum number of the lowest quantum level included in the partial LTE (for the H, z = 1 and n = 2). The plasma electron concentration obtained from our previous work [18] , which is in good agreement with the results of [21] , were (0.7 – 1.2) × 1022 m−3 which is higher than the minimum plasma electron concentration for partial LTE, Ne > 0.4 × 10²² m−3, and therefore partial LTE exists, and the electron temperature estimated by Boltzmann assumption and Stark broadening effect reflect the characteristics of the plasma correctly.
Dunleavy et al. [20] has discussed the opacity problem in the PEO plasma. Following their discussion which is based on the results presented in ref. [28] on the effect of the absorption coefficient for water on the Balmer line intensity ratio, as a function of wavelength in the range of 580 - 790 nm, it can be estimated that the fraction of trapped photons in passage through up to about 10 cm of water would be less than 12% which is negligible for the present purposes. Consequently, the PEO plasma was assumed to be optically thin, i.e. none of the observed lines emitted from the plasma were affected by self-absorption.
3.4. Plasma Electron Temperature
The intensity ratio of the recorded 656.2 nm (Hα) to 486.1 nm (Hβ) spectra IH (3d2D → 2p2P)/IH (4d2D → 2p2P) (from the same ionization stage) (Te1) and the ratio of 552.8 nm (Mg I) to 470.3 nm (Mg I) IMg (3s4d 1D→ )/IMg (3s5d 1D →
 ) (Te2) were used to determine plasma electron temperature (Te). The Te results for experiments carried out using four different current modes are presented in Figure 7. The average temperatures of each two curves are also shown in Figure 7. It can be seen that the average measured temperature of the
two ratios are in the range of 5800 - 6800 K for the unipolar case, 6100 - 6700 K for bipolar case, 6300 - 6600 K for H1 case and in the range 5900 - 6700 K for H2 case. These results are in good agreement with the Te results for Mg AJ62 alloy 20.
Figure 7(a) shows plasma temperature profile for the unipolar current mode (U). Te1 is initially around 7000 K which corresponds to the early stage discharges where the density of the discharges is very high. Te then drops to about 5000 K after about three minutes and then fluctuated around 5600 K for the reminder of the time. Electron temperatures measured using the second pair of lines Te2 (552.8 nm to 470.3 nm) are slightly higher than those obtained from the first pair of lines Te1 (656.2 nm to 486.1 nm) particularly after the first two min. The curve started to show a high number of closely-spaced temperature spikes some of them reaching up to 7000 K. These spikes corresponded to relatively strong discharges initiated from the sample surface-coating interface, the so-called B-type discharge [18] , whereas the base line average is at ~6000 K.
For the bipolar case B, Figure 7(b) shows that the base line average is ~5500 K for the first 20 min and then spike around 21 min to 6100 K and then fluctuates around 5900 K. Electron temperatures measured using the second pair of lines Te2 shows relatively higher temperature than those obtained from the first pair of lines Te1 during the entire treatment time after 4 min. Temperature spikes start to appear after 8 min. However, these spikes are less frequent and cooler than that for the unipolar samples.
Applying a hybrid current mode, sample H1, treated using a unipolar mode first followed by a bipolar mode, clearly shows the effect of current mode on the plasma temperature where the average temperatures of the plasma during the bipolar mode were higher than those during the unipolar mode (Figure 7(c)). This is attributed to the fact that when suppressing the strong B-type discharges the number of other discharges, A-, Cand mild Btypes, will increase which will then increase the base line temperature. Figure 7(c) also shows that the Te1 results are in very good agreement with the Te2 results for the bipolar treatment period. The use of a hybrid current mode, sample H2, where the sample was coated first using a bipolar current mode followed by the unipolar current mode, shows almost the same trends as for H1 samples, in terms of the bipolar period having higher average electron temperatures, and the good agreement between Te1 and Te2.
Table 3 summarizes the average background temperature and maximum spike temperatures for the four sets of samples. We therefore conclude that the Te-time profile depends strongly on the type of discharge and on the current mode, as a result of the competition between both the current phases (positive and negative) and the pulse timing. When using a bipolar current mode, the strong temperature spikes (due to B-type discharge) are suppressed, or only appear at later times, and since the total number of all types of discharge (A-, Cand mild B-type discharges) will be increased, it has the largest effect on the average (background) plasma temperature and hence on the coating microstructure and surface morphology.
3.5. Discharge Behaviour and Coating Microstructure
The fluctuations in signal intensities and temperature during the coating process (i.e. weak and strong signals) reflect differences in location of both the discharge initiation, and discharge type. Based on our discharge model described in detail in [18] , the Mg emission intensity signals were due to three different types of discharge that are differentiated according to the origins of such signals. The B-type discharge is due to dielectric breakdown in a strong electric field occurring through the oxide layer. The Aand C-types of discharge are due to gas discharges occurring in micropores of the oxide film. Type A are from the surface pores, while the C-type are from discharges on relatively deep pores. While the high intensity spikes mainly correspond to the B-type discharge, the background intensity profile was related to the A-type and C-type discharges. The observed differences in the intensity: time trends between unipolar, bipolar, and the hybrid current modes suggest that the current mode plays a significant role in the coating process [16] .
Figure 8(i) shows the SEM micrographs of the coating surfaces obtained using secondary electron mode (SE): H11 treated using unipolar current mode only for 15 minutes, H12 by completing the treatment of H11 using bipolar current mode for another 15 minutes; H21 treated firstly using bipolar current mode; H22 completed the treatment using unipolar mode for second 15 minutes. Figure 8(ii) which are SEM micrographs of the coating cross-sections also obtained using the secondary electron mode. As can be seen from Figure 8(c) and d for unipolar followed by bipolar compared with Figures 8(a) and (b) for unipolar only, the addition of a bipolar part improves the coating quality compared with the unipolar current mode, in terms of surface morphology where the porosity levels were reduced significantly and the cross-sectional microstructure for the H12 shows a coating with fewer-defects that is more adherent to the substrate compared to the H11 sample, which was treated using a unipolar mode only. Therefore, the bipolar part seems to act as a repair mode for the coatings.
The coating surface morphology and cross-sectional microstructure that are obtained can be linked to the plasma discharge behavior. Figure 9(a) is a schematic diagram of the discharge process for a Mg-alloy sample, and shows the influence of the discharges on the intensity profile, Figure 9(c), as well as on the coating microstructure (Figures 9(b) and (d)). The high intensity spikes correspond to the strongest discharges (B-type discharge) which significantly affect the microstructure and morphology of the coating [29] . These strong discharges produce a more porous coating. Strong discharges can be reduced, or eliminated, by appropriately adjusting the bipolar current and the on and off time interval of the pulses as can be seen in Figures 5 and 6. Elimination of the B-type discharges leads to denser microstructures with less porosity.
A modified growth model that not only includes Type A, B and C discharges but also discharges that occur in
Table 3. Spike and average plasma electron temperatures for the four different current modes.
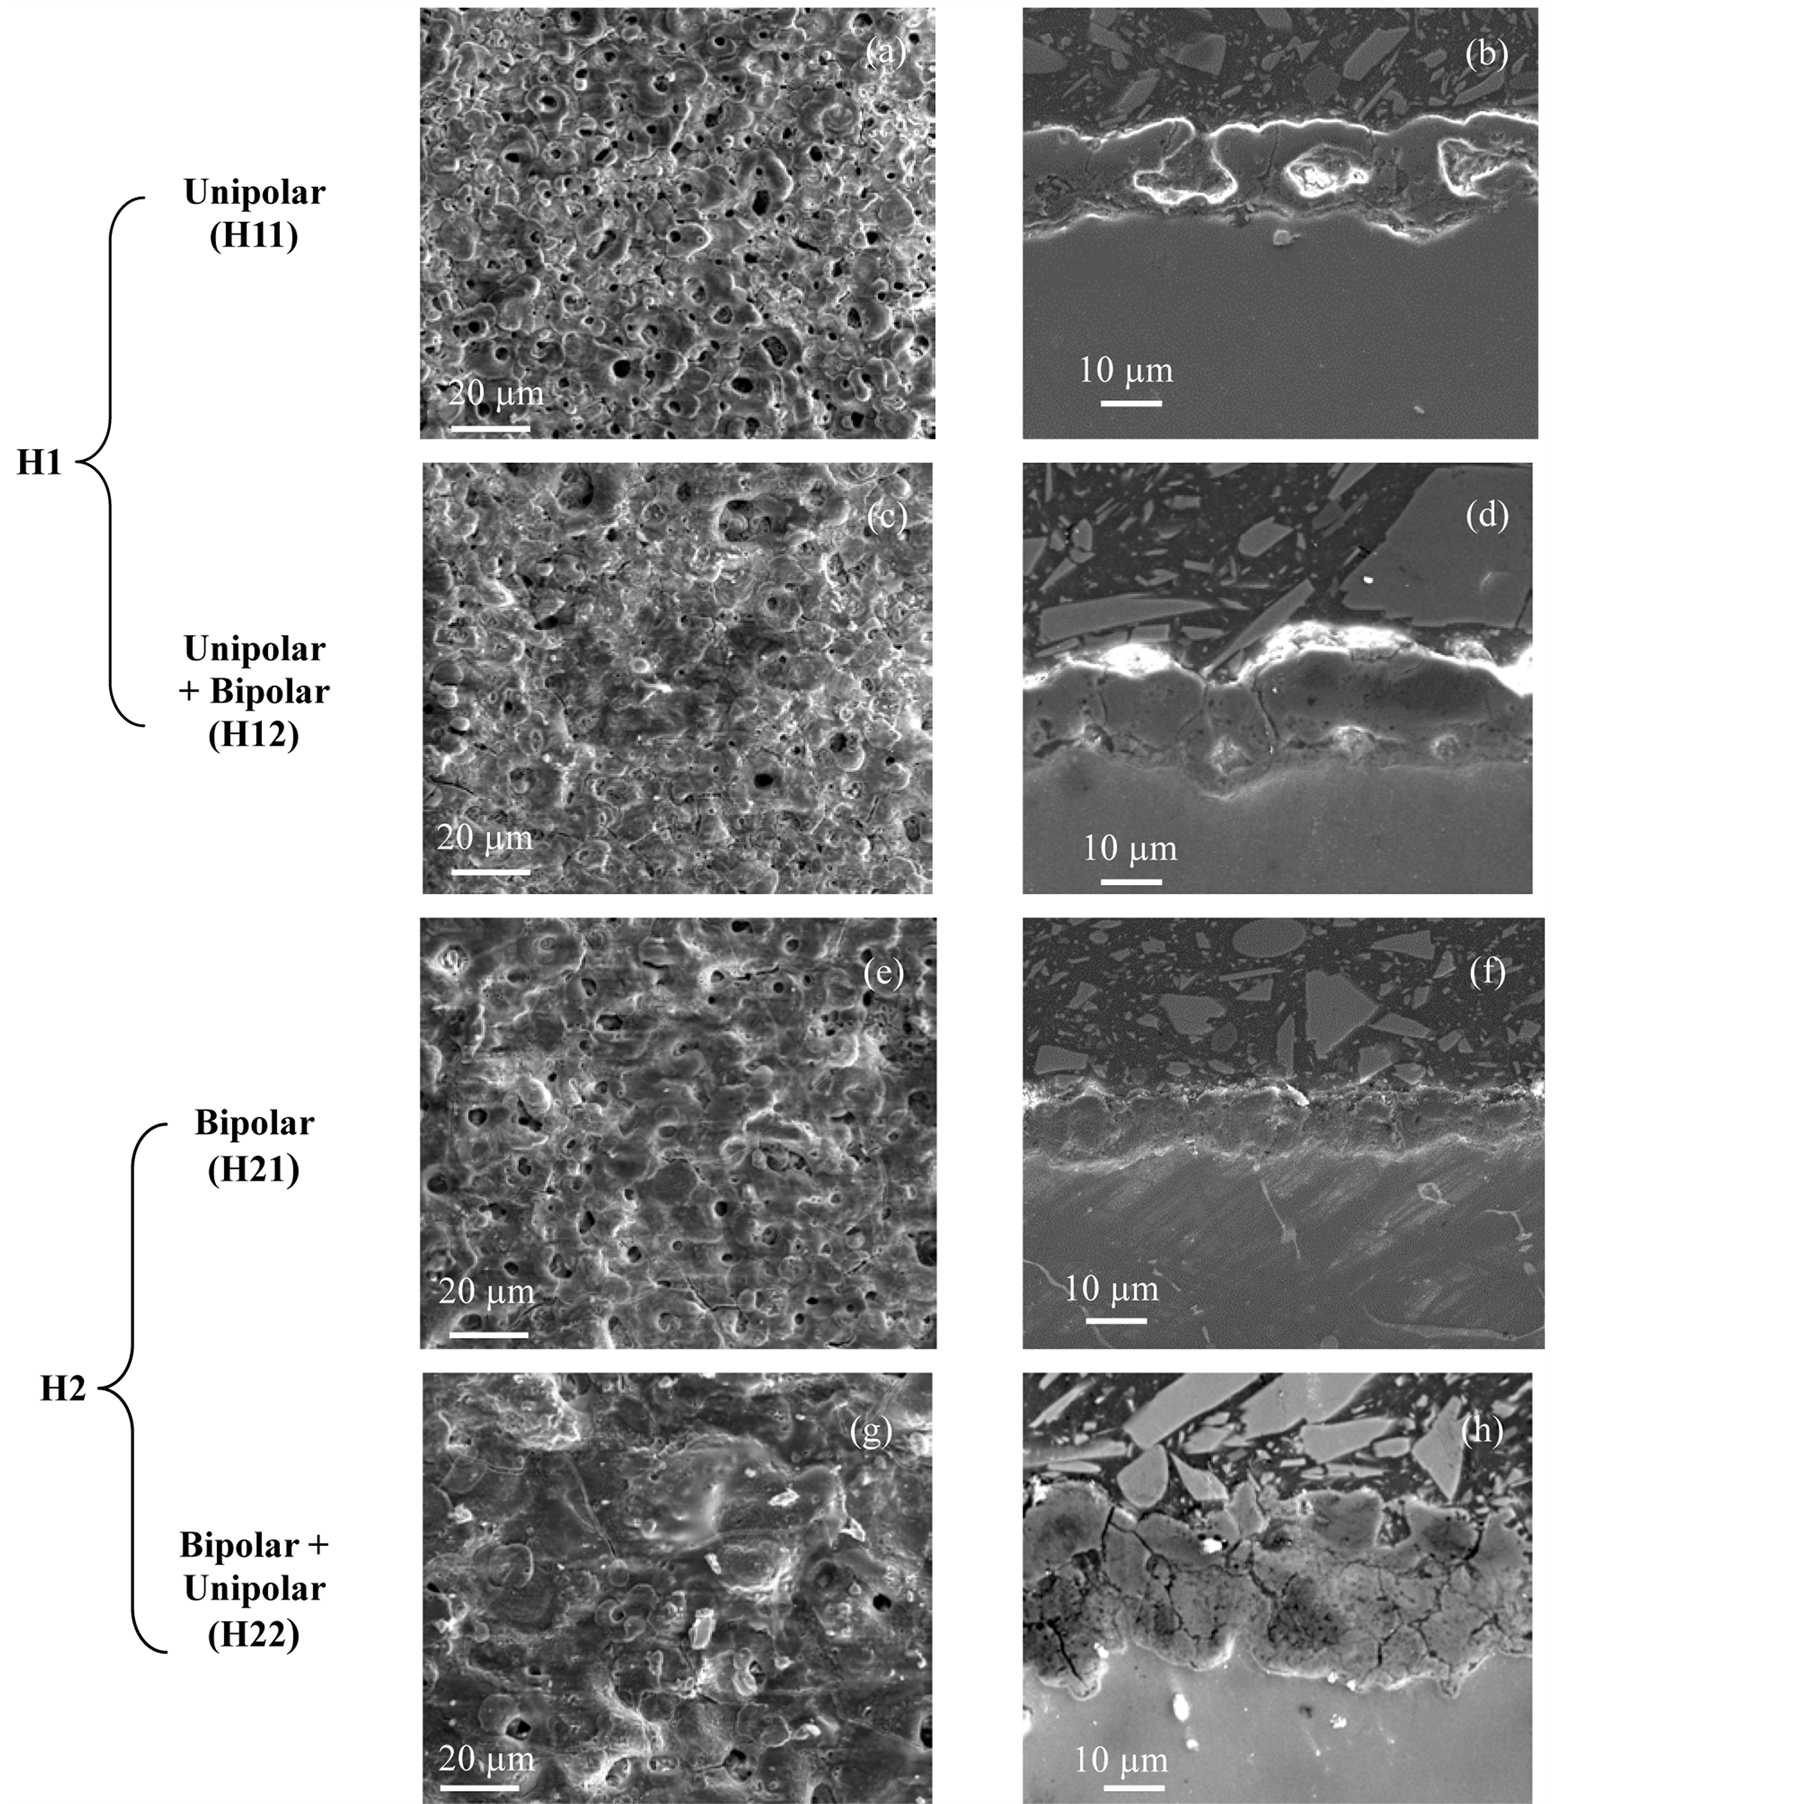
Figure 8. (i) Morphology of oxide coatings on an Mg AM60B alloy using secondary electron mode (SE); (ii) SEM micrographs of polished sections of coatings using secondary electron mode (SE) and for: (a, b) unipolar H11, (c, d) hybrid1 (uni + bipolar), (e, f) bipolar H21 and (g, h) hybrid2 (bi + unipolar) current modes.
large pores near the interface between the inner and outer layers (type D) and those which may form the pancake-structures that occur mainly within the outer coating layer (type E) has been proposed by Cheng et al. [30] . However, according to our discharge model [18] , the pancake-structures are due to strong Type B discharges initiated close to the substrate surface.
Figure 9(b) is a SEM micrograph of a coating prepared using a unipolar current mode and shows a large number of “pancake”-like features and discharge pores which irregularly arranged on the coating surface: This is a common characteristic of PEO coatings. Figure 9(b) shows that some of the regions on the coating surface were covered with freshly solidified magnesium oxide, leaving the adjacent regions uncovered. The relatively large holes in the center of the pancake suggest that they were produced by strong discharges and such holes might penetrate deep in to the coating. Some micro-cracks were present on the coating surface, which could have resulted from thermal stresses generated during the rapid solidification of the molten oxide product in the strong discharge channel [31] . The stronger the discharge, the larger is the molten mass produced by a single

Figure 9. Schematic diagram of the discharge model showing the influence of B-type discharges on plasma temperature profile, surface morphology and on the cross section of the oxide coating.
discharge. When this molten mass erupts from the discharge channel, it rapidly solidifies around the discharge channels, thus, giving rise to the “pancake-like” features and randomly distributed discharge pores on the coating surface. Both of these features cause an increase in the surface roughness. The micro-pores are due to gas bubbles ejected from surface discharges and are referred to as Aand C-type discharges.
Figure 9(d) is a SEM micrograph of the cross-section of a sample produced using the unipolar current mode (U). The coating has a significant amount of connected porosity, holes and other structural defects both within the coating and near the coating/substrate interface. Such defects and porosity were likely caused by the strong B-type discharges and gas trapping in the vicinity of electrical discharges at such an area due to a fast solidification process. The average coating thickness after the 30 min treatment time for H1 was about 25 - 30 µm and 33 - 40 µm for H2. The coating-substrate interfaces had a wavy-jagged appearance, which may be the result of dissolution of the substrate during the treatment time and/or the presence of intermetallics at the grain boundaries. Also, there is evidence of a network of through-coating defects (microcracks). One of major concerns is the substrate/coating interface, where the very strong B-type discharge is initiated. The main effect of the bipolar current mode is a discharge disturbance, which prevents the development of long lived, very large microdischarges. By using the bipolar current mode there will be a balance of the discharge effects [20] . A unipolar current mode produces a thicker coating than the bipolar: see Figure 8(b) compared with Figure 8(f). Coatings prepared using a combination of unipolar followed by bipolar modes (H1) had a dense inner layer with fewer defects with lower growth rate compared with coatings prepared using reverse order i.e. bipolar followed by unipolar (H2) as can be seen from comparing Figures 8(d) and (h).
The PEO coating thickness depends on current mode type and density, electrolyte composition and concentration and treatment time. The PEO coatings of Mg alloys are comprised of amorphous and crystalline phases such as MgO, Mg2SiO4, Mg3(PO4)2 or Mg2AlO4, depending on the electrolyte [32] . A recent study by Hussein et al. 15 on the interactive effects of hybrid current modes on the tribological and corrosion properties of a PEO coated AM60B Mg-alloy shows that the corrosion performance is more closely related to the protective nature of the dense oxide layer at the coating-substrate interface. In this regard, the most protective oxide is formed by using the H1 current mode. The protection efficiency of the H1 coating is approximately 25 times more than for the H2 coating. In the H1 case, the bipolar mode appears to repair the damage produced during the unipolar cycle. The denser coatings with lower surface roughness that are produced by the B and H1 current modes compared to the U and H2 modes lead to improved tribological performance in both pin-on-disk and inclined impact-sliding tests [15] .
3.6. Porosity and Pore Size Analysis
Figure 10(a) shows relatively low magnification SEM images which were image-processed for porosity analysis. The surfaces of the coatings were dominated by many randomly arranged donut-shaped projections with open or sealed microporosities in the center. The large microporosities are considered as footprints of the plasma discharge channels, through which the Mg and Mg2+ from the substrate were likely ejected and reached the coating/electrolyte interface during the plasma-induced melting, then combined with the electrolyte anion including or reacted with O2 generated due to electrolysis, and finally sintered and deposited on the coating surface, contributing to the coating growth. Figure 10 gives the average porosities (which represent the percentage of the surface areas of black spots relative to the total image area) for each of the four cases. The averaged porosities of each sample, was determined from SEM images for a typical surface area of 620 by 675 μm. The pores varied in size from very small diameters (<1 µm) through medium size (few µm) to large pores (>10 µm).

Figure 10. (a) Low and (b) high magnification SEM images and the processed images with corresponding porosities distribution chart for (c) H11, (d) H12, (e) H21 and (f) H22.
Pore sizes can be linked with the discharge type described in detail by Hussein et al. [18] . Sample H11 (unipolar for 15 minutes only) with an average porosity of 14.4% exhibited a large number of pores with diameter (<10 µm). H12 (unipolar followed by bipolar) showed a lower porosity (4.3%) than H11 but, some large pores were also present on the surface. The porosity of H21 and H22 are 8.4% and 7.2% respectively, with medium pore sizes. H11 (only unipolar) showed the highest level of porosity which may be attributed to the large number of the strong and irregularly distributed B-type discharges which are generally associated with the unipolar current mode [15] [19] . However after applying a bipolar current mode for the second 15 minutes, H12, the porosity was reduced to the lowest value of all four modes. Such morphology was expected since both the number and intensity of the strong B-type discharges 20 are reduced by using a bipolar current mode. Porosity has a significant effect on the mechanical properties of ceramic coatings, mainly hardness and stiffness: 20% of porosity can reduce the hardness by 60% - 70% from the fully dense value [33] , and may also reduce the stiffness by 30% [34] .
According to Curran and Clyne [31] , the porosity of the PEO coatings should be higher than the measured values for H11, H12, H21 and H22 due to the existence of very fine scale porosity (<100 nm). Such fine scale porosity although detectable using techniques such as mercury porosimetry, densitometry and BET adsorption measurements as used by Curran and Clyne [31] , cannot be seen on the low magnification SEM micrograph. However, examination of the coating surface at a higher magnification, Figure 10(b), reveals the presence of such fine scale, interconnected porosity. In addition of the very fine scale porosity, Figure 10(b) also shows different sizes of pores, tiny and very small sizes which are related to the discharge behaviors, A-, and C-type discharges however the medium and large pore sizes are related to the mild and strong B-type discharges, shown in Figure 9.
4. Conclusions
Four different current modes (unipolar, bipolar and hybrid (unipolar-bipolar and bipolar-unipolar)) were used in the PEO processing of Mg-alloy AM60B in a mixed aluminate and phosphate electrolyte. The effects of current mode on the plasma parameters were investigated and the following conclusions are made:
1) Plasma electron temperatures (Te) were determined by the line intensity ratios of two pairs of H and Mg lines, the 656.2 nm to 486.1 nm (Te1) and the 552.8 nm and 470.3 nm (Te2) lines respectively. Plasma electron temperatures were found to in the range of 5000 - 7000 K for the unipolar case, 5200 - 6600 K for the bipolar case, 5500 - 7500 K for the unipolar + bipolar case and 4200 - 7500 K for bipolar + unipolar case.
2) Controlling or reducing the strong discharges had a significant positive effect on the plasma temperature profiles and leads to denser inner layer microstructures with less porosity.
3) A careful examination of the plasma characterization results obtained by OES analysis and the SEM results of the coating morphology and microstructure, highlights clear differences between samples coated using unipolar, bipolar or hybrid current modes. A hybrid (H12) current mode improves the coating quality compared to the unipolar mode (H11) in terms of having a dense inner layer with fewer defects due to the combination effects of the two current modes. The fluctuations in the measured line intensities (different spike) support the discharge model and the resulting coating microstructures.
4) Further work is required on the correlation of the process parameters with the microstructure of the coating layers in order to understand the factors that lead to an increase in the inner dense layer and minimize the outer, porous layer.
Acknowledgements
This research was supported by the Natural Science and Engineering Research Council of Canada (NSERC).
NOTES
*Corresponding author.