Inverse Bayesian Estimation of Gravitational Mass Density in Galaxies from Missing Kinematic Data ()

Keywords:
The method of science calls for the understanding of selected aspects of behaviour of a considered system, given available measurements and other relevant information. The measurements may be of the variable 
 while the parameters that define the selected system behaviour may be
 ,
,  or the selected system behaviour can itself be an unknown and sought function
  of the known input variable vector
 , so that
 . In either case, we relate the measurements with the model of the system behaviour as in the equation
  or
or  where the function
  is unknown. Alternatively, in either case the scientist aims to solve an inverse problem in which the operator
 , when operated upon the data, yields the unknown(s).
One problem that then immediately arises is the learning of the unknown function . Indeed
  is often unknown though such is not the norm―for example in applications in which the data is generated by a known projection of the model function onto the space
  of the measurables,
  is identified as this known projection. Thus, image inversion is an example of an inverse problem in which the data are a known function of the unknown model function or model parameter vector [1-5, among others]. On the other hand, there can arise a plethora of other situations in science in which a functional relationship between the measurable
  and unknown
  (or
(or ) is appreciated but the exact form of this functional relationship is not known [6-12, to cite a few].
This situation allows for a (personal) classification of inverse problems such that
• in inverse problems of Type I,  is known where
  or
or ,
,
• in inverse problems of Type II,  is unknown.
While inverse problems of Type I can be rendered difficult owing to these being ill-posed and/or ill- conditioned as well as in the quantification of the uncertainties in the estimation of the unknown(s), inverse problems of Type II appear to be entirely intractable in the current formulation of  (or
(or ), where the aim is the learning of the unknown
  (or
(or ), given the data. In fact, conventionally, this very general scientific problem would not even be treated as an inverse problem but rather as a modelling exercise specific to the relevant scientific discipline. From the point of view of inverse problems, these entails another layer of learning, namely, the learning of
  from the data―to be precise, from training data [13-15]. Here by training data we mean data that comprises values of
  at chosen values of
  (or at chosen
 ). These chosen (and therefore known) values of
  (or
(or ) are referred to as the design points, so that values of
  generated for the whole design set comprise the training data.Having trained the model for
  using such training data, we then implement this learnt model on the available mea- surements―or test data―to learn that value of
  (or
(or ) at which the measurements are realised.
It is in principle possible to generate a training data set from surveys (as in selected social science applications) or generate synthetic training data sets using simulation models of the system [16-18]. However, often the Physics of the situation is such that  is rendered characteristic of the system at hand (as in complex physical and biological systems). Consequently, a simulation model of the considered system is only an approximation of the true underlying Physics and therefore risky in general; after all, the basic motivation behind the learning of the unknown
  (or
(or ) is to learn the underlying system Physics, and pivoting such learning on a simulation model that is of unquantifiable crudeness, may not be useful.
Thus, in such cases, we need to develop an alternative way of learning  or if possible, learn the un- known
  (or
(or ) given the available measurements without needing to know
 . It may appear that such is possible in the Bayesian approach in which we only need to write the posterior probability density of the unknown
  (or
(or ), given the data. An added advantage of using the Bayesian framework is that extra information is brought into the model via the priors, thus reducing the quantity of data required to achieve inference of a given quality. Importantly, in this approach one can readily achieve estimation of uncertainties in the relevant parameters, as distinguished from point estimates of the same. In this paper, we present the Bayesian learning of the unknown model parameters given the measurements but no training data, as no training data set is available. The presented methodology is inspired by state space modelling techniques and is elucidated using an application to astronomical data.
The advantages of the Bayesian framework notwithstanding, in systems in which training data is unavailable, fact remains that  cannot be learnt. This implies that if learning of the unknown
  (or
(or ) is attempted by modelling
  as a realisation from a stochastic process (such as a Gaussian Process (GP) or Ito Process or t-process, etc.), then the correlation structure that underlies this process is not known. However, in this learning approach, the posterior probability of the unknowns given the data invokes such a correlation structure. Only by using training data can we learn the covariance of the process that
  is sampled from, leading to our formulation of the posterior of the unknowns, given the measured data as well as the training data. To take the example of modelling
  using a high-dimensional GP, it might be possible of course to impose the form of the covariance by hand; for example, when it is safe to assume that
  is continuous, we could choose a stationary covariance function [19], such as the popular square exponential covariance or the Matern class of covariance functions [20], though parameters of such a covariance (correlation length, smoothness parameter) being unknown, ad hoc values of these will then need to be imposed. In the presence of training data, the smoothness parameters can be learnt from the data.
For systems in which the continuous assumption is misplaced, choosing an appropriate covariance function and learning the relevant parameters from the measured data, in absence of training data, becomes even trickier. An example of this situation can arise in fact in an inverse problem of Type I―the unknown physical density of the system is projected onto the space of observables such that inversion of the available (noisy) image data will allow for the estimation of the unknown density, where the projection operator is known. Such a density function in real systems can often have disjoint support in its domain and can also be typically characterised by sharp density contrasts as in material density function of real-life material samples [21]. Then, if we were to model this discontinuous and multimodal density function as a realisation from a GP, the covariance function of such a process will need to be non-stationary. It is possible to render a density function sampled from such a GP to be differently differentiable at different points, using for example prescriptions advanced in the literature [22], but in lieu of training data it is not possible to parametrise covariance kernels to ensure the representative discontinuity and multimodality of the sampled (density) functions. Thus, the absence of training data leads to the inability to learn the correlation structure of the density function given the measured image data.
A way out this problem could be to make an attempt to construct a training data set by learning values of the unknown system behaviour function at those points in the domain of the density, at which measured data are available; effectively, we then have a set of data points, each generated at a learnt value of the function, i.e. this set comprises a training data. In this data set there are measurement uncertainties as well as uncertainty of estimation on each of the learnt values of the system function. Of course, learning the value of the function at identified points within the domain of the system function, is in itself a difficult task. Thus, in this paradigm, the domain  of the unknown system function
  is discretised according to the set of values of
 ,
,  , at which the
  measurements are available. In other words, the discretisation of
  is dictated by the data distribution. Over each
  -bin, the function
  is held a constant such that for
  in the i-th bin, the function takes the value
 ,
, ; then we define
  and try to learn this vector, given the data. Unless otherwise motivated, in general applications, the probability distribution of
  is not imposed by hand. In the Bayesian framework this exercise translates to the computing of the joint posterior probability density of
  distribution-free parameters
  given the data, where the correlation between
  and
and  is not invoked,
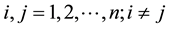 . Of course, framed this way, we can only estimate the value of the sought function
  at identified values of
 ―unless interpolation is used―but once the training data, thus constructed, is subsequently implemented in the modelling of
  with a GP of appropriate dimensionality, statistical prediction at any value of
  may be possible.
Above, we dealt schematically with the difficult case of lack of training data. However, even when a training data set is available, learning  using such data can be hard. In principle,
  can be learnt using splines or wavelets. However, a fundamental shortcoming of this method is that splines and wavelets can fail to capture the correlation amongst the component functions of a high-dimensional
 . Also, the numerical difficulty of the very task of learning
  using this technique, and particularly of inverting the learnt
 , only increases with dimensionality. Thus it is an improvement to model such a
  with a high-dimensional GP. A high-dimensional
  can arise in a real-life inverse problem if the observed data is high-dimensional, eg. the data is matrix-variate [23].
Measurement uncertainties or measurement noise is almost unavoidable in practical applications and therefore, any attempt at an inference on the unknown model parameter vector  (or the unknown model function
 ) should be capable of folding in such noise in the data. In addition to this, there could be other worries stemming from inadequacies of the available measurements―the data could be “too small” to allow for any meaningful inference on the unknown(s) or “too big” to allow for processing within practical time frames; here the qualification of the size of the data is determined by the intended application as well as the constraints on the available computational resources. However, a general statement that is relevant here is the fact that in the Bayesian paradigm, less data is usually required than in the frequentists’ approach, as motivated above. Lastly, data could also be missing; in particular, in this paper we discuss a case in which the measurable lives in a space
  where
where  is the state space of the system at hand.
The paper is constructed as follows. In Section 2, we briefly discuss the outline of state space modelling. In the following Section 3, our new state space modelling based methodology is delineated; in particular, we explore alternatives to the suggested method in Subsection 3.1. The astrophysical background to the application using which our methodology is elucidated, is motivated in Section 4 while the details of the modelling are presented in Section 5. We present details of our inference in Section 6 and applications to synthetic and real data are considered in Section 7 and Section 8 respectively. We round up the paper with some discussions about the ramifications of our results in Section 9.
2. State Space Modelling
Understanding the evolution of the probability density function of the state space of a dynamical system, given the available data, is of broad interest to practitioners across disciplines. Estimation of the parameters that affect such evolution can be performed within the framework of state space models or SSMs [24-27]. Basically, an SSM comprises an observation structure and an evolution structure. Assuming the observations to be con- ditionally independent, the marginal distribution of any observation is dependent on a known or unknown stationary model parameter, at a given value of the state space parameter at the current time. Modelling of errors of such observations within the SSM framework is of interest in different disciplines [28,29].
The evolution of the state space parameter is on the other hand given by another set of equations, in which the uncertainty of the evolved value of the parameter is acknowledged. A state space representation of complex systems will in general have to be designed to capacitate high-dimensional inference in which both the evolutionary as well as observation equations are in general non-linear and parameters and uncertainties are non-Gaussian.
In this paper we present a new methodology that offers a state space representation in a situation when data is collected at only one time point and the unknown state space parameter in this treatment is replaced by the discretised version of the multivariate probability density function (pdf) of the state space variable. The focus is on the learning of the static unknown model parameter vector rather than on prediction of the state space parameter at a time point different to when the observations are made. In fact, the sought model parameter vector is treated as embedded within the definition of the pdf of the state space variable. In particular, the method that we present here pertains to a partially observed state space, i.e. the observations comprise measurements on only some―but not all―of the components of the state space vector. Thus in this paradigm, probability of the observations conditional on the state space parameters reduces to the probability that the observed state space data have been sampled from the pdf of the full state space variable vector, marginalised over the unobserved components. Here this pdf includes the sought static model parameter vector in its definition. In addition to addressing missing data, the presented methodology is developed to acknowledge the measurement errors that may be non-Gaussian.
The presented method is applied to real and synthetic astronomical data with the aim of drawing inference on the distribution of the gravitational mass of all matter in a real and simulated galaxy, respectively. This gravitational mass density is projected to be useful in estimating the distribution of dark matter in the galactic system.
3. Method in general
Here we aim to learn the unknown model parameter vector  given the data, where data comprises
  measurements of some (h) components of the d-dimensional state space parameter vector
 ; thus,
 . Here
 . In fact, the data set is
  where the i-th observation is the vector
 . Let the state space be
  so that
 . Let the observable vector be
 . Let
. Let , i.e. the probability density function of the state parameter vector
  is
is , where the distribution is parametrised by the parameter
 .
.
In light of this, we suggest that . Then had the observations lived in the state space
 , we could have advanced the likelihood function in terms of
 . However, here we deal with missing data that we know lives in the sub-space
  within
 . Therefore, the data must be sampled from the density
  that is obtained by marginalising the pdf
  over
over . In other words, the pdf
  is projected onto the space of the observables, i.e. onto
 ; the result is the projected or marginalised density
  of the observables. Then under the assumption of the observed vectors being conditionally iid, the likelihood function is
![]() (1)
(1)
where
![]() (2)
(2)
While the likelihood is thus defined, what this definition still does not include in it is the sought model parameter vector . In this treatment, we invoke a secondary equation that allows for the model parameter vector
  to be embedded into the definition of the likelihood. This can be accomplished by eliciting application specific details but in general, we suggest
 ![]() and construct the general model for the state space pdf to be
and construct the general model for the state space pdf to be
![]() (3)
(3)
where  is a t-dimensional vector function of a vector.
Given this rephrasing of the state space pdf, the projected density that the i-th measurement  is sampled from, is re-written as
![]() (4)
(4)
so that plugging this in the RHS of Equation (1), the likelihood is
![]() (5)
(5)
However, it is appreciated that the pdf of the state space vector  may not be known, i.e.
  is unknown. This motivates us to attempt to learn the state space pdf from the data, simultaneously with
 . We consider the situation that training data is unavailable where training data would comprise a set of values of
  generated at chosen values of
 . However, since the very functional relationship (
 in the notation motivated above) between
  and
and  is not known, it is not possible to generate values of
  at a chosen value of
 , unless of course, an approximation of unquantifiable crudeness for this functional relationship is invoked. Here we attempt to improve upon the prospect of imposing an ad hoc model of
 . Then in this paradigm, we discretise the function
 .
.
This is done by placing the relevant ranges of the vectors  and
and  on a grid of chosen cell size. Thus, for
  and
and  being discretised into
  and j-dimensional vectors respectively, the discretised version of
  is then represented as the
  -dimensional vector
  such that the p-th component of this vector is the value of
  in the p-th “
 -grid cell”. Here, such a grid-cell is the p-th of the ones that the domain of
  is discretised into,
 .
.
Given this discretisation of , the RHS of Equation (4) is reduced to a sum of integrals over the unobserved variable in each of the grid-cells. In other words,
![]() (6)
(6)
where  is the value that the vector of the unobserved variables takes up in the p-th
  -grid-cell. The integral on the RHS of Equation (6) represents the volume that the p-th
  -grid-cell occupies in the space of the unobserved variable vector
 . The value of
  in the p-th
  -grid-cell is dependent in general on
  for a given data vector
 ; hence the notation
 .
.
In other words, to compute the integral for each p (on the RHS of Equation (6)) we need to identify the bounds on the value of each component of  imposed by the edges of the p-th
  grid-cell. This effectively calls for identification of the mapping between the space of
  and
and , and the space of the unobserved variables
 . Now the observation
 . Then
 , where
 . Indeed, this mapping will be understood using the physics of the system at hand. We will address this in detail in the context of the application that is considered in the paper.
The likelihood function is then again rephrased as
![]() (7)
(7)
using Equation (6).
However, the observed data is likely to be noisy too. To incorporate the errors of measurement, the likelihood is refined by convolving  with the density of the error
  in the value of the observed vector
 , where the error distribution is assumed known. Let the density of the error distribution be
  where
where  are the known parameters. Then the likelihood is finally advanced as
![]() (8)
(8)
In a Bayesian framework, inference is pursued thereafter by selecting priors for the unknowns  and
and , and then using the selected priors in conjunction with the likelihood defined in Equation 8, in Bayes rule to give
the posterior of the unknowns given the data, i.e. . In the context of the application at hand,
we will discuss all this and in particular, advance the data-driven choice of the details of the discretisation of the  function. Posterior samples could be generated using a suitable version of Metropolis-Hastings and implemented to compute the 95% HPD credible regions on the learnt parameter values.
Alternative methods
We ask ourselves the question about alternative treatment of the data that could result in the estimation of the unknown model parameter vector . Let the sought model parameter be s-dimensional while the observable
  is an h-dimensional vector valued variable and there are
  number of measurements of this variable available. Then the pursuit of
  can lead us to express the data as a function of the model parameter vector, i.e. write
 , where
  is an unknown, h-dimensional vector valued function of an s-dimensional vector. In order to learn
 , we will need to first learn
  from the data, as was motivated in the introductory section.
As we saw in that section, the learning of this high-dimensional function from the data and its inversion are best tackled by modelling the unknown high-dimensional function with a Gaussian Process. [23] present a generic Bayesian method that performs the learning and inversion of a high-dimensional function given matrix-variate data within a supervised learning paradigm; the (chosen) stationary covariance function implemented in this work is learnt using training data and is subsequently used in the computation of the posterior probability of the unknown model parameter vector given the measured or test data, as well as the training data. In the absence of available training data, such an implementation is not possible, i.e. such a method is not viable in the unsupervised learning paradigm. In the application we discuss below, training data is not available and therefore, the modelling of the functional relation between data and , using Gaussian Processes appears to not be possible. This shortcoming can however be addressed if simulations of the system at hand can be undertaken to yield data at chosen values of
 ; however, the very physical mechanism that connects
  with the data may be unknown (as in the considered application) and therefore, such a simulation model is missing. Alternatively, if independently learnt
 , learnt with an independent data set, is available, the same can be used as training data to learn
  given another data set. On such instances, the Gaussian Process approach is possible but in lieu of such training data becoming available, the learning of
  given the matrix-valued data can be performed in the method presented above. On the other hand, a distinct advantage of the method presented below is that it allows for the learning of the state space density in addition to the unknown model parameter vector.
If the suggestion is to learn the unknown system function  as itself a realisation of a GP, the question that then needs to be addressed is how to parametrise the covariance structure of GP in situations in which the data results from measurements of the variable
  that shares an unknown functional relation with
 . In other words, in such situations, the unknown system function
  has to be linked with the available data via a functional relation, which however is unknown, as motivated above; we are then back to the discussion in the previous paragraph.
4. Case study
Unravelling the nature of Dark Matter and Dark Energy is one of the major challenges of today’s science. While such is pursued, the gathering of empirical evidence for/against Dark Matter (DM) in individual real-life observed astronomical systems is a related interesting exercise.
The fundamental problem in the quantification of dark matter in these systems is that direct observational evidence of DM remains elusive. In light of this, the quantification is pursued using information obtained from measurable physical manifestations of the gravitational field of all matter in an astronomical system, i.e. dark as well as self-luminous matter. Indeed, such measurements are difficult and physical properties that manifest the gravitational effect of the total gravitational field of the system would include the density of X-rays emitted by the hot gas in the system at a measured temperature [30], velocities of individual particles that live in the system and play in its gravitational field [31-35] and the deviation in the path of a ray of light brought about by the gravitational field of the system acting as a gravitational lens [36].
The extraction of the density of DM from the learnt total gravitational mass density of all matter in the system, is performed by subtracting from the latter, the gravitational mass density of the self-luminous matter. The density of such luminous matter is typically modelled astronomically using measurements of the light that is observed from the system. A reliable functional relationship between the total gravitational mass density and such photometric measurements is not motivated by any physical theories though the literature includes such a relationship as obtained from a pattern recognition study performed with a chosen class of galaxies [37].
In this work, we focus our attention to the learning of the total gravitational mass density in galaxies, the images of which resemble ellipses―as distinguished from disc-shaped galaxies for which the sought density is more easily learnt using measurement of rotational speed of resident particles. By a galactic “particle” we refer to resolved galactic objects such as stars. There could also be additional types of particles, such as planetary nebulae (PNe) which are an end state of certain kinds of stars; these bear signature marks in the emitted spectral data. Other examples of galactic particles could include old clusters of stars, referred to as globular clusters (GCs).
Data
As defined above, the space of all states that a dynamical system achieves is referred to as the system’s state space . Now, the state that a galaxy is in, is given by the location and velocity coordinates of all particles in the system. Here, the location coordinate is
  as is the velocity coordinate vector
 . Thus, in our treatment of the galaxy at hand,
  is the space of the particle location and velocity vector i.e. the space of the vector
 . We model the galactic particles to be playing in the average (gravitational) force field that is given rise to by all the particles in this system. Under the influence of this mean field, we assume the system to have relaxed to a stationary state so that there is no time dependence in the distribution of the vector
 , where the 3-dimensional vector
  and
and . Then the pdf of the variable
  is
is , where
  is a parameter vector.
Our aim is to learn the density function of gravitational mass of all matter in the galaxy, given the data
 , where
 . The physical interpretation of these observables is that
  is the
component of the velocity of a galactic particle that is aligned along the line-of-sight that joins the particle and the observer, i.e. we can measure how quickly the particle is coming towards the observer or receding away but cannot measure any of the other components of . Similarly, we know the components
  and
and  of the location
  of a galactic particle in the galactic image but cannot observe how far orthogonal to the image plane the
particle is, i.e.  is unobservable. Thus
  but
but  with
with . It merits mention that in the available data, values of
  and
and  appear in the form of
 . Then the data
 .
.
Here  is typically of the order of 102. While for more distant galaxies,
  is lower, recent advancements is astronomical instrumentation allows for measurement of
  of around 750 planetary nebulae or PNe (as in the galaxy CenA, Woodley,
  Chakrabarty, under preparation). Such high a sample size is however more of an exception than the rule―in fact, in the real application discussed below, the number of
  measurements of globular clusters (or GCs) available is only 29. In addition, the measurements of
  are typically highly noisy, the data would typically sample the sub-space
  very sparsely and the data sets are typically one-time measurements. The proposed method will have to take this on board and incorporate the errors in the measurement of
 . Given such data, we aim to learn the gravitational mass density of all matter― dark as well as self-luminous―at any location
  in the galaxy.
5. Modelling real data
In the Bayesian framework, we are essentially attempting to compute the posterior of the unknown gravitational mass density function , given data
 . Since gravitational mass density is non-negative,
 . That we model the mass density to depend only on location
  is a model assumption1.
From Bayes rule, the posterior probability density of  given data
  is given as proportional to the product of the prior and the likelihood function, i.e. the probability density of
  given the model for the unknown mass density. Now, the probability density of the data vector
  given the model parameters
  is given by the probability density function
  of the observable
 , so that, assuming the
  data vectors to be conditionally independent, the likelihood function is the product of the pdfs of
  obtained at the
  values of
 :
:
![]() (9)
(9)
This is Equation (7) written in the context of this application. Given that , the pdf of
  is related to the pdf
  of the vector-valued variable
  as
as
![]() (10)
(10)
However, this formulation still does not include the gravitational mass density function  in the definition of
 , we explore the Physics of the situation to find how to embed
  into the definition of the pdf of the state space variable
 , and thereby into the likelihood. This is achieved by examining the time evolution of this pdf of the state space variable; we discuss this next.
5.1. Evolution of f(X,W) and Embeddin ρ(X) in it
Here we invoke the secondary equation that tells of the evolution of . In general, the pdf of the state space variable is a function of
 ,
,  and time
 . So the general state space pdf is expected to be written as
 , with
 . It is interpreted as the following: at time
 , the probability for
  and
and  for a galactic particle is
 . However, we assume that the particles in a galaxy do not collide since the galactic particles inside it, (like stars), typically collide over time-scales that are
  the age of galaxies [38]. Given this assumption of collisionlessness, the pdf of
  remains invariant. Thus, the evolution of
  must is guided by the Collisionless Boltzmann Equation (CBE):
 (11)
(11)
![]() (11)
(11)
This equation suggests that when the state space distribution has attained stationarity, so that ,
,
 is a constant
  at a given time. This is referred to as Jeans theorem [38]. In fact, the equation more correctly suggests that as long as the system has reached stationarity, at any given time,
  is a constant
  inside a well-connected region
 . Given this, the state space pdf can be written as a function of quantities that do not change with time2.
Theorem 5.1. Any function  is a steady-state or stationary solution of the Collisionless Boltzmann
Equation i.e. a solution to the equation  if and only if
  is invariant with respect to time, for all
 and
and  that lie inside a well-connected region
 .
.
Proof. The proof is simple; for the proof we assume  and
and  to take respective values of
  and
and  inside a well-connected sub-space of
 . Let a function of the vectors
 ,
,  be
be  such that it remains
a constant w.r.t. time. Then  Þ this function is a solution to the equation
 .
.
Let the equation  have a solution
 . This implies
 , i.e.
  is a constant with respect to time. For this to be true,
 . Therefore the solution to
  is a
is a
function of  and
and  that is a constant w.r.t. time.□
In fact, any function of a time-invariant function of vectors  and
and  is also a solution to the CBE.
Now, in our work we assume the system to have attained stationarity so that the pdf of the state space variable has no time dependence. Then the above theorem suggests that we can write  for any
 , where
  is any time-independent function of 2 vectors, for
 .
.
Now, upon eliciting from the literature in galactic dynamics [39,40] we realise the following.
・ The number  of constants of motion can be at most 5, i.e.
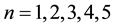 .
.
・ The pdf of the state space variable has to include particle energy , (which is one constant of motion), in its domain. Thus, we can write.
 .
.
・ Energy  is given as the sum of potential energy
  and kinetic energy
 , i.e.
![]() (12)
(12)
![]() (13)
(13)
![]() (14)
(14)
Here  is the Euclidean norm. That the potential is maintained as dependent only of the location vector
  and not on
  stems from our assumption that there is no dissipation of energy in this system, i.e. we model the galaxy at hand to be a Hamiltonian system. Here, a basic equation of Physics relates the potential of the galaxy to the gravitational mass density of the system, namely Poisson Equation:
![]() (15)
(15)
where
![]() (16)
(16)
 is the Laplace operator (in the considered geometry of the galaxy) and
  is a known constant (the Universal gravitational constant).
On the basis of the above, we can write
![]() (17)
(17)
![]() (18)
(18)
At this point we recall the form of an isotropic function of 2 vectors [41-43].
Remark 5.2. A scalar function  of two vectors
  and
and  is defined as isotropic with respect to any orthogonal transformation
  if
if . Here
 , the identity matrix and
 . Under any such orthogonal transformation
 , only the magnitudes of the vectors
  and
and ,
,
and the angle between them remain invariant, where the angle between  and
and  is
is . Therefore,
it follows that
 .
.
We also recall that in this application,  by construction.
This leads us to identify any pdf of the state space variable  as isotropic if the pdf is expressed as a function of energy
  alone. This follows from Equation 18 since
  Þ
Þ
![]() (19)
(19)
which is compatible with the form of isotropic functions as per Remark 5.2. Thus, if the pdf of the state space variable is dependent on only 1 constant of motion―which by the literature in galactic dynamics has to be energy ―then
―then  is an isotropic function of
  and
and .
.
However, there is no prior reason to model a real galaxy as having an isotropic probability distribution of its state space. Instead, we attempt to
・ use as general a model for the state space distribution of the system as possible,
・ while ensuring that the degrees of freedom in the model are kept to a minimum to ease computational ease.
This leads us to include another time-invariant function  in the definition of the pdf of the state space variable in addition to
 , such that the dependence on
  and
and  in
in  is not of the form that renders
  compatible with the definition of isotropic function, as per Remark 5.2, unlike
 .
.
This is so because
![]() (20)
(20)
where  represents the “cross-product” of the two 3-dimensional vectors
  and
and , i.e.
![]() (21)
(21)
so that
![]() (22)
(22)
Then, we set  which is not compatible with the form of an isotropic function of the 2 vectors
  and
and . In other words, if the support of the pdf of
  and
and  includes
  and
and , then the state space distribution is no longer restricted to be isotropic.
Such a general state space is indeed what we aimed to achieve with our model. At the same time, adhering to no more than 1 constant of motion in addition to energy  helps to keep the dimensionality of the domain of the pdf of the state space function to the minimum that it can be, given our demand that no stringent model-driven constraint be placed on the state space geometry. Thus, we use n = 2 in our model.
So now we are ready to express the unknown gravitational mass density function as embedded within the pdf of  and
and  as:
as:
![]() (23)
(23)
using Equation (20). To cast this in the form of Equation (3), we realise that the unknown gravitational mass density function will need to be discretised; we would first discretise the range of values of  over which the gravitational mass density function
  is sought. Let
  such that
  and let the width of each
  -bin be
 . Then
  is discretised as the unknown model parameter vector
![]() (24)
(24)
where
![]() (25)
(25)
where .
.
Then following on from Equation (23) we write
![]() (26)
(26)
This is in line with Equation (3) if we identify the function of the unknown model parameter vector  in the RHS of Equation (3) with the unknown gravitational mass density vector
 . Then the pdf of the state space variables
  and
and  depends of
  and
and  and
and . Then the equivalent of Equation (4) is
![]() (27)
(27)
 . Then plugging this in the RHS of Equation (1), the likelihood is
![]() (28)
(28)
Then to compute the likelihood and thereafter the posterior probability of  given data
 , we will need to compute the integral in Equation (27). According to the general methodology discussed above in Section 3, this is performed by discretising the domain of the pdf of the state space variable, i.e. of
 . In order to achieve this discretisation we will need to invoke the functional relationship between
  and
and . Next we discuss this.
5.2. Relationship between E(X,V) and L(X,V)
We recall the physical interpretation of  as the norm of the “angular momentum” vector, i.e.
is the square of the speed  of circular motion of a particle with location
  and velocity
 ; here, “circular motion” is motion orthogonal to the location vector
 , distinguished from non-circular motion that is parallel to
  and the speed of which is
 . Then as these two components of motion are mutually orthogonal, square of the particle's speed is
![]() (29)
(29)
where  is the magnitude of the component of
  that is parallel to
 , i.e.
![]() (30)
(30)
But we recall that energy
 .
.
This implies that
![]() (31)
(31)
where in the last equation, we invoked the definition of  sing Equation (22).
At this stage, to simplify things, we consciously choose to work in the coordinate system in which the vector
 is rotated to vector
  by a rotation through angle
 , i.e.
![]() (32)
(32)
Then by definition,  , i.e. the projection of the
  vector on the
  plane lies entirely along the
  -axis.
This rotation does not affect the previous discussion since
・ the previous discussion invokes the location variable either via ,
,
・ or via  as within the data structure:
 .
.
Having undertaken the rotation, we refer to  and
and  as
as  and
and  res- pectively.
This rotation renders the cross-product in the definition of  simpler; under this choice of the coordinate system, as
![]() (33)
(33)
where
![]() (34)
(34)
so that , so that in this rotated coordinate system, from Equation (31)
![]() (35)
(35)
Also, the component of  along the location vector
  is
is .
.
From Equation (31) it is evident that for a given value  of
of , the highest value
  of
of  is attained if
  (all motion is circular motion). This is realised only when the radius
  of the circular path of the particle takes a value
  such that
![]() (36)
(36)
The way to compute  given
given  is defined in the literature [38] as the positive definite solution for
  in the equation
![]() (37)
(37)
We are now ready to discretise the domain of the pdf of the state space variable, i.e. of  in line with the general methodology discussed above in Section 3 with the aim of computing the integral in Equation (27).
5.3. Discretisation of f(E,L)
We discretise the domain of  where this 2-dimensional domain is defined by the range of values
  and
and , by placing a uniform 2-dimensional rectangular grid over
  such that the range
  is broken into E-bins each
  wide and the range
  is broken into
  -bins each
  wide. Then each 2-dimensional
  -grid cell has size
 . Then,
![]() (38)
(38)
where the number of E-bins is  and the number of L-bins is
 .
.
We then define the  -dimensional matrix
![]() (39)
(39)
In our model this is the discretised version of the pdf  of the state space variable
 .
.
In this application, a particle with a positive value of energy is so energetic that it escapes from the galaxy. We are however concerned with particles that live inside the galaxy, i.e. are bound to the galaxy and therefore, the maximum energy that a galactic particle can attain is 0, i.e. . Given the definition of energy
  we realise that the value of
  is minimum, i.e. as negative as it can be, if
 , (i.e. velocity is zero) and
  is minimum, which occurs at
 . In other words, the minimum value of
  is
is  which is negative. In our work we normalise the value
  of
of  by
by , so that
 . In other words, the aforementioned
  and
and .
.
We normalise the value  of
of  with the maximal value
  that
that  can attain for a given value
  of
of  (Equation (36)). The maximum value that can be attained by
  is for
 ; having computed
  from Equation (37),
  is computed. Then, as normalised by
 , the maximal value of
  is 1. Also the lowest value of
  is 0, i.e.
 . In light of this, we rewrite Equation (38) as
![]() (40)
(40)
The E-binning and L-binning are kept uniform in the application we discuss below, i.e.  and
and  are constants.
Data-driven binning
There are  L-bins and
  E-bins. Above we saw that as the range covered by normalised values of
  is
is , the relationship between
  and E-bin width
  is
is . We make inference on
  within our inference scheme while the Physics of the situation drives us to a value of
 . It could have been possible to also learn
  from the data within our inference scheme but that would have been tantamount to wastage of information that is available from the domain of application.
We attempt to learn  from the data within our inference scheme; for a given
 ,
,  is fixed by the data at hand. To understand this, we recall the aforementioned relation
 . Let in the available data set,
1) the minimum value of  be
be ,
,
2) the maximum value of  be
be  so that the value of
  is no less than
 ,
,
3) the maximum value of  be
be  so that the unnormalised value of
  is no less than
![]() (41)
(41)
4) and the unnormalised  is no more than
 .
.
Thus, it is clear that the E-binning should cover the interval beginning at a normalised value of −1 and should at least extend to .
.
Then we set E-bin width  and learn number of L-bins,
  , from the data within our inference scheme. Then at any iteration, for the current value of
  and the current
  (which leads to the current value of
  according to Equation (16)), placing
  at the centre of the
  -th E-bin gives us
![]() (42)
(42)
i.e. .
.
Experiments suggest that for typical galactic data sets,  between 5 and 10 implies convergence in the learnt vectorised form of the gravitational mass density
 . This leads us to choose a discrete uniform prior over the set
 , for
, for :
:
![]() (43)
(43)
Again, the minimum and maximum values of  in the data fix
  and
and  respectively, so that
 . The radial bin width
  is entirely dictated by the data distribution such that there is at least 1 data vector in each radial bin. Thus,
  and
and  are not parameters to be learnt within the inference scheme but are directly determined by the data.
5.4. Likelihood
Following Equation (7), we express the likelihood in this application in terms of the pdf of  and
and , marginalised over all those variables that we do not have any observed information on. Then for the data vector
 , the marginal pdf is

where

 ,
,
with  recalled from Equation 33, and we have used
![]() (44)
(44)
and .
.
Then given that the range of values of  and
and  is discretised, we write
![]() (45)
(45)
where  refer to the values taken by
  for a given
 , inside the cd-th
  -grid-cell. Similarly,
  and
and  refer to the values of
  and
and  inside the cd-th
  -grid-cell respectively, given
 .
.
Indexing the values of any of the unobserved variables in this grid-cell as conditional on , is explained as follows.
 ,
,  and
and  are determined by the mapping between the space of
  and
and  and the space of the unobservables, namely
 . This mapping involves the definition of
  and
and  in terms of the state space coordinates
 , which in turn depends upon the function
  or its discretised version,
 . Hence the values taken by any of the 3 unobservables in the cd-th
  -grid-cell depend on
 . Here
  and
and .
.
We realise that the integral on the RHS of Equation (45) represents the volume occupied by the  - grid-cell inside the space of the unobserved variables. The computation of this volume is now discussed.
5.5. Volume of any E-L-grid-cell in terms of the unobservables
We begin by considering the volume of any  -grid-cell in the space of the 2 observables,
  and
and , at a given value of
 . Thereafter, we will consider the values of the 3rd unobservable,
  , in this grid-cell.
The definition  (Equation refeqn:ljhamela) implies that for the k-th data vector
 , all particles with
  and energy
  will obey the equation
![]() (46)
(46)
i.e. for , all particles lying in the c-th E-bin will lie in the space of
  and
and , within a circular annulus that is centred at (0,0) and has radii lying in the interval
  where
where
![]() (47)
(47)
For , the definition
 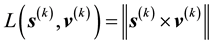 provides a representation for all particles in the d-th L-bin with given observed values of
 ,
,  and
and .
.
It then follows from , (Equation (33)) that for the k-th
data vector, all particles with , and in the d-th L-bin
  will obey the equation
![]() (48)
(48)
where we have recalled  from Equation (44). This implies that for
 , all particles lying in the d-th L-bin, will lie in the space of
  and
and , along an ellipse centred at
  with semi-minor axis
lying in the interval of  and semi-major axis lying in the interval
 . Here,
![]() (49)
(49)
Collating the implications of Equation (46) and Equation (48), we get that at a given value of , particles with observed data
 , (with energies) in the c-th E-bin and (momenta) in the d-th L-bin will lie in the space of
  and
and , within an area bound by the overlap of
1) the circular annular region centred at , extending in radii between
  and
and .
.
2) the elliptical annular region centred at , extending in semi-minor between
  and
and
 and semi-major axis in
 , where
 .
.
The area of these overlapping annular regions represents the volume of the cd-th  -grid-cell in the space of
  and
and , at the value
  of
of . Thus, the first step towards writing the volume of the cd-th
  - grid-cell in terms of the unobservables, is to compute the area of these overlapping annular regions in the space of
  and
and . Such an area of overlap is a function of
 . At the next step, we integrate such an area over all allowed
 , to recover the volume of the cd-th
  -grid-cell in the space of
 ,
,  and
and , i.e. the integral on the RHS of Equation (45).
There can be multiple ways these annular regions overlap; three examples of these distinct overlapping geometries are displayed in Figure 1. In each such geometry, it is possible to compute the area of this region of overlap since we know the equations of the curves that bound the area. However, the number of possible geometries of overlap is in excess of 20 and identifying the particular geometry to then compute the area of overlap in each such case, is tedious to code. In place of this, we allow for a numerical computation of the area of overlap; this method works irrespective of the particulars of the geometry of overlap. We identify the maximum and minimum values of  allowed at a given value of
 , having known the equations to the bounding curves, and compute the area of overlap in the plane of
  and
and  using numerical integration.
This area of overlap in the plane defined by  and
and  is a function of
  since the equations of the bounding curves are expressed in terms of
 . The area of overlap is then integrated over all values that
  is permitted to take inside the cd-th
  -grid-cell. For any
  -grid-cell, the lowest value
  can take is zero. For
 , and
, and , the maximum value of
  is realised (by recalling Equation (35)) as the solution to the equation
![]() (50)
(50)
where  is the projection of
  along the
  vector (discussed in Section 5.2). Thus,
  is given by the inner product of
  and the unit vector parallel to
 :
:
![]() (51)
(51)
![]()
Figure 1. Figure showing 3 of the many ways of overlap between the contours drawn in the space of V1 and V2, at neighbouring values of E (the circular contours in red) and at neighbouring values of L (the elliptical contours in black).
where![]() . Under our choice of coordinate system, Equation (51) gives
. Under our choice of coordinate system, Equation (51) gives
![]() (52)
(52)
Using this in Equation (50) we get
![]() (53)
(53)
This implies that given the observations represented by the k-th data vector![]() ,
,
![]() (54)
(54)
The highest positive root for ![]() from Equation (54) as the highest value that
from Equation (54) as the highest value that ![]() can attain in the cd-th
can attain in the cd-th ![]() -grid-cell. Thus, for the cd-th cell, the limits on the integration over
-grid-cell. Thus, for the cd-th cell, the limits on the integration over ![]() are 0 and the solution to Equation (54).
are 0 and the solution to Equation (54).
So now we have the value of the integral over ![]() and
and ![]() and hereafter over
and hereafter over![]() , for the cd-th
, for the cd-th ![]() - grid-cell. This triple integral gives the volume of the cd-th
- grid-cell. This triple integral gives the volume of the cd-th ![]() -grid-cell in the space of the unobservables, i.e. of
-grid-cell in the space of the unobservables, i.e. of![]() . This volume is multiplied by the value
. This volume is multiplied by the value ![]() of the discretised pdf of the state space variable in this
of the discretised pdf of the state space variable in this ![]() cell and the resulting product is summed over all
cell and the resulting product is summed over all ![]() and
and![]() , to give us the marginalised pdf
, to give us the marginalised pdf ![]() (see Equation (45)). Once the marginalised pdf is known for a given
(see Equation (45)). Once the marginalised pdf is known for a given![]() , the product over all ks contributes towards the likelihood.
, the product over all ks contributes towards the likelihood.
5.6. Normalisation of the marginal pdf of the state space vector
As we see from Equation (45), the marginal pdf of ![]() and
and ![]() is dependent on
is dependent on![]() , so this normalisation will not cancel within the implementation of Metropolis-Hastings to perform posterior sampling. In other words, to ensure that the value of
, so this normalisation will not cancel within the implementation of Metropolis-Hastings to perform posterior sampling. In other words, to ensure that the value of![]() ―and therefore the likelihood―is not artificially enhanced by choosing a high
―and therefore the likelihood―is not artificially enhanced by choosing a high![]() , we normalise
, we normalise ![]() for each
for each![]() , by the pdf integrated over all possible values of
, by the pdf integrated over all possible values of![]() ,
, ![]() and
and![]() , i.e. by
, i.e. by
![]() (55)
(55)
where the possible values of ![]() are in the interval
are in the interval![]() , of
, of ![]() in the interval
in the interval ![]() and of
and of ![]() in
in![]() . Hereafter, by
. Hereafter, by ![]() we will imply the normalised marginal pdf.
we will imply the normalised marginal pdf.
5.7. Incorporating measurement uncertainties
Following Equation (8) the likelihood is defined as the product over all data, of the convolution of the error distribution at the k-th datum and value of the marginalised pdf for this ![]() (assuming the data to be conditionally iid). In this application the measurement of the location of the galactic particle projected onto the image plane of the galaxy, i.e.
(assuming the data to be conditionally iid). In this application the measurement of the location of the galactic particle projected onto the image plane of the galaxy, i.e.![]() , is constrained well enough to ignore measurement uncertainties in. However, the measurement errors in the line-of-sight component of the particle velocity,
, is constrained well enough to ignore measurement uncertainties in. However, the measurement errors in the line-of-sight component of the particle velocity, ![]() , can be large. This measurement error in
, can be large. This measurement error in ![]() is denoted as
is denoted as![]() . The distribution of this error is determined by the astronomical instrumentation relevant to the observations of the galaxy at hand and are usually known to the astronomer. In the implementation of the methodology to real and simulated data, as discussed below, we work with a Gaussian error distribution with a known variance
. The distribution of this error is determined by the astronomical instrumentation relevant to the observations of the galaxy at hand and are usually known to the astronomer. In the implementation of the methodology to real and simulated data, as discussed below, we work with a Gaussian error distribution with a known variance![]() . Thus,
. Thus,![]() . For this particular error distribution, the likelihood is defined as
. For this particular error distribution, the likelihood is defined as
![]() (56)
(56)
For any other distribution of the uncertainties in the measurement of![]() , the likelihood is to be rephrased as resulting from a convolution of
, the likelihood is to be rephrased as resulting from a convolution of ![]() and that chosen error distribution.
and that chosen error distribution.
5.8. Priors
In the existing astronomical literature, there is nothing to suggest the pdf of the state space variable in a real galaxy though there are theoretical models of the functional dependence between stellar energy (E) and angular momentum (L) and pdf of ![]() and
and ![]() [38]. Given this, we opt for uniform priors on
[38]. Given this, we opt for uniform priors on![]() ,
, ![]() ,
,![]() . However, in our inference, we will use the suggestion of monotonicity of the state space pdf, as given in the theoretical galactic dynamics literature. We also use the physically motivated constraint that
. However, in our inference, we will use the suggestion of monotonicity of the state space pdf, as given in the theoretical galactic dynamics literature. We also use the physically motivated constraint that![]() ,
,![]() . Thus, we use
. Thus, we use![]() , where
, where ![]() denotes the uniform distribution over the interval
denotes the uniform distribution over the interval![]() .
.
As far as priors on the gravitational mass density are concerned, astronomical models are available [38]. All such models suggest that gravitational mass density is a monotonically decreasing function of![]() . A nu- merically motivated form that has been used in the astrophysical community is referred to as the NFW density [44], though criticism of predictions obtained with this form also exist [45, among others]. For our purpose we suggest a uniform prior on
. A nu- merically motivated form that has been used in the astrophysical community is referred to as the NFW density [44], though criticism of predictions obtained with this form also exist [45, among others]. For our purpose we suggest a uniform prior on ![]() such that
such that
![]() (57)
(57)
i.e. ![]() is the gravitational mass density as given by the 2-parameter NFW form, for the particle radial location
is the gravitational mass density as given by the 2-parameter NFW form, for the particle radial location![]() ,
,![]() . In fact, this location is summarised as
. In fact, this location is summarised as![]() , the mid-point of the b-th radial bin.
, the mid-point of the b-th radial bin. ![]() and
and ![]() are the 2 parameters of the NFW density form. In our work these are hyperparameters and we place uniform priors on them:
are the 2 parameters of the NFW density form. In our work these are hyperparameters and we place uniform priors on them: ![]() and
and![]() , where these numbers are experimentally chosen.
, where these numbers are experimentally chosen.
5.9. Posterior
Given the data, we use Bayes rule to write down the joint posterior probability density of ![]() . This is
. This is
![]() (58)
(58)
where we used![]() ,
,![]() . Here, the factor
. Here, the factor ![]() is a
is a
constant and therefore can be subsumed into the constant of proportionality that defines the above relation.
We marginalise ![]() and
and ![]() out of
out of ![]() to achieve the joint posterior probability of
to achieve the joint posterior probability of![]() ,
, ![]() and
and ![]() given the data. The marginalisation involves only the term
given the data. The marginalisation involves only the term
![]()
(recalling Equation (57)). Integrating this term over a fixed interval of vales of ![]() and again over a fixed interval of
and again over a fixed interval of![]() , result in a constant that depends on
, result in a constant that depends on![]() ,
, ![]() and
and![]() . Thus the marginalisation only results in a constant that can be subsumed within the unknown constant of proportionality that we do not require the exact computation of, given that posterior samples are generated using adaptive Metropolis-Hastings [46]. Thus we can write down the joint posterior probability of
. Thus the marginalisation only results in a constant that can be subsumed within the unknown constant of proportionality that we do not require the exact computation of, given that posterior samples are generated using adaptive Metropolis-Hastings [46]. Thus we can write down the joint posterior probability of![]() ,
, ![]() and
and ![]() given the data as:
given the data as:
![]() (59)
(59)
We discuss the implemented inference next.
6. Inference
We intend to make inference on each component of the vector ![]() and the matrix
and the matrix![]() , along with
, along with![]() . We do this under the constraints of a gravitational mass density function
. We do this under the constraints of a gravitational mass density function ![]() that is non-increasing with
that is non-increasing with ![]() and a pdf
and a pdf ![]() of the state space variable that is non-increasing with
of the state space variable that is non-increasing with![]() . Motivation for these constraints is presented in Section 5.8. In other words,
. Motivation for these constraints is presented in Section 5.8. In other words, ![]() and
and ![]() for
for ![]() and
and![]() . Also, here
. Also, here ![]() and
and![]() .
.
First we discuss performing inference on ![]() using adaptive Metropolis-Hastings [46], while maintaining this constraint of monotonicity. We define
using adaptive Metropolis-Hastings [46], while maintaining this constraint of monotonicity. We define
![]() (60)
(60)
It is on the parameters ![]() that we make inference. Let within our inference scheme, at the n-th iteration, the current value of
that we make inference. Let within our inference scheme, at the n-th iteration, the current value of ![]() be
be![]() . Let in this iteration, a candidate value
. Let in this iteration, a candidate value ![]() of
of ![]() be proposed from the folded normal density
be proposed from the folded normal density![]() , i.e.
, i.e.
![]() (61)
(61)
where the choice of a folded normal [47] or truncated normal proposal density is preferred over a density that achieves zero probability mass at the variable value of 0. This is because there is a non-zero probability for the gravitational mass density to be zero in a given radial bin. Here ![]() and
and ![]() are the mean and variance of the proposal density that
are the mean and variance of the proposal density that ![]() is proposed from. We choose the current value of
is proposed from. We choose the current value of ![]() as
as ![]() and in this adaptive inference scheme, the variance is given by the empirical variance of the chain since the
and in this adaptive inference scheme, the variance is given by the empirical variance of the chain since the ![]() -th iteration, i.e.
-th iteration, i.e.
![]() (62)
(62)
We choose the folded normal proposal density given its ease of computation:
![]() (63)
(63)
It is evident that this is a symmetric proposal density. We discuss the acceptance criterion in this standard Metropolis-Hastings scheme, after discussing the proposal density of the components of the matrix ![]() and the parameter
and the parameter![]() .
.
If ![]() is accepted, then the updated b-th component of
is accepted, then the updated b-th component of ![]() in the n-th iteration is
in the n-th iteration is![]() . If the proposed candidate is rejected then
. If the proposed candidate is rejected then ![]() resorts back to
resorts back to![]() .
.
Along similar lines, we make inference directly on
![]() (64)
(64)
Let in the n-th iteration, the current value of ![]() be
be ![]() and the proposed value be
and the proposed value be ![]() where the
where the
proposed candidate is sampled from the folded normal density ![]() where the variance
where the variance ![]()
is again the empirical variance of the chain between the ![]() -th and the
-th and the ![]() -th iteration. Then the updated general element of the state space pdf matrix in this iteration is
-th iteration. Then the updated general element of the state space pdf matrix in this iteration is![]() , if the proposed value as accepted, otherwise,
, if the proposed value as accepted, otherwise,![]() . Thus, the proposal density that a component of the
. Thus, the proposal density that a component of the ![]() matrix is proposed from is also symmetric.
matrix is proposed from is also symmetric.
We propose ![]() from the discrete uniform distribution, i.e. the proposed value of
from the discrete uniform distribution, i.e. the proposed value of ![]() in the n-th iteration is
in the n-th iteration is
![]() (65)
(65)
where the bounds of the interval ![]() are found experimentally given the data at hand.
are found experimentally given the data at hand.
Given that we are making inference on the ![]() and
and![]() , we rephrase the posterior probability of the unknowns as
, we rephrase the posterior probability of the unknowns as![]() . This posterior density is proportional to the
. This posterior density is proportional to the
RHS of Equation (59).
Then given that the proposal densities that components of ![]() and of
and of ![]() are sampled from and that the proposal density for
are sampled from and that the proposal density for ![]() is uniform. The Metropolis-Hastings acceptance ratio is reduced to the ratio of the posterior of the proposed state space vector value to that of the current state space vector, i.e. the proposed state space vector
is uniform. The Metropolis-Hastings acceptance ratio is reduced to the ratio of the posterior of the proposed state space vector value to that of the current state space vector, i.e. the proposed state space vector ![]() is accepted if
is accepted if
![]() (66)
(66)
where the uniform random variable![]() .
.
7. Illustration on synthetic data
In this section we illustrate the methodology on synthetic data set simulated from a chosen models for the pdf of![]() .
.![]() . The chosen models for this pdf are
. The chosen models for this pdf are ![]() or
or ![]() and
and![]() . These are given by:
. These are given by:
![]() (67)
(67)
where ![]() with
with ![]() chosen in both models for the state space pdf to be
chosen in both models for the state space pdf to be![]() . Here the model parameters
. Here the model parameters ![]() and
and ![]() are assigned realistic numerical
are assigned realistic numerical
values. From these 2 chosen pdfs, ![]() values of
values of ![]() were sampled; these 2 samples constituted the 2 synthetic data sets
were sampled; these 2 samples constituted the 2 synthetic data sets ![]() and
and![]() . The learnt gravitational mass density parameters and discretised version of the state space pdf are displayed in Figure 2. Some of the convergence characteristics of the chains are explored in Figure 3. The trace of the joint posterior probability of the unknown parameters given the data is shown along with histograms of
. The learnt gravitational mass density parameters and discretised version of the state space pdf are displayed in Figure 2. Some of the convergence characteristics of the chains are explored in Figure 3. The trace of the joint posterior probability of the unknown parameters given the data is shown along with histograms of ![]() learnt from 3 distinct parts of the chain that is run using data
learnt from 3 distinct parts of the chain that is run using data![]() .
.
8. Illustration on real data
In this section we present the gravitational mass density parameters and the state space pdf parameters learnt for the real galaxy NGC3379 using 2 data sets ![]() and
and ![]() which respectively have sample size 164 [48] and 29 [49]. An independent test of hypothesis exercise shows that there is relatively higher support in
which respectively have sample size 164 [48] and 29 [49]. An independent test of hypothesis exercise shows that there is relatively higher support in ![]() for an isotropic pdf of the state space variable
for an isotropic pdf of the state space variable ![]() than in
than in![]() . Given this, some runs were performed using an isotropic model of the state space pdf; this was achieved by fixing the number
. Given this, some runs were performed using an isotropic model of the state space pdf; this was achieved by fixing the number ![]() of L-bins to 1. Then
of L-bins to 1. Then ![]() identically takes the value
identically takes the value ![]() and is rendered a constant. This effectively implies that the domain of
and is rendered a constant. This effectively implies that the domain of ![]() is rendered uni-dimensional, i.e. the state space pdf is then rendered
is rendered uni-dimensional, i.e. the state space pdf is then rendered![]() . Recalling the definition of an isotropic function from Remark 5.2, we realise that the modelled state space pdf is then an isotropic function of
. Recalling the definition of an isotropic function from Remark 5.2, we realise that the modelled state space pdf is then an isotropic function of ![]() and
and![]() . Results from chains run with such an isotropic state space pdf were overplotted on results from chains run with the more relaxed version of the pdf that allows for incorporation of anisotropy; in such chain,
. Results from chains run with such an isotropic state space pdf were overplotted on results from chains run with the more relaxed version of the pdf that allows for incorporation of anisotropy; in such chain, ![]() is in fact learnt from the data.
is in fact learnt from the data.
9. Discussions
In this work we focused on an inverse problem in which noisy and partially missing data on the measurable ![]() is used to make inference on the model parameter vector
is used to make inference on the model parameter vector ![]() which is the discretisation of the unknown model function
which is the discretisation of the unknown model function![]() , where
, where ![]() is an orthogonal transformation of
is an orthogonal transformation of ![]() and
and![]() . The measurable is an unknown function of the sought function. Given that the very Physics that connects
. The measurable is an unknown function of the sought function. Given that the very Physics that connects ![]() to
to ![]() is unknown―where
is unknown―where![]() ―we cannot construct training data, i.e. data comprising a set of computed
―we cannot construct training data, i.e. data comprising a set of computed ![]() for a known
for a known![]() . In the absence of training data, we are unable to learn the unknown functional relationship between data and model function, either using splines/wavelets or by modelling this unknown function with a Gaussian Process. We then perform the estimation of
. In the absence of training data, we are unable to learn the unknown functional relationship between data and model function, either using splines/wavelets or by modelling this unknown function with a Gaussian Process. We then perform the estimation of ![]() at chosen values of
at chosen values of![]() , i.e. discretise the range of values of
, i.e. discretise the range of values of ![]() and estimate the vector
and estimate the vector ![]() instead, where
instead, where ![]() is the value of
is the value of ![]() for
for ![]() in the
in the ![]() -th
-th ![]() -bin. We aim to write the posterior of
-bin. We aim to write the posterior of ![]() given the data. The likelihood could be written as the product of the values of the
given the data. The likelihood could be written as the product of the values of the ![]() of the state space vector
of the state space vector ![]() achieved at each data point, but the data being missing, the
achieved at each data point, but the data being missing, the ![]() is projected onto the space of
is projected onto the space of ![]() and the likelihood is written in terms of these projections of the
and the likelihood is written in terms of these projections of the![]() .
. ![]() is embedded within the definition of the domain of the
is embedded within the definition of the domain of the ![]() of
of![]() . The projection calls for identification of the mapping between this domain and the unobserved variables
. The projection calls for identification of the mapping between this domain and the unobserved variables![]() ; this is an application specific task. The likelihood is convolved with the error distribution and vague but proper priors are invoked, leading to the posterior probability of the unknowns given the data. Inference is performed using adaptive MCMC. The method is used to learn the gravitational mass density of a simulated galaxy using synthetic data, as well as that in the real galaxy NGC3379, using data of 2 different kinds of galactic particles. The gravitational mass density vector estimated from the 2 independent data sets are found to be distinct.
; this is an application specific task. The likelihood is convolved with the error distribution and vague but proper priors are invoked, leading to the posterior probability of the unknowns given the data. Inference is performed using adaptive MCMC. The method is used to learn the gravitational mass density of a simulated galaxy using synthetic data, as well as that in the real galaxy NGC3379, using data of 2 different kinds of galactic particles. The gravitational mass density vector estimated from the 2 independent data sets are found to be distinct.
The distribution of the gravitational mass in the system is indicated by the function![]() .
.
the discretised form of this function defines the parameters![]() ,
,![]() . These are computed using the learnt value of the
. These are computed using the learnt value of the ![]() parameters and plotted in Figure 4. We notice that the estimate of
parameters and plotted in Figure 4. We notice that the estimate of ![]() can depend on the model chosen for the state space pdf; thus, the same galaxy can be inferred to be characterised by a higher gravitational mass distribution depending on whether an isotropic state space is invoked or not. Turning this result around, one can argue that in absence of priors on how isotropic the state space of a galaxy really is, the
can depend on the model chosen for the state space pdf; thus, the same galaxy can be inferred to be characterised by a higher gravitational mass distribution depending on whether an isotropic state space is invoked or not. Turning this result around, one can argue that in absence of priors on how isotropic the state space of a galaxy really is, the
learnt gravitational mass density function might give an erroneous indication of how much gravitational mass there is in this galaxy and of corse how that mass is distributed. It may be remarked that in lieu of such prior knowledge about the topology of the system state space, it is best to consider the least constrained of models for the state space pdf, i.e. to consider this pdf to be dependent on both ![]() and
and![]() .
.
It is also to be noted that the estimate for the gravitational mass density in the real galaxy NGC3379 appears to depend crucially on which data set is being implemented in the estimation exercise. It is possible that the underlying pdf of the variable ![]() is different for the sub-volume of state space that one set of data vectors are sampled from, compared to another. As these data vectors are components of
is different for the sub-volume of state space that one set of data vectors are sampled from, compared to another. As these data vectors are components of ![]() and
and ![]() of different kinds of galactic particles, this implies that the state space pdf that the different kinds of galactic particles relax into, are different.
of different kinds of galactic particles, this implies that the state space pdf that the different kinds of galactic particles relax into, are different.
NOTES
*Corresponding author.
![]()
1We assume that (the system is Hamiltonian so that) the gravitational potential of the galaxy is independent of velocities and depend only on location; since gravitational potential is uniquely determined for a given system geometry, by the gravitational mass density (via Poisson Equation), the latter too is dependent only on X.
![]()
2To be precise, the state space pdf should be written as a function of integrals of motion, which remain constant along the trajectory from one point in W to another, during the motion.