Monitoring Urban Spatial Growth in Harare Metropolitan Province, Zimbabwe ()
1. Introduction
Globally, the rapid increase in urbanization poses a number of challenges to urban planners and policy makers [1,2]. It is estimated that more than five billion people will be living in urban areas by 2030, of which 80% of these will be inhabitants of urban areas in developing countries [3-5]. While Sub-Saharan Africa is the least urbanized region, its urban population is increasing rapidly than other regions of the world [6-8]. To date, most urban areas in Sub-Saharan Africa are confronted with problems such as rapid population growth, increasing rural-urban migration, proliferation of informal settlements and epidemics as well as environmental degradation [9,10]. In order to formulate sustainable urban development strategies in Sub-Saharan Africa, timely and up-to-date land use/cover information is required [11]. Although the need for accurate land use/cover information has long been recognized as a fundamental input for sustainable urban planning, efforts to produce or update existing land use/cover maps have been hampered by high cost of conducting conventional land use surveys as well as acquiring and processing aerial photographs [12]. However, the past decades have witnessed an increase in the use of medium-resolution satellite data for mapping urban land use/cover [2,13-15] since some of the data are relatively cheap or freely available.
Although medium-resolution satellite data have highlighted significant insights into urban land use/cover changes, previous studies revealed misclassification problems when commonly-used per-pixel maximum likelihood supervised and unsupervised algorithms are used for image classification [16,17]. This is mainly attributed to the heterogeneous nature of urban landscapes, where the juxtaposition of continuous and discrete elements as well as the existence of relatively small spatial size of surficial materials leads to spectral confusion and subpixel mixing [18-21]. Nonetheless, the remote sensing community has worked tirelessly to develop advanced classification techniques given the rapid advances in computer and satellite technology. Examples of advanced classification techniques include combining satellite images with ancillary data [22], incorporating structural and textural information [23,24], expert systems [21], hybrid methods that incorporate soft and hard classifications [16], use of normalized difference built-up index [25,26], neural networks [27], object-based classifications [15], and support vector machines [28-30].
While significant improvements in urban land use/ cover classification have been noted, most studies using advanced classification techniques have been conducted in developed countries, which are characterized by a highly developed urban built-up environment and wellplanned urban land use system. However, more studies are needed to reduce uncertainties in land use/cover classification [17,31], particularly in developing countries. For instance, some urban areas are generally characterized by unplanned urban expansion coupled with subsistence urban agriculture systems [32]. This poses numerous methodological challenges for urban land use/cover classifications, particularly for Harare metropolitan province, which is characterized by complex and contrasting spatial and socioeconomic development patterns. For example, similar spectral responses between built-up areas on the one hand, and bare vacant plots and agriculture areas on the other hand, have been observed to cause classification errors [33]. Nonetheless, recent studies have demonstrated the effectiveness of support vector machines (SVMs) for classifying land use/cover [30,34]. This is because SVMs are highly adaptable, non-parametric, and they require few training areas for classification [30,35].
The objective of this study was to map and analyze built-up and non-built-up cover in Harare metropolitan province. We used Landsat data for 1984, 2002, 2008 and 2013 to classify built-up and non-built-up cover, and a post-classification change detection technique to analyze land use/cover changes. This study area was selected because very little quantitative information exists on how much land has been converted to built-up areas despite the rapid population expansion in Harare metropolitan province. In addition, the processes and problems of urban growth in Harare are similar to those in other southern African metropolitan areas, particularly in former British colonies since they share common historical origins and planning principles [36].
2. Study Area
Harare metropolitan province comprises four districts namely, Harare Urban, Harare Rural, Chitungwiza and Epworth (Figure 1). The metropolitan province extends between approximately 17˚40' and 18˚00' south, and between 30˚55' and 31˚15' east, encompassing an area of
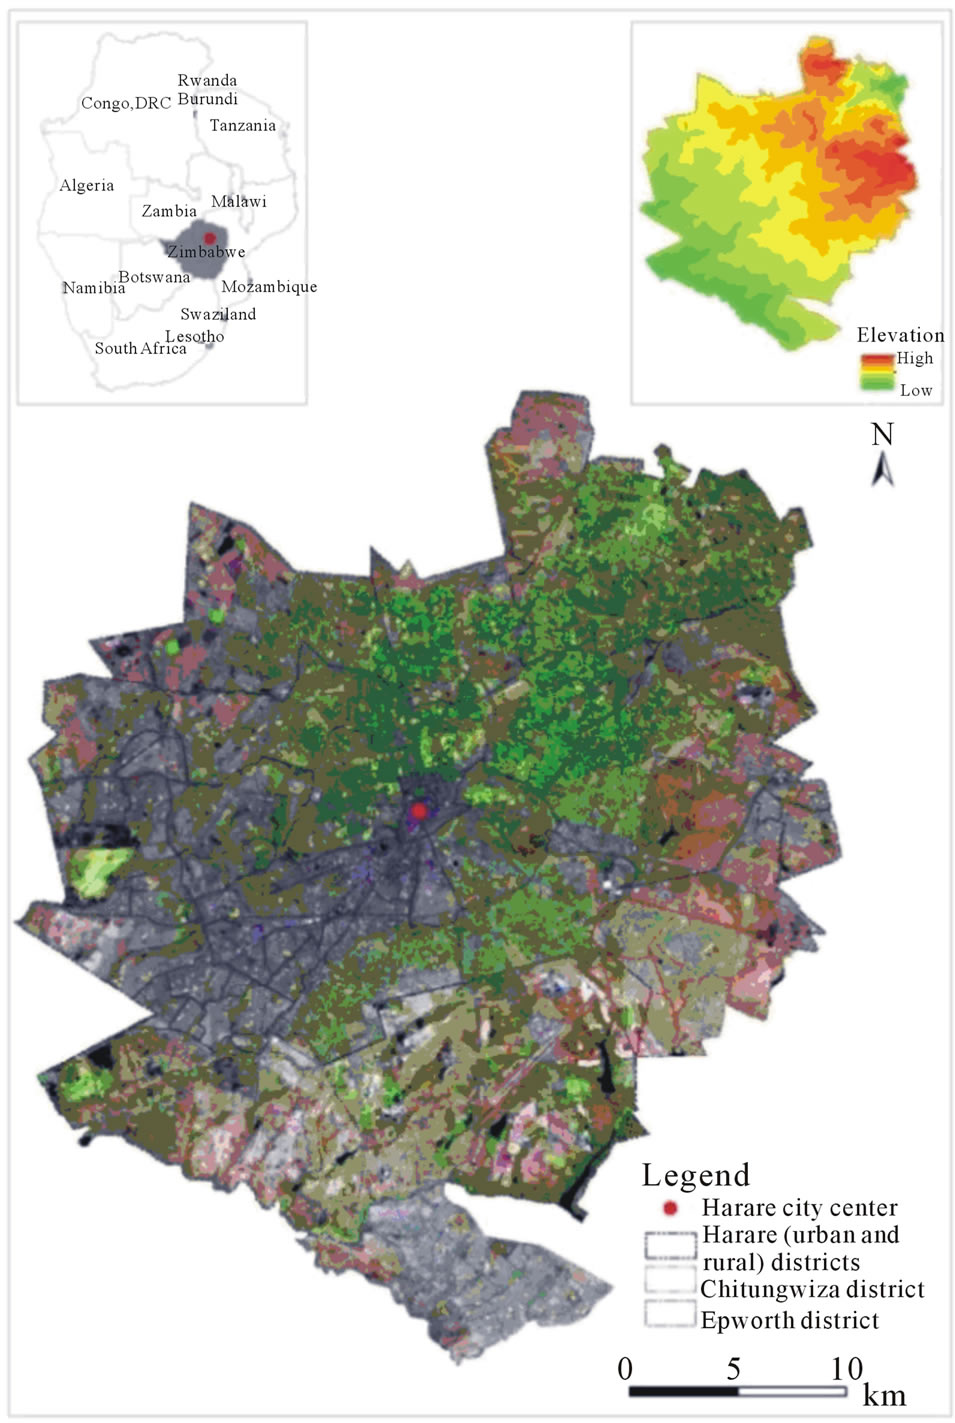
Figure 1. Location of the study area. District boundaries for Harare (Urban and Rural), Chitungwiza and Epworth are overlaid on Landsat 8 image in bands 5, 4, 3 (R,G,B) acquired on 6 June 2013.
about 942 km2. The average altitude is approximately 1500 m above sea level. The study area is characterized by a warm, wet season from November to April; a cool, dry season from May to August; and a hot, dry season in October. Daily temperatures range from about 7˚C to 20˚C in July (coldest month), and from 13˚C to 28˚C in October (hottest month). The study area receives a mean annual rainfall ranging from 470 mm to 1350 mm between November and March. Vegetation varies from grasslands to open Miombo woodlands dominated by Brachystegia spiciformis trees as well as some introduced tree species such as Jacaranda. The metropolitan province is dominated by a complex of: gabbro and dolerite to the north; an intrusion of metagreywacke and phylite in the centre; and granites to the east, and southwest. The underlying geology has a marked influence on the soils in the study area, which are mostly fersialitic and paraferrallitic soils [37]. Poorly drained areas occur in widespread vleis, which are mainly depressions with soils that are waterlogged during the rainy season.
Harare Urban district incorporates the City of Harare, which is the capital and largest city in Zimbabwe. The spatial structure of the City of Harare is characterized by a radial road network with the central business district (CBD) at its core, and the industrial areas to the east and south [33]. To the north and northeast are the spacious low density residential areas on plot sizes of about 1000 m2 or more, while to the extreme east, south, southwest and west are the high density residential areas on plot sizes of about 300 m2 [33]. In addition, some medium density residential measuring between 800 and 1000 m2 are found in the southern part of the study area. Pre-independence City of Harare was divided along racial lines, whereas post-independent was divided along socioeconomic divisions. Services and amenities in lowincome high density residential areas, where high population densities are located are poor and inadequate [36,38]. The population in Harare Urban district has been increasing at a fast rate since independence in 1980, when migration controls were removed [38,39]. The population in Harare Urban district increased from approximately 642,191 in 1982 to 1,435,784 in 2012, while the population in Harare Rural district increased from 16,173 to 23,023 over the same period [10,40,41].
Chitungwiza city, which lies approximately 25 km south of the city of Harare, was developed out of St Mary’s (formerly a settlement designated for missionary services and churches) and Seke townships in the early 1970s. The city was developed by the colonial government in order to locate residential areas for Africans far from the City of Harare. The population of Chitungwiza city expanded exponentially from approximately 15,000 in 1969 to 354,472 in 2012 [36,41]. Population expansion was mainly driven by people who migrated from the rural areas during the liberation struggle in the 1970s [9]. While Chitungwiza has commercial and industrial enterprises, most of its residents work in the City of Harare. Epworth, which is located in the south-east of the City of Harare is an unplanned and informal urban settlement that was formed by war refugees during the liberation struggle in the 1970s [10]. The population of Epworth expanded rapidly after independence as war refugees were joined by people who could not get accommodation in Harare [36]. Currently, the population of Epworth is estimated to be 161,840 [41]. The residents do not have access to most basic services such as access to clean water since Epworth is not under the administration of the City of Harare [36].
3. Methodology
The methodology used in this study comprised five major components, namely data acquisition, pre-processing, land use/cover classification, accuracy assessment and land use/cover change analysis. The following section gives details of the methodology used in this study.
3.1. Data
We acquired two Landsat 5 Thematic Mapper (TM) scenes, one Landsat Enhanced Thematic Mapper Plus (ETM+) scene and one Landsat 8 scene for land use/cover mapping (Table 1). Landsat 8 (originally called Landsat Data Continuity Mission) was launched on 11 February, 2013 as the eighth satellite in the Landsat program [42,43]. Landsat 8 consist of the Operational Land Imager (OLI) and the Thermal Infrared Sensor (TIRS) sensors, which provides images at a spatial resolution of 15 meters (panchromatic), 30 meters (visible, NIR, SWIR), and 100 meters (thermal) [42,43]. All Landsat image dates (1984, 2002, 2008 and 2013) were selected from cloud-free scenes acquired during the post-rainy season (winter and early summer). The selection of the Landsat image dates was based on the availability of corresponding reference data.The four Landsat scenes were geometrically corrected at the U.S. Geological Survey prior to downloading. Therefore, we resampled all Landsat scenes to 30 m for all bands (except the thermal and panchromatic) and georeferenced them to the Universal Transverse Mercator (UTM) map projection (zone 36 south). We did not perform atmospheric correction because the post-classification comparison approach adopted for land use/cover change analysis also compensates for variation in atmospheric conditions between dates since each land use/cover classification is performed independently [2,44,45].
Reference datasets were developed for classifier training and classification accuracy assessment for each epoch (1984, 2002, 2008 and 2013). Black and white aerial photographs at a scale of 1:25,000 acquired in 1984 were used as reference data for the 1984 land use/cover classification. These aerial photographs were obtained from the Department of the Surveyor-General, Zimbabwe. Given the retrospective nature of our study and the unavailability of updated aerial photographs for 2002, reference data for 2002 was developed from a variety of sources. The primary reference data was obtained from the street map of Harare (1:30,000) that was published in 2001. However, the street map of Harare is highly generalized and thus difficult to collect non-built-up reference data such as vegetation and bareland/agriculture. Therefore, additional secondary reference data for 2002 was collected

Table 1. Summary of Landsat images used.
from high-resolution images (e.g., Quickbird image) in Google EarthTM (http://earth.google.com) as well as panchromatic OrbView-3 image (at 1 m spatial resolution) that were acquired on 5 October 2003. The street map was obtained from the Surveyor-General Zimbabwe, while OrbView-3 image was downloaded from the U.S. Geological Survey website. The primary reference data for 2008 was obtained from Global Positioning System (GPS) points collected during the August 2008 field survey. In addition, we used AVNIR-2 image with a spatial resolution of 10 m acquired on 12 May 2008 as secondary reference data sources. The AVNIR-2 sensor, which has a ground coverage (swath width) at nadir of 70 km collects data in three visible wavelengths (0.42 - 0.50 μm, 0.52 - 0.60 μm, and 0.61 - 0.69 μm), and one near infrared wavelength (0.76 - 0.89 μm). Finally, primary reference data for 2013 was obtained from Global Positioning System (GPS) points collected in November 2012 as well as high-resolution images (acquired in 2013) from Google EarthTM.
3.2. Land Use/Cover Classification
An initial analysis of Landsat imagery and reference data (e.g., aerial photographs) revealed that the study area comprise a complex mosaic of urban, peri-urban, rural, vegetation and aquatic landscapes. Given the exploratory nature of the study and the focus on the expansion of built-up areas, we adopted three land use/cover classes (Table 2) based on the “Forestry Commission (Zimbabwe) and the Surveyor-General national cover classes” classification schemes as well as the author’s a priori knowledge of the study area.
An initial supervised maximum likelihood classification revealed serious misclassification problems, particularly for the built-up areas and bareland/agriculture areas. In order to improve classification, we used support vector machines (SVMs) since previous studies demonstrated their effectiveness for mapping urban areas [34,46,47], especially in areas where training data is limited as is the case of Harare. Support vector machines (SVMs) are machine-learning algorithms based on statistical learning theory [48], which perform classification by constructing hyperplanes in a multidimensional space [28,29]. The SVM algorithms were introduced by Boser et al. [49] and Vapnik [50] to solve supervised classification and regression problems. In general, SVMs select the decision boundary from an infinite number of potential ones, leaving the greatest margin between the closest data points to the hyperplane, which are referred to as “support vectors” [30,32,35]. SVMs employ a kernel function to transform the training data into higher dimensional feature space for non-linear classification problems [32]. In this regard, SVMs are considered to be a kernel method since kernel functions are used to maximize the

Table 2. Land use/cover classification scheme.
margin between classes. Therefore, the SVMs have ability to delineate multi-modal classes in high dimensional feature spaces [51-54]. In this study, training and classification procedures using SVMs were performed in ENVI 4.8 [55]. First, SVMs were calibrated and finetuned by changing the kernel functions (types) and regularization (penalty) parameter. Following trial calibration, the radial basis function was selected for classification since it had the best accuracy. After classification, a postclassification analysis based on visual check was performed in ERDAS Imagine 2011 [56] to remove conspicuous misclassifications.
3.3. Post-Classification Change Detection
A post-classification change detection technique that cross-tabulates one land use/cover map from one date (1984) with another date (2002) was used to analyze land use/cover changes in ArcGIS 10.1 [57]. The pixel by pixel nature of this change allows the analysis of both quantity and spatial distribution of land use/cover changes. While the post-classification change detection technique is simple and straightforward, the land use/ cover change results are sensitive to inconsistencies in satellite image interpretation and misclassification errors [58]. This is because errors in individual land use/cover classification maps will also be present in the final land use/cover change map [58].
4. Results and Discussion
4.1. Classification Accuracy Assessment
In this study, we used reference pixels for accuracy assessment, which were independent from the training area pixels used for land use/cover classification. A total of 200 sample points were collected as reference data for each year (1984, 2002, 2008 and 2013) based on a random sampling approach. Four measures of accuracy assessment namely, the producer’s accuracy (accounting for errors of omission), user’s accuracy (accounting for errors of commission), overall accuracy and overall kappa were computed to evaluate classification accuracy. Overall land use/cover classification accuracy levels for the four dates ranged from 89% to 95% with an overall kappa that ranged from 86% to 93% (Tables 3(a) and (b)).
Generally, class-specific accuracies were high for nonbuilt-up areas, while class-specific accuracies for built-up areas ranged from moderate to high. The producer’s accuracy for the built-up class ranged from 76.3% to 82.3%, while the user’s accuracy ranged from 80.3% to 96.7% over the study period (Tables 3(a) and (b)). The high user’s accuracy and low producer’s accuracy, particularly for the built-up class in 1984 indicate misclassification problems attributed to a number of factors. First, spectral confusion was observed between the built-up cover (that is, in newly developed high density residential areas) and the bareland/agriculture cover. This is because the two classes appear spectrally similar to the Landsat 5 TM sensor given the low object-to-background contrast [21,59]. As a result, high density residential built-up areas were misclassified as bareland/agriculture areas or vice versa. Second, it was difficult to classify the built-up class in low density residential areas at the spatial resolution of the Landsat sensor. This is because most of the houses in the low density residential areas (to the north and north-east of the city center) are partially or totally obscured by trees. Consequently, the built-up class was underestimated, which also explains the lower producer’s accuracy. While misclassifications were observed, our accuracy assessment results are relatively similar to those of Griffiths et al. [32], which indicates the effectiveness of SVMs for improving classification accuracy.
4.2. Land Use/Cover Change Analysis
Figure 2 shows maps depicting built-up and non-built-up classes for 1984, 2002, 2008 and 2013. Computed percentages of land use/cover classes show that in 1984, built-up and non-built-up areas occupied 12.6% (118.6 km2) and 87.3% (822.9 km2), respectively, while water areas occupied only 0.1% (0.7 km2) of the study area. However, significant spatial expansion in built-up and subsequent decreases in non-built-up areas was observed in 2002. Built-up areas increased to 24.8% (233.9 km2), while non-built-up areas decreased to 74.9% (705.6 km2) of the study areas. A slight increase of 0.3% (3.2 km2) in the spatial extent of water was also observed. Visual analysis of the 2008 land use/cover map revealed further increases in built-up areas, which occupied 32.1% (302.7 km2), while non-built-up areas decreased to 67.5% (636.1 km2) of the study areas. Water areas changed slightly to 0.4% (3.5 km2). For the 2013 land use/cover map, built-up and non-built-up areas occupied 36.3% (342.2 km2) and 63.4% (597 km2) of the study area. However, water areas occupied only 0.3% (3 km2) of the study area. Generally, built-up areas increased substantially from 12.6% to 36.3% between 1984 and 2013 (Figure 2). Similar land use/cover changes have been observed in