Comparative Study of the Impact of Corundum Particle Contaminants Size on Wear and Fatigue Life of Grease Lubricated Ball Bearings ()
1. Introduction and Theory Overview
Rolling element bearings are critical components of many modern engines and machinery. When bearings have been chosen correctly, handled, installed and maintained properly, their service life can be well predicted from their basic rating life L10 as it is calculated by their manufacturer. Usually the operating conditions are different from the ideal conditions on which the L10 life is based. In order to take into account these different operating conditions, the international standard ISO 281:2007 has moved towards a system approach of the bearing and has introduced the modified rating life Lnm which is based on the L10 life, the reliability modification factor a1 and the modification factor αISO which is a function of lubricating conditions, lubricant contamination, operating temperature and fitting stresses.
Most of the largest bearing manufacturers state that lubricant contamination is the major cause of bearing failure before they reach their rated life. Lubricant cleanliness is taken into account when calculating the rating life. The classification of lubricant cleanliness is based on the ISO 4406:1999 cleanliness code which is limited in filtrated oil lubrication systems. For grease lubricated bearings, which have a large market share, an equivalent grease cleanliness classification has not been established in detail.
Other aspects regarding the nature of particle contaminants such as size, hardness, brittleness and concentration levels have been investigated by researchers, but they have not been quantified.
In this paper we experimentally evaluate vibration signal analysis methods for bearings under different lubricant contamination conditions, which cause accelerated wear. Self-aligned, double row, ball bearings lubricated with hard steel particle pre-contaminated grease of two different particle sizes were tested. Vibration analysis is performed in the time and in the frequency domain in order to evaluate the accuracy of each indicator under these operating conditions and lubrication. At the end of the experiments the vibration analyses findings are compared with optical inspections of the bearings.
1.1. Basic Rating Life of Rolling Element Bearings
During their operating life, bearings are carrying loads which cause variable stresses to the contact surfaces. These Hertzian contact stresses are the main cause of fatigue, determining the useful operating life. This service life of rolling element bearings can be estimated based on the Weibull distribution and its application on bearings. Based on Weibull’s theory Palmgren and Lundberg [1] proposed that for a given probability n, the service life of bearing can be calculated from the equation below:
 (1)
(1)
where: Ln = Basic rating life (with a probability n).
Qc = Basic dynamic load.
Q = Actual load.
p = Constant.
Constant p is a function of the three constants c, e, h, regarding maximum shear stress exponents, Weibull slope and the type of the bearing. Several functions which correlate these constants have been proposed by researchers [2,3] based on different assumptions of the importance and the influence of each one. Regardless of the adopted theory, constant p has been experimentally approximated to the values 3 for ball bearings and 10/3 for roller bearings. Usually, the basic rating life L10 is used, expressing the expected life with 90% reliability. In addition, the basic dynamic radial Cr or axial Ca load is used in conjunction with the dynamic equivalent radial Pr or axial Pa load.
In practice, rolling element bearings show longer service lives than their basic rated L10 life when they operate under normal conditions. On the other hand, service lives are shorter when the operating conditions and especially temperature and lubricating conditions are worse. The need for calculating the expected service life under realistic, non-normal conditions led to the introduction of the modified rating life Lnm which takes into account these operating conditions and also provides results for probabilities different from 90%. According to ISO 281:2007 [4], the modified rating life Lnm of the bearings can be calculated from the equation below:
 (2)
(2)
where: α1 = Life modification factor for reliability.
αISO = Life modification factor, based on a systems approach of life calculation.
The life modification factor αISO is a function of the bearings operating conditions as it is shown in Equation (3).
 (3)
(3)
where: ec = Contamination factor.
Cu = Fatigue load limit.
P = Dynamic equivalent load.
κ = Viscosity ratio of the lubricant.
The contamination factor ec can be estimated based on some rough, simple guidelines regarding the lubrication conditions. The values of the factor have been found experimentally and they are given in relevant tables. Generally, life reduction caused by solid particles in the lubricant film is dependent on:
1) Type, size, hardness and quantity of the particles;
2) Lubricant film thickness and viscosity;
3) Bearing size and clearances.
The researches on bearings’ wear due to contaminants point to several possible mechanisms of wear [5,6]. In terms of contaminant sizes, Maru et al. [7] and Nikas et al. [8] state that the critical size is in the order of the lubrication film thickness as particles entrapped in the contact zone are causing local oil starvation, increased heating and material melting, while others report that when particles larger than the oil film thickness enter the contact zone, they cause stress peaks and permanent indentations in the raceway as they are over rolled. These stress peaks lead to a reduced life of the rolling bearing due to fatigue.
Usually the contaminants are larger than the typical lubricant film but rather small compared with the contact bodies. As they enter the contact zone it is difficult to move the bearing elements apart, so they are deformed. Ductile contaminants are rolled into pellets and brittle contaminants are crushed into fragments, as shown in Figure 1. The damage to the contact surfaces is controlled by the size of these deformed particles which in turn depends on the hardness of the ductile particles and the toughness of the brittle particles [9].
When brittle particles enter the contact zone they fracture down to a critical size. This critical size depends on the material toughness and this size is larger on materials with higher fracture toughness [10,11]. Brittle particles of low toughness cause small dents before their fracture to small fragments and these small dents have minimal interaction with the subsurface stresses which cause fatigue. Surface initiated cracking is more possible due to higher surface stresses on these cases.
On the other hand, particles of high toughness are causing larger dents and grooves when trapped in the contact zone before they fracture [12]. The size of these dents depends on the contact gap, counter surface velocities, fracture toughness, fragment size and contact surface hardness [6].
Denting is causing high stresses and the continuous over rolling is leading to a reduction in the fatigue life. The bearing life is found to be decreased by a factor of ten when brittle particles with high toughness have been
used [11]. Dents, grooves and surface deformation are causing abnormal operation of the bearing. When these faults are present the vibration signals from the bearing are increasing and with the proper analysis the size and the location of these faults can be identified.
1.2. Vibration Signal Analysis on Rolling Element Bearings
Rolling element bearings produce mechanical vibrations and noise as they rotate. When faults are present, these vibrations are increased as the motion of the rolling elements is more disturbed. These faults can be minor cracks or even spalls due to fatigue, denting, scuffing, scoring, wear, or any other kind of deformation of the contact surfaces. The vibration signal can be further processed in the time and in the frequency domain.
In time domain, data are processed with statistical and arithmetical methods. The most common values that are measured or calculated are [13,14]:
1) The minimum and the maximum amplitude (minmax).
2) The peak count.
3) Mean μ and standard deviation σ.
4) Root Mean Square (RMS).
5) The crest factor (peak to rms).
6) Statistical moments of higher order such as skewness S and kurtosis K.
Data which have been recorded in time domain are can easily be represented in the frequency domain with the use of a Fourier transformation. The most common Fourier transform method is the Discrete Time Fourier Transform (DTFT) which is calculated efficiently with the use of a Fast Fourier Transform (FFT) algorithm. In frequency domain various types of analyses can be performed such as spectral analysis, cepstrum analysis or bispectral analysis [15,16].
Certain faults and malfunctions exhibit signal peaks in characteristic frequencies. Faults in rolling element bearings produce signals in frequencies which depend on the geometrical characteristics of the bearing and the rotation frequency f.
Most studies regard experimental setups in laboratory conditions with minimum distortion and low noise to affect the measured signals. In most real life situations things are more complicated. Vibrations and noise are introduced into the signal due to angular and axial misalignment, shaft imbalance, improper support and fixings, electrical noise, transducer position, load variation. These parameters are limiting the use of time domain analysis as the magnitude of the measured signal is dominated mostly by noise rather than the measured characteristic. In these situations frequency domain analysis seems to present more useful results.
2. Experiments
2.1. Experimental Setup
The setup simulates a common industrial arrangement where a shaft is radially loaded on its free end. The schematic of the bearing test rig on which the experiments are carried out is shown in Figure 2, [17,18]. Three different types of bearings are used, having the same bore diameter. This selection has been made in order to use in each
housing bearings with different characteristic frequencies and as a result to have a clearer indication about the source of the measured vibration signal. All bearings have conical internal rings with a bore diameter of 35 mm and they are mounted on the shaft with the use of proper adapter sleeves.
Two Kistler type 8792A25T three-axial accelerometers are mounted with magnets on the top of the two plumper type housings. Visualization and processing of the signals is made through HBM CATMAN software installed on a Laptop PC. The naming of the axes is following the naming of the accelerometer’s axes which is: x for the axis of the shaft, z for the axis of the load direction and y for the axis vertical to the plane xz. Also, a K-type thermometer was used in order to measure the shaft, bearings and housings temperatures and the ambient temperature.
2.2. Pre-contaminated Grease
The pre-contaminated grease was made by mixing solid contaminant particles with clean grease. The grease used was SKF LGMT3 mineral oil based, lithium soap thickened grease with base oil viscosity of 120 - 130 mm2/s at 40˚C and 12 mm2/s at 100˚C. The solid particles which were used as contaminants were corundum particles with a hardness of about 2000 HV. Two samples with different particle size were used as shown on Table 1.
In order to achieve similar volumetric concentration of particles in the contaminated grease, a quantity of 0.75 cm3 of particles was mixed with 50 grams of clean grease. Most of the quantity used remains in the housing and only a small amount of grease is recirculating. The actual amount of particles which enter the contact zone is only a fraction of the used quantity.
2.3. Procedure of Experimentation
Two tests were conducted using the above configuration. At the beginning of the experiments the rear housing and the bearing was cleaned from the preservation oil and then the bearing was filled with clean grease. The same procedure has been followed for the front housing using one of the grease mixtures described above.
A load of 2800 N was applied to the flanged housing resulting in a load of 3500 N at the front bearing and a load of 700 N at the rear bearing. The motor and shaft rotation speed was set to 2400 rpm (40 Hz). The signal from six channels was recorded, corresponding to the three axes of each of the two accelerometers. The sampling rate was set to 2400 samples per second (sampling frequency) for each channel.
The duration of the experiments was 14 hours for each test, representing about 2 millions of revolutions. After the completion of each test, the front housing was opened and cleaned from the remaining grease. The bearing was dismantled and its parts were cleaned from the grease. After cleaning, the parts of each bearing were subjected to optical inspection with a LEICA stereoscope.
During the tests, the vibration signals from the accelerometers were monitored in real time and recorded All data were recorded and saved in. BIN type file format which can be further processed with Matlab software.
3. Data and Calculations
According to ISO 281:2007, the Lnm life of the tested bearings can be calculated from the Equations (1) and (2). For the applied load the L10 life of each bearing is calculated based on the manufacturer’s basic dynamic load. The results are given in Table 2.
For the modified basic rating life Lnm the life modification factor for reliability α1 equals to 1 for a 90% reliability. The life modification factor for system approach
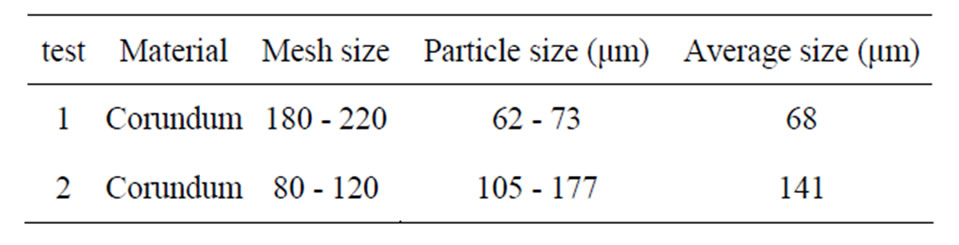
Table 1. Material and size table of the used contaminants.

Table 2. Loads and Basic Rating Life calculations for the all testing rig’s bearings.
αISO depends on the contamination factor ec, the fatigue load limit Cu, the actual load P and the viscosity ratio κ.
The contamination factor ec can be estimated from the given guidelines. The bearing’s pitch diameter d is about 54 mm and the viscosity ratio κ of the grease used at the test temperature of the bearings (65˚C) is about 3.5. For grease lubrication under high cleanliness, ec can be as high as 0.8 for the dimensions of the tested bearing (Pitch diameter d ≈ 54 mm) and for the viscosity ratio κ of 3.5. In severe contamination conditions, ec is in the range of 0.05 and in very severe contamination it tends to zero. The bearings manufacturer provides also an advanced method of calculating the rating life according to the size of the contaminants and their hardness. The results from these calculations are shown on Tables 3 and 4.
The characteristic bearing potential frequencies of each bearing can be calculated with the use of Equations (9)-(12). The dimensions of the bearings are required but instead, the manufacturer provides these values according to the operation speed. For the rotational speed of 2400 rpm (40 Hz) and for a contact angle of 0˚ the characteristic frequencies are given in Table 5.
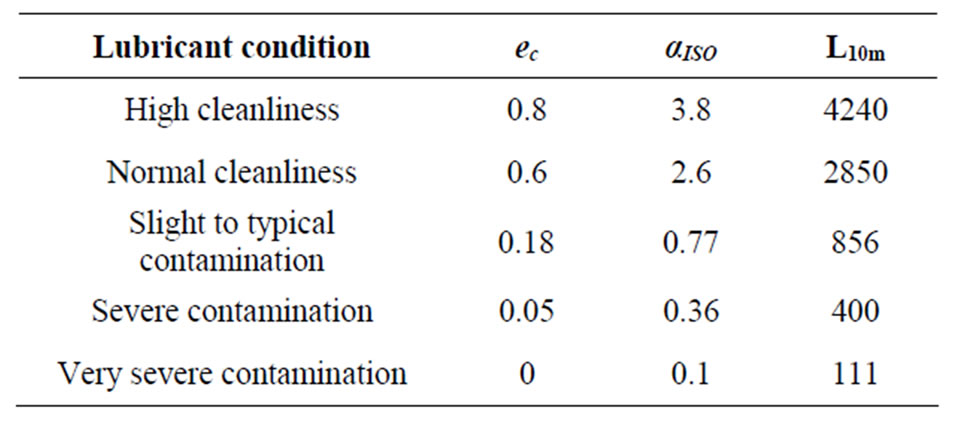
Table 3. Modified Rating Life calculations for various lubricant conditions for the tested bearing.

Table 4. Modified Rating Life calculations according to SKF.
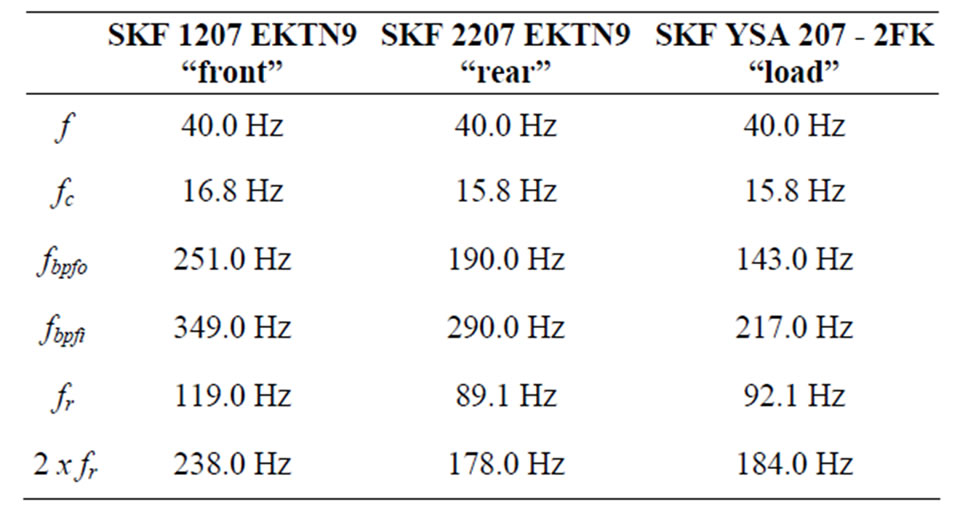
Table 5. Frequencies of potential damage in the tested ball bearings.
4. Experimental Results
The measured signals are processed in time domain and in frequency domain. The axes of greater importance are the x axis, which is the axis of the shaft and represents the axial loads of the bearing, and the z axis which is the axis of the applied radial load. The y axis, which is the axis vertical to the applied load, shows similar trends to the others but with much lower signal amplitudes.
4.1. Vibration Analysis in the Time Domain
Due to the numerous sources of vibrations as various particles enter the loading zone and the randomness of their nature, the statistical variables of higher order such as skewness and kurtosis do not give any useful results. The importance of these variables is grater when a fault appears on a bearing running under normal conditions. In these situations, the aforementioned variables, which normally show small fluctuation, will change significantly. Such behavior has been successfully reported by other researchers [13,14] when they created an artificial single point defect.
As it is shown in the plots of acceleration peaks and rms values in Figure 3, in the first test where the smaller particles were used, the amplitudes begin from lower levels compared with the second test. It is also clearly visible that the amplitude of the acceleration peaks and rms value is increasing on both cases. In the first test, the increase rate is much higher between the 6th and the 10th hour of operation. During that period, the amplitude of acceleration peaks increased from 5 g to 15 g on the x axis and from 1 g to 5 g on the z axis. Acceleration rms values increased too, from 2 g to 4 g on the x axis and from 0.25 g to 0.9 g on the z axis. After the 10th hour of operation, the increase rate was lower. In the second test, acceleration peaks and rms values increase with a constant rate, much slower than the first test.
The increasing acceleration amplitudes indicate that the failures are growing in size and the performance of the bearing is reduced. Generally, the overall acceleration measurement can indicate if there is an abnormal operation and if alarm levels are set, it can indicate potential failures.
4.2. Vibration Analysis in the Frequency Domain
The vibration analysis in the time domain can show a malfunction of the bearing only when it is affecting the vibration levels. The exact source of this malfunction is unknown and only assumptions can be made. In our case, the source of the increased vibrations could not be identified only from the vibration analysis results. Vibrations could be generated by particles entering randomly the contact zone, or by permanent deformations on the raceways. In the first case, vibrations do not follow a specific

Figure 3. Acceleration Peaks and RMS values using corundum particle contaminants.
pattern, but in the second case the amplitude of vibrations on the bearings potential damage frequencies, shown on Table 5, is increased.
Processing the acquired data in the frequency domain, results in the identification of the true source of the vibrations and in the detection of possible faults. Frequency spectrum plots of the obtained data are created by implementing a fast Fourier transform in Matlab software environment. In order to reduce the spectral leakage and make the dominant frequencies easier to be identified, the power spectrum is used, where the outputs of the FFT are raised to the square. The frequency spectra plots of the tests are shown in Figures 4 and 5. Five samples of each test data series are plotted. In the first test using smaller particle contaminants noticeable higher amplitude is occurring on both x and z axes, at the frequency of 251.2 Hz, which is the bearing’s potential damage frequency for the outer raceway, indicating a failure at this part. In the second test, using larger particles, peaks occur at the frequencies of 348.2 Hz and 388.1 Hz. The frequency at 348.2 Hz corresponds to the bearing’s potential damage frequency for the inner raceway but the frequency at 388.1 Hz does not match any of the characteristic frequencies shown on Table 5. This frequency seems to occur due to sliding of the balls relatively to the motion of the inner ring, which results in a higher rate of contact between a certain point of the inner ring and the balls, causing vibrations in higher frequency.
Other bearing characteristic frequencies can be identified when plotting the results of the Fourier transform without raising them to the square. When comparing them with the dominant frequencies mentioned above it is clearly that failures have occurred at the relevant parts.
The results of the frequency domain analysis conform to the results of the time domain analysis, indicating an increase of a fault at a certain location in each test. When both techniques are used a potential fault and its impact on the overall performance of the bearing can be identified.
4.3. Visual Inspection and Verification of Results
After the completion of the tests, the bearings were dismantled and cleaned from the greases. The bearing elements and the faults on them were photographed with the use of a stereoscope and a digital camera attached to it. The findings from the visual inspections are conforming to the results of the vibration analyses.
On both bearings the rolling marks on the raceways can be seen. Only small indentations exist, heavier in the second test where larger particles used (Figures 6 and 7). In the first test a significant deformation is visible at the points where the balls enter and leave the load zone. As abrasion mechanisms removed material from the race-

Figure 4. Frequency spectra plots of the test using corundum particles with average size of 68 μm.

Figure 5. Frequency spectra plots of the test using corundum particles with average size of 141 μm.

Figure 6. Light abrasion of the outer ring raceway with small indentations (test 1).
ways, the gap between the balls and the raceways on the unloaded zone increased. The inertia of the balls caused the deformation at the entrance and the exit of the load zone as it is shown in Figure 8. In this case balls were skidding and vibrating causing wave like deformation on the outer raceways (Figure 9).
The width of the affected contact zone is about 600 - 700 μm for both tests on the load zone and about 1 mm on the unloaded zone. The width of the affected contact area of the inner ring is about 2 mm, wider than that of the outer raceways due to the different curving. On the

Figure 7. Abrasion of the outer ring raceway with heavier indentations and particles imbedded in the contact area (test 2).
inner ring the surface on the contact zone has been polished and on the second test there is also some small scale pitting (Figures 10 and 11).
On the second test a deformation on the inner raceway is also visible in Figure 11. This groove is probably the failure indicated by the vibration analysis results on the frequency domain.
Generally, when the larger particles were used, the bearing seems to have rougher wear marks. The deformation of the raceways is not following the same pattern

Figure 8. Heavy abrasion with a noticeable different deformation at the point of entering the contact zone (test 1).

Figure 9. Abrasion of the outer ring raceway with a wave like deformation of the raceways (test 2).

Figure 10. Light wear on the inner raceways with polishing of the contact zone (test 1).
and cannot be correlated with the particle size. In both cases the deformations were significant and the total

Figure 11. Visible pitting on the raceways and a single fault in one of the two inner raceways (test 2).
damage seemed to be critical for the operation of the bearing.
5. Discussion
As brittle particles enter the contact zone they are smashed down to smaller fragments until a certain critical size depending on their fracture toughness. Due to the vortexes of the lubricant, new or already fragmented particles recirculate and they can reenter the contact zone in a different position. This particle recirculation is causing continuous abrasive wear.
Particles do not have exactly the same size, fracture toughness and brittleness and their behavior cannot be predicted precisely. It is expected that larger particles should cause heavier wear than smaller particles. The findings from the contacted tests showed that in both cases the wear was similar. Material from the raceways has been removed and deformations have occurred. Larger particles caused heavier indentations and material removed from the raceways has been melted and adhered to the side bands of the raceways due to excessive heat.
Generally, the vibration levels are increasing as wear and deformation of the raceways propagate. When using vibration analysis in the frequency domain it is possible to identify the main source of these vibrations. In the first test, where the smaller particles were used, the vibration amplitudes in the time domain and in the frequency domain reached higher levels compared to the second test. This finding was not expected but it was the result of a larger deformation on the entrance and exit of the balls in the load zone.
As the fragmentation rate of the particles depends on their fracture toughness and their initial size, it can be assumed that the two particle samples used in the experiments might not have the same fracture toughness. Some of the larger particles might have been more brittle and they smashed down to fragments of critical size easier. The distribution of fracture toughness among the particles is also important and it might not was the same either.
The vibration levels of the bearings and their overall performance on the test rig indicate that they have reached their useful operational life after less than 14 hours of operation in both cases. This service life is much lower than the calculated service life of 110 hours considering very severe contamination (ec = 0 and αISO = 0.1).
6. Conclusions
Measuring of vibration has an increasingly important role as a tool in assisting predictive and preventive maintenance. When monitoring rolling element bearings, both vibration analyses in the time domain and in the frequency domain can give useful results. The vibration analysis in the time domain can indicate if there is an abnormal operation of a bearing and show the trend of the amplitude increase. In the frequency domain, vibration analysis can indicate whether the increased vibrations are caused from a certain bearing defect or from external sources. The increase of the vibration amplitude on the characteristic frequencies of the bearing can also indicate the progress of that specific fault. In the case of grease contaminated with tough brittle particles, vibration analysis can indicate the severity of wear and monitor its progress.
From the findings of conducted tests it is concluded that the size of the contaminant particles has a minor role in the abrasive wear. As particle size in both cases is greater than the thickness of the lubrication film, they cause significant wear, deforming the bearings’ raceways by removing material. Even when they are smashed down to smaller fragments, they continue to cause wear as they recirculate within the lubricant and affect different areas. Although greater particles seem to cause heavier indentations, smaller particles are causing severe abrasive wear too. The fracture toughness of the particles is also important as it is possible that larger particles might have less fracture toughness than smaller particles due to different microcrystal structure.
It is difficult to establish an equation that describes and quantifies the wear progress involving the parameters of size and concentration levels of the tough brittle particles due to the stochastic nature of the wear mechanisms. The experimental useful life of the tested bearings was smaller than the life calculated according to ISO 281: 2007 considering the worst lubricating conditions, with the value of the contamination factor equal to zero, indicating that actual wear can reduce the bearing life even more. In order to establish new values for the contamination factor and the factor of ISO considering parameters such as particle size, brittleness and fracture toughness, a large number of further experiments are necessary.