Verification of Damage Detection Algorithm by Prototype Building Structure Test ()
1. Introduction
Safety related accidents of buildings and civil engineering structures have been reported all over the world. In particular, safety issues of social infrastructure such as bridges, tunnels, plants and skyscrapers are even more important in that they are public facilities that hundreds of thousands of people use a day. In Korea, a vertical vibration accident caused by resonance of 39-storied steel building occurred in 2011 [1], and more than 50 casualties occurred due to the collapse of the Seongsu Bridge in 1994. With the increasing importance of securing the safety of social infrastructure and optimum performance levels to prevent these accidents, a lot of attention has been concentrated about monitoring performance degradation due to structural defects and deterioration.
The Korea Institute of Construction Technology is developing an IT-based system that detects abnormal movement through diagnosis of endothelial and envelop and monitors surrounding environment at the same time for the safety management of buildings and large structures. This project aims to develop technologies to measure and evaluate the health and safety of structures, and its final goal is to secure the world-class performance of sensor system, promote safety management of high-tech buildings/large structures and achieve commercialization by developing technologies as follows: 1) various sensor technologies such as patch-type optical fiber sensor and capsule and implant-type wireless sensors with goal of improving measuring range; 2) stress detection and structure status evaluation technology; 3) high durability of sensors and low-power ultra compact smart structure sensor network hardware technology; 4) light-emitting sensor utilization technology and automatic crack extraction technology; 5) integrated management/control technology on the developed systems; and 6) technology for practical use that can effectively apply the developed systems to buildings/large structured. Figure 1 shows an overview of the project [2].
In relation to structure status evaluation technology of the project, a study for the development of structural health monitoring techniques using acceleration response data was carried out to monitor the health of large structures including buildings and implement early detection of risks. The acceleration response data was obtained through a shaking table test with a three-storied building model. Indicators for judgment of damages were defined using the obtained acceleration response data, and a technique to determine the presence of damages was developed by applying the indicators to the outlier analysis among unsupervised learning based pattern recognition methods.
When probability distribution was selected according to the distribution characteristics of indicators, threshold to determine the presence of damages was set based on the confidence interval of the probability distribution.
2. Health Monitoring Methodology Algorithm Based on Pattern Recognition
2.1. Overview of Health Monitoring Methodology Algorithm Based on Unsupervised Learning
A health monitoring methodology technique based on unsupervised learning is designed to extract the damage characteristics from acceleration data acquired and to estimate the damage index accordingly. First, structural response signals such as acceleration and strain are measured in the time domain. In general, since the measurement of the dynamic response of structures is made in the time domain, the signal in the time domain is measured. In addition, as the procedure to determine the structural status is done in the next stage for feature extraction and calculation of damage index, application of this algorithm is available regardless of the form of structural response (acceleration, strain, displacement, etc.).
Next, characteristics to determine the steady and damage state are extracted from the frequency domain and time domain of measured signals. Since the structural status is evaluated in accordance with feature extraction technique, sensitivity of evaluation on the abnormal behaviors is determined depending on which attributes to attract. Using extracted characteristics, damage index can be calculated through probabilistic techniques and energy-based techniques, which will be described in the next section.
A probability distribution pattern is obtained by organizing the calculated damage index in descending or ascending order. After fitting it into appropriate probability distribution, parameter values of the probability distribution such as expected value or variance according to the probability distribution of acquired damage index are estimated, and decision boundary is set using values that correspond to proper confidence levels. The damage index beyond the decision boundary is called outlier, and the case in which outlier is detected can be evaluated to have damage [3].
2.2. Calculation of Damage Index
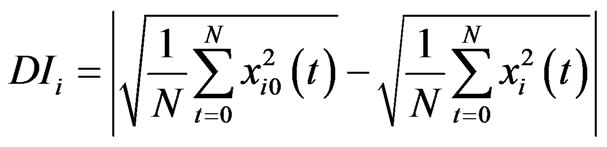
Damage characteristics are extracted from the obtained acceleration data and by using this data, damage index that represents damage characteristics quantitatively is calculated. In this study, the Root Mean Square (RMS) representing the amount of energy of the measured signals was used as shown in Equation (1). And the damage index was calculating by subtracting possible damage occurrence level, that is, RMS of signals obtained from the current state from RMS computed from the data obtained from the steady-state structures.
 (1)
(1)
Here, N represents the number of measures samples,  is time-domain acceleration signal measured from the i-th sensor in a steady state, xi(t) is time-domain acceleration signal which is currently measured in the i-th sensor. In case the structure is damaged, the energy amount of the measured acceleration response significantly increases or decreases compared to that of acceleration response in steady state. Accordingly, the damage characteristics can be extracted from the difference between the energy amount of steady state and that of damage state [4].
2.3. Determination of Threshold Using Generalized Extreme Value Distribution
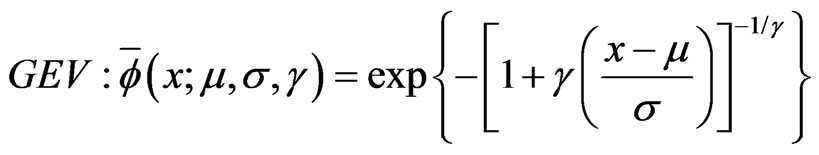
It is necessary to set an appropriate threshold value for determining the steady and damage state of structures after quantifying the damage characteristics through damage index. In this study, since the probability distribution of damage index derived from the obtained data is based on generalized extreme value distribution (GEV), the threshold is derived from confidence interval of the generalized extreme value distribution, which has the form of the cumulative distribution function and follows Equation (2).
 (2)
(2)
Here,  is represented, and
  represents position variable,
  scale variable, and
  type variable [5].
3. Verification of Health Evaluation Algorithm Based on Unsupervised Learning through Forced Vibration Tests
3.1. Analysis of Time-Domain Data
The target structure used in forced vibration tests for analysis of time-domain data is a three-storied building model as shown in Figure 2, and steel bracings of 1mm in thickness were fastened on four sides of each layer in the form of an X. As shown in Table 1, an experiment was conducted with a total of 9 cases, and data was measured 5 times per each case. Case 1 represents a state where all bracings are fastened, and this state is assumed to be a steady state. The damage was simulated by removing bracings. Cases from 2 to 4 represent a state where bracing of each floor from first to third floor is removed, cases from 5 to 7 represent a state where bracings of two floors are removed, and case 8 represents a case where all bracings of all floors are removed. The last case represents a case where all bracing are fastened, which is the same state with the first case, and it is the case for verification of reproducibility of the safety evaluation algorithm.
A total of six accelerometers (sensors 1 and 2 on the

Figure 2. 3-storied building model experiment.
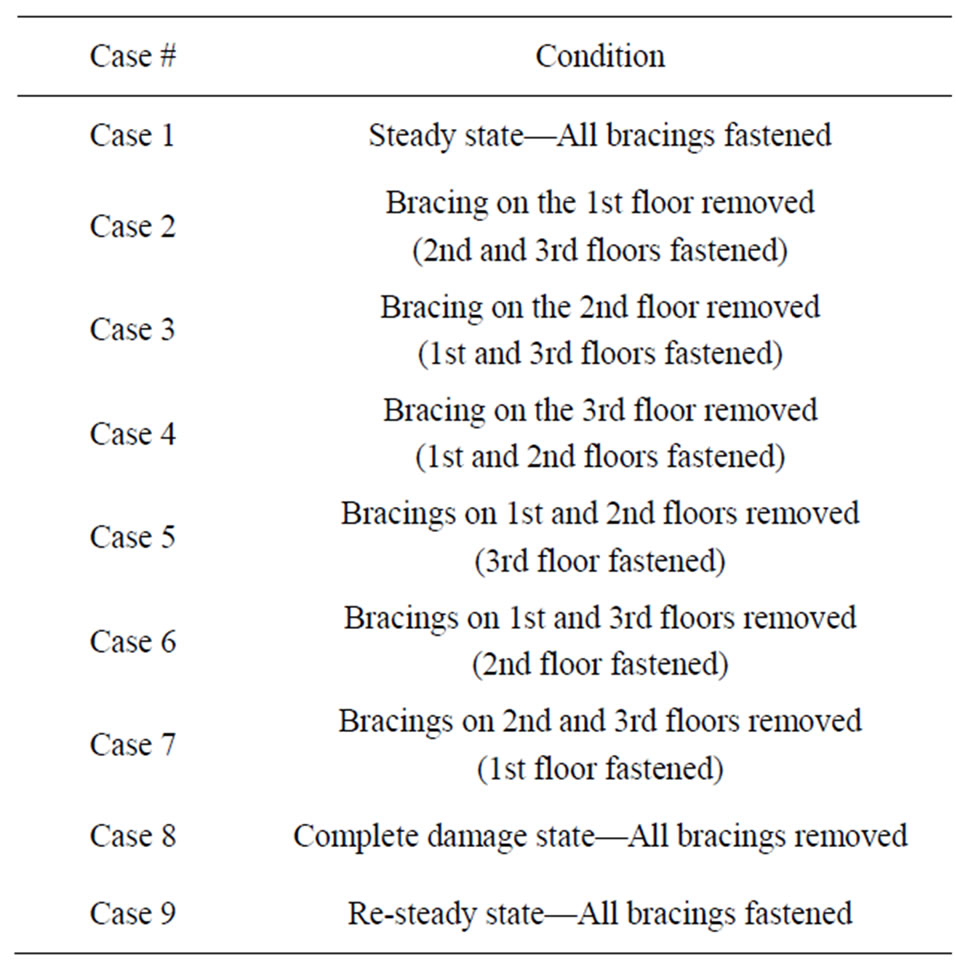
Table 1. Damage experiment scenarios.
first floor, 3 and 4 on the second floor, 5 and 6 on the third floor) were installed by attaching two sensors to different columns by each floor as shown in Figure 3. The input signal is a time-domain signal in a random form as shown in Figure 4, and ambient vibration was simulated by generating input signals in the similar form to seismic waves.
The wavelet transform was used to extract the characteristics of measured time-domain signals. In this study, since geometric pattern of the original signal is similar to that of Morlet wavelet as shown in Figure 5, Morlet wavelet was set as mother wavelet. After performing the wavelet transform, signal-to-noise ratio of the response signal was improved by extracting the interval in which frequency components are concentrated, which indicates that the accuracy of damage detection was improved by extracting only characteristic time-domain signal of the section.
In time-domain analysis techniques, extraction of characteristics to determine the steady or damage condi-
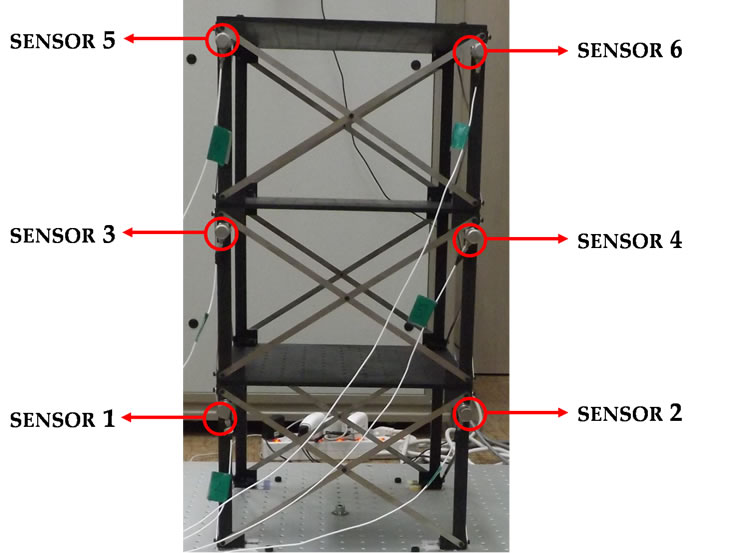
Figure 3. Sensor location in building model.
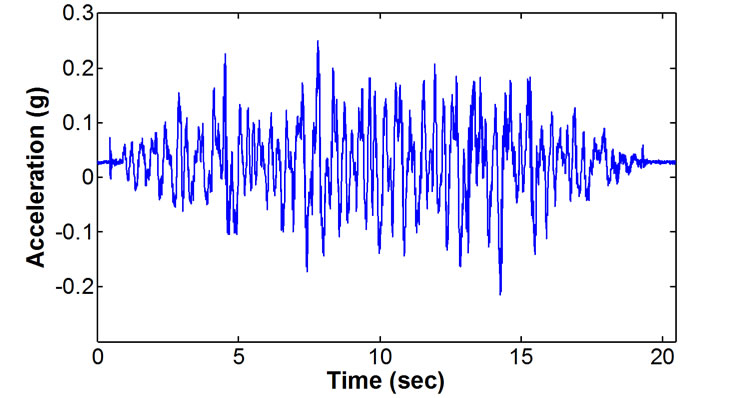
Figure 4. Artificial seismic wave input signal.
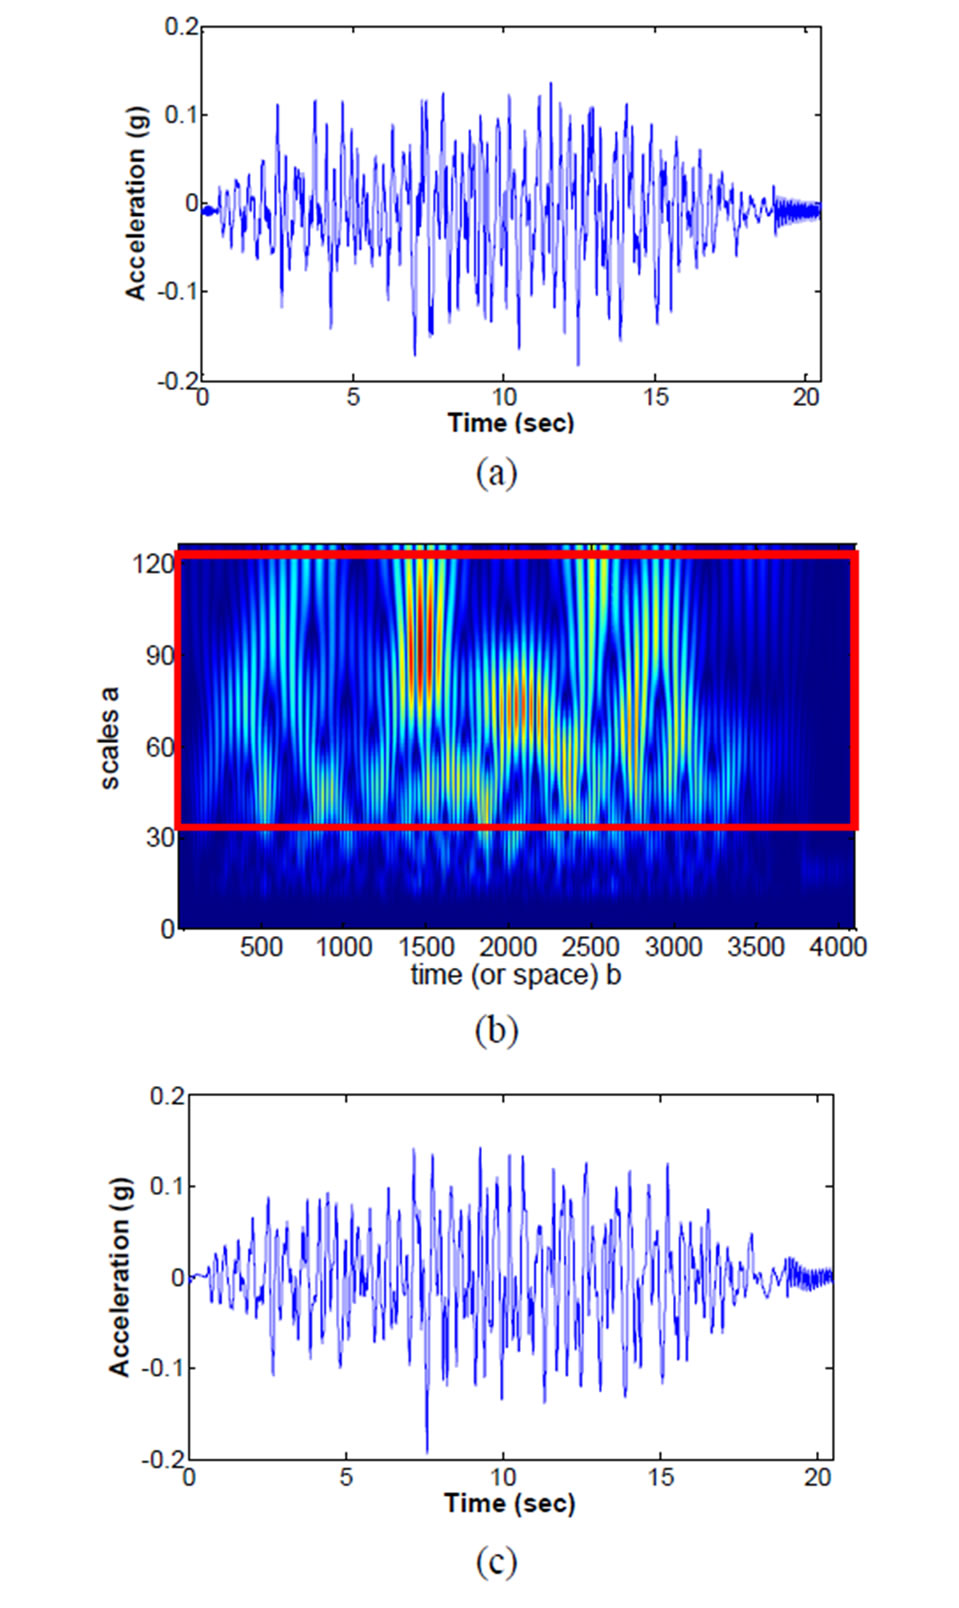
Figure 5. Extraction of characteristic signals using wavelet transform: (a) Raw Signal; (b) Wavelet transform; (c) Extracted characteristic signal.
tions was made using a X-bar control chart technique. Control chart techniques are methods that determines upper control limit (UCL) and lower control limit (LCL) using probability parameters such as expected value, median and variance after selecting probability distribution which is most appropriate for the distribution of data. Among them, a X-bar control chart is a technique to set the upper control limit and lower control limit using the value obtained by fitting data in the steady distribution and estimating mean  standard deviation
  as shown in Figure 6.
In this study, confidence level of the steady distribution was determined to be the range of 99%. Lastly, damage characteristics extracted using an X-bar control chart was defined as outlier that exceeds the upper control unit or lower control unit which was set at a steady state, which is what uses physical properties where the acceleration amplitude increases as the value of dynamic response increases in the event of damage.
Figure 7 shows the results of extracting X-bar control chart-based damage characteristics from data measured though experiments. The results of comparison between steady state (Case 1) and state with the largest damage (Case 8) of each acceleration data (sensor 1, sensor 3 and sensor 5) on the 1st, 2nd and 3rd floors using the upper control limit and lower control limit in a steady state showed that the number of outliers in damage state increased significantly compared to that in the steady state.
Next, the number of outliers detected from a X-bar control chart was represented as damage index as in Figure 8, which shows that the number of outliers further increases by damage case compared to the case with steady state, and the pattern in the number of outliers by floor changes. In measurement of data on the first floor, the greatest number of outliers was derived in case of removing bracing on the first floor, and the outlier also increased in case of removing bracing on the second floor, which is due to the result that removal of bracing on the second floor have an effect on the response on the first floor. In measurement of data on the second floor,
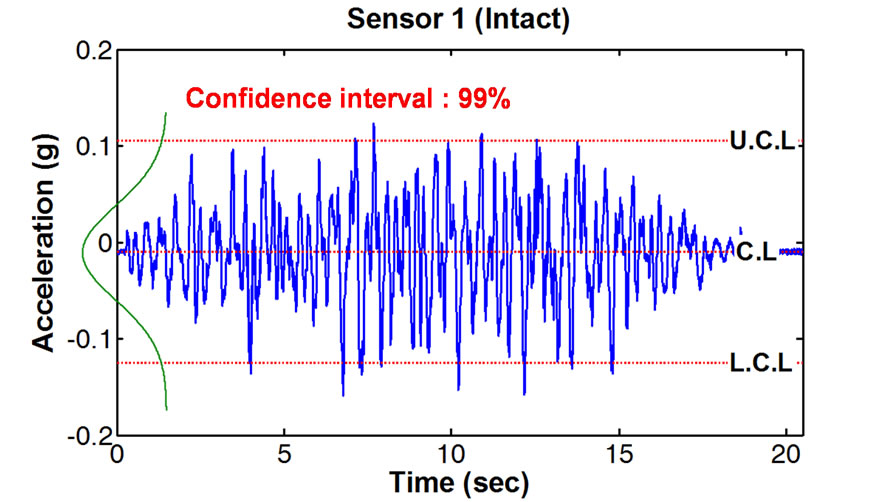
Figure 6. Schematic diagram of a X-bar control chart technique.
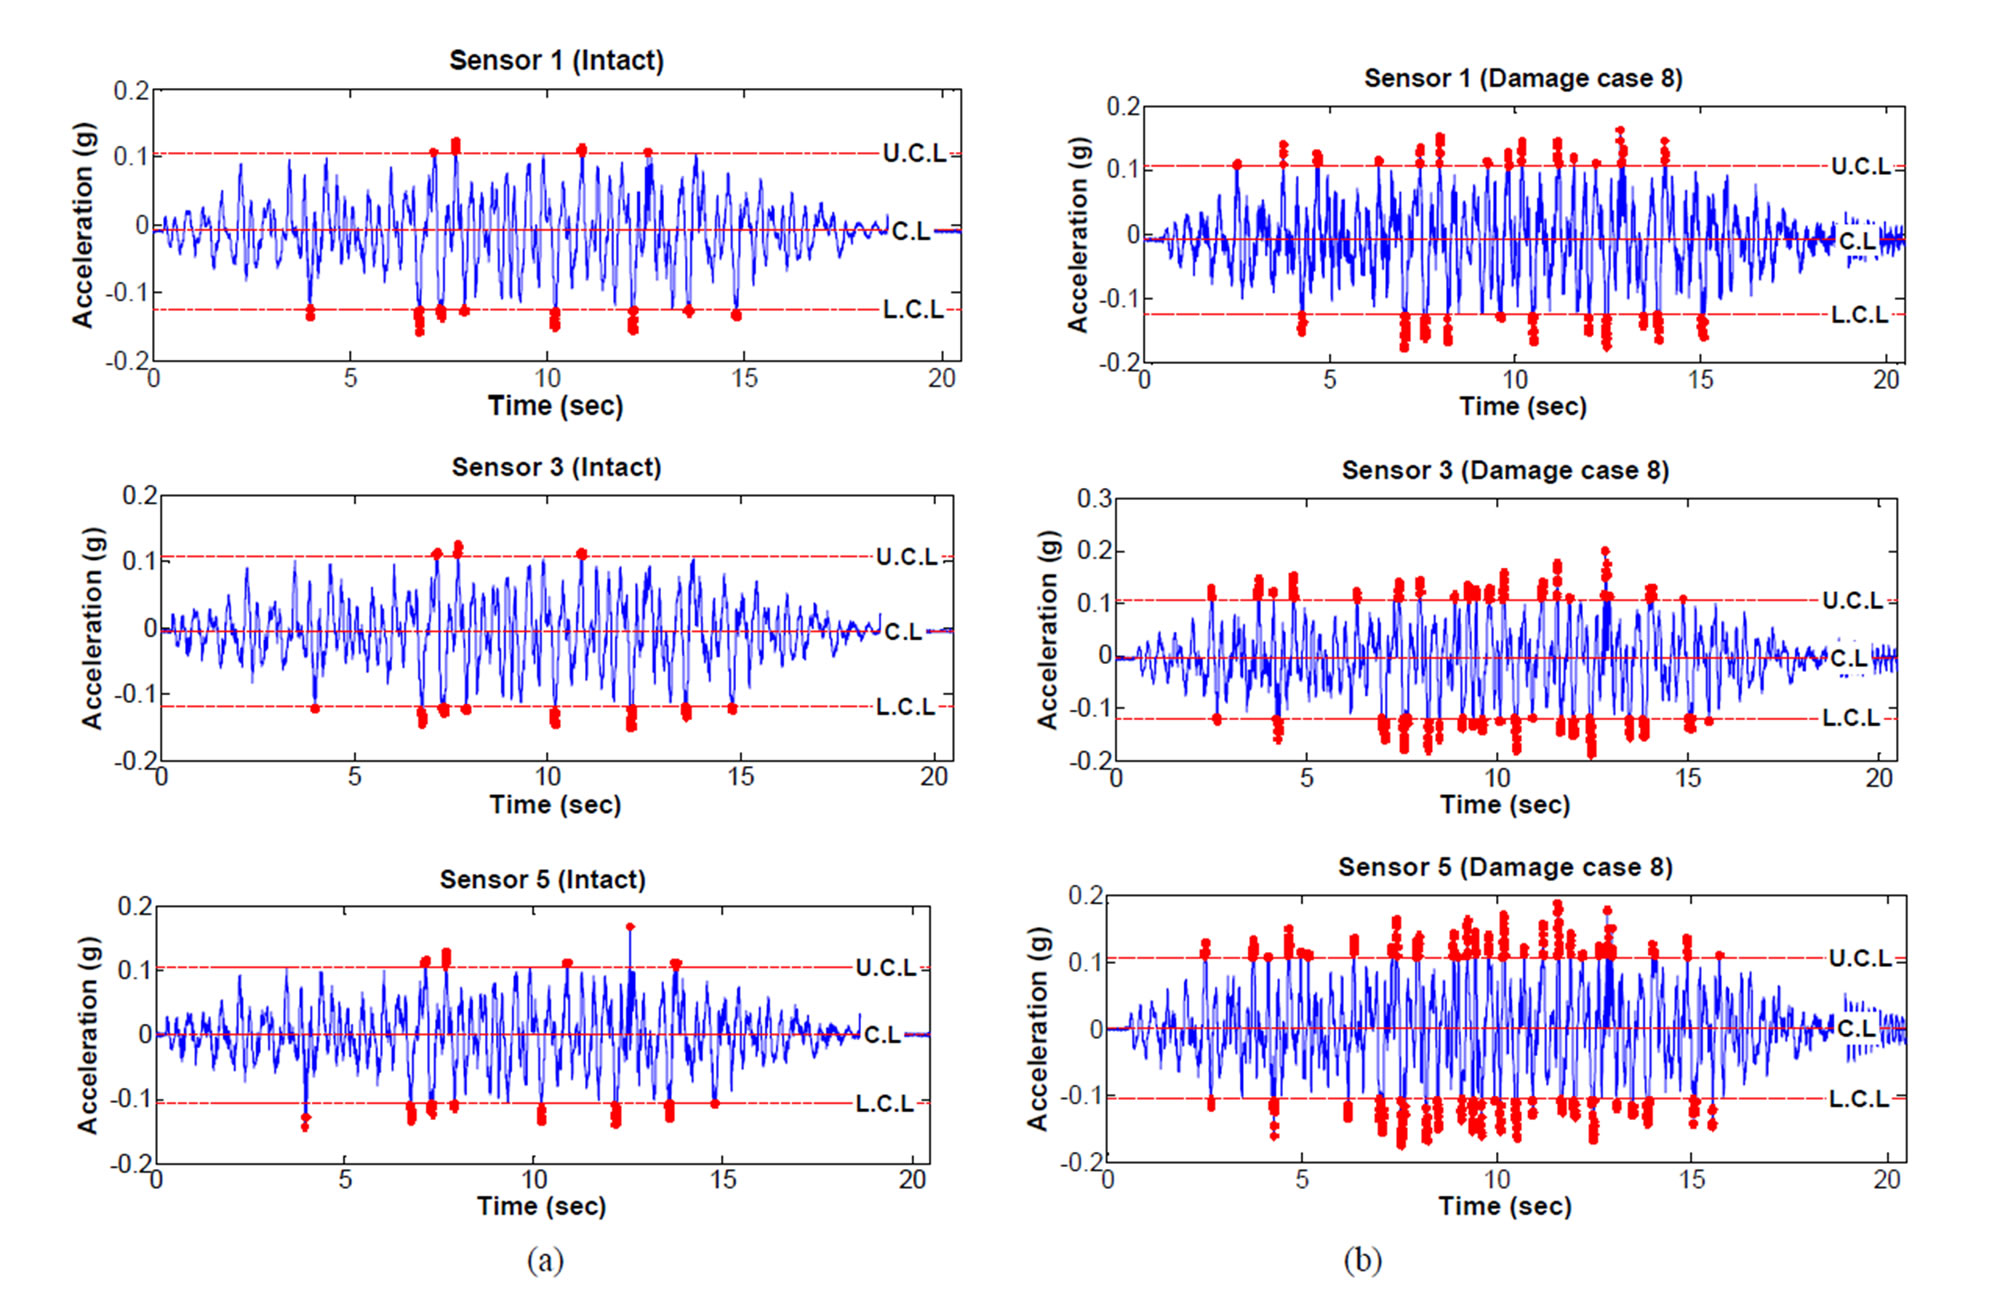
Figure 7. Outlier detection using a X-bar control chart: (a) Steady state; (b) Case 8 damage state.
an increase in the number of outliers becomes greater than that of measured data on the first floor, which is attributed to the fact that the accumulated response on the bracing removal on the first floor has a effect on the result on the second floor. Lastly, the case of removing bracing on the third floor also affects the response on the third floor due to the accumulated effects on the removal of bracings on the first and second floors. It is expected that the use of these patterns will make it possible to determine the damage location according to the sensor mounting position. In addition, the reproducibility of the algorithm can be identified since there is no difference between the number of outliers in case where all bracings are fastened again (Case 9) and that in Case 1.
3.2. Analysis of Frequency-Domain Data
Through the forced vibration test, an analysis of frequency-domain data was conducted in a similar way to time-domain analysis. The target structures and experimental conditions were the same as those of the timedomain data analysis experiment, and as input signals, sine sweep signals were used instead of artificial seismic waves as shown in Figure 9. The input frequency range of sine sweep signals is 1 to 15 Hz. In low frequency, the acceleration amplitude value represented as gravity acceleration is small since speed is low even if the movement of shaking table is large. On the other hand, amplitude value becomes greater as the speed is high despite the small movement of shaking table in high frequency. Accordingly, the amplitude of the signal increases as shown in Figure 9.
As for frequency domain signals, signal-to-noise ratio was made to be improved by applying a key element analysis technique as shown in Figure 10. The key element analysis technique is a method to remove noise by finding out the coordinate in which the most components are reflected and removing the component that is not reflected in the coordinate system under the assumption that measurement signals are reflected in general coordinate system. That is, it makes each signal independent by applying covariance of measurement signals to singular value decomposition (SVD) to remove the dependency between measurement signals.
In this study, when six key element coordinate axes were selected, the accuracy of results was highest. If many key element coordinate axes are selected, it is difficult to remove the noise of original signals since components on the noise are also reflected due to the presence of numerous coordinate axes in which signal components are reflected. In case the number of key element coordinate axes is small, response required for the reflected components can be lost. In this regard, the number of coordinate axes is considered to be important factor. The accuracy of damage detection results was im-
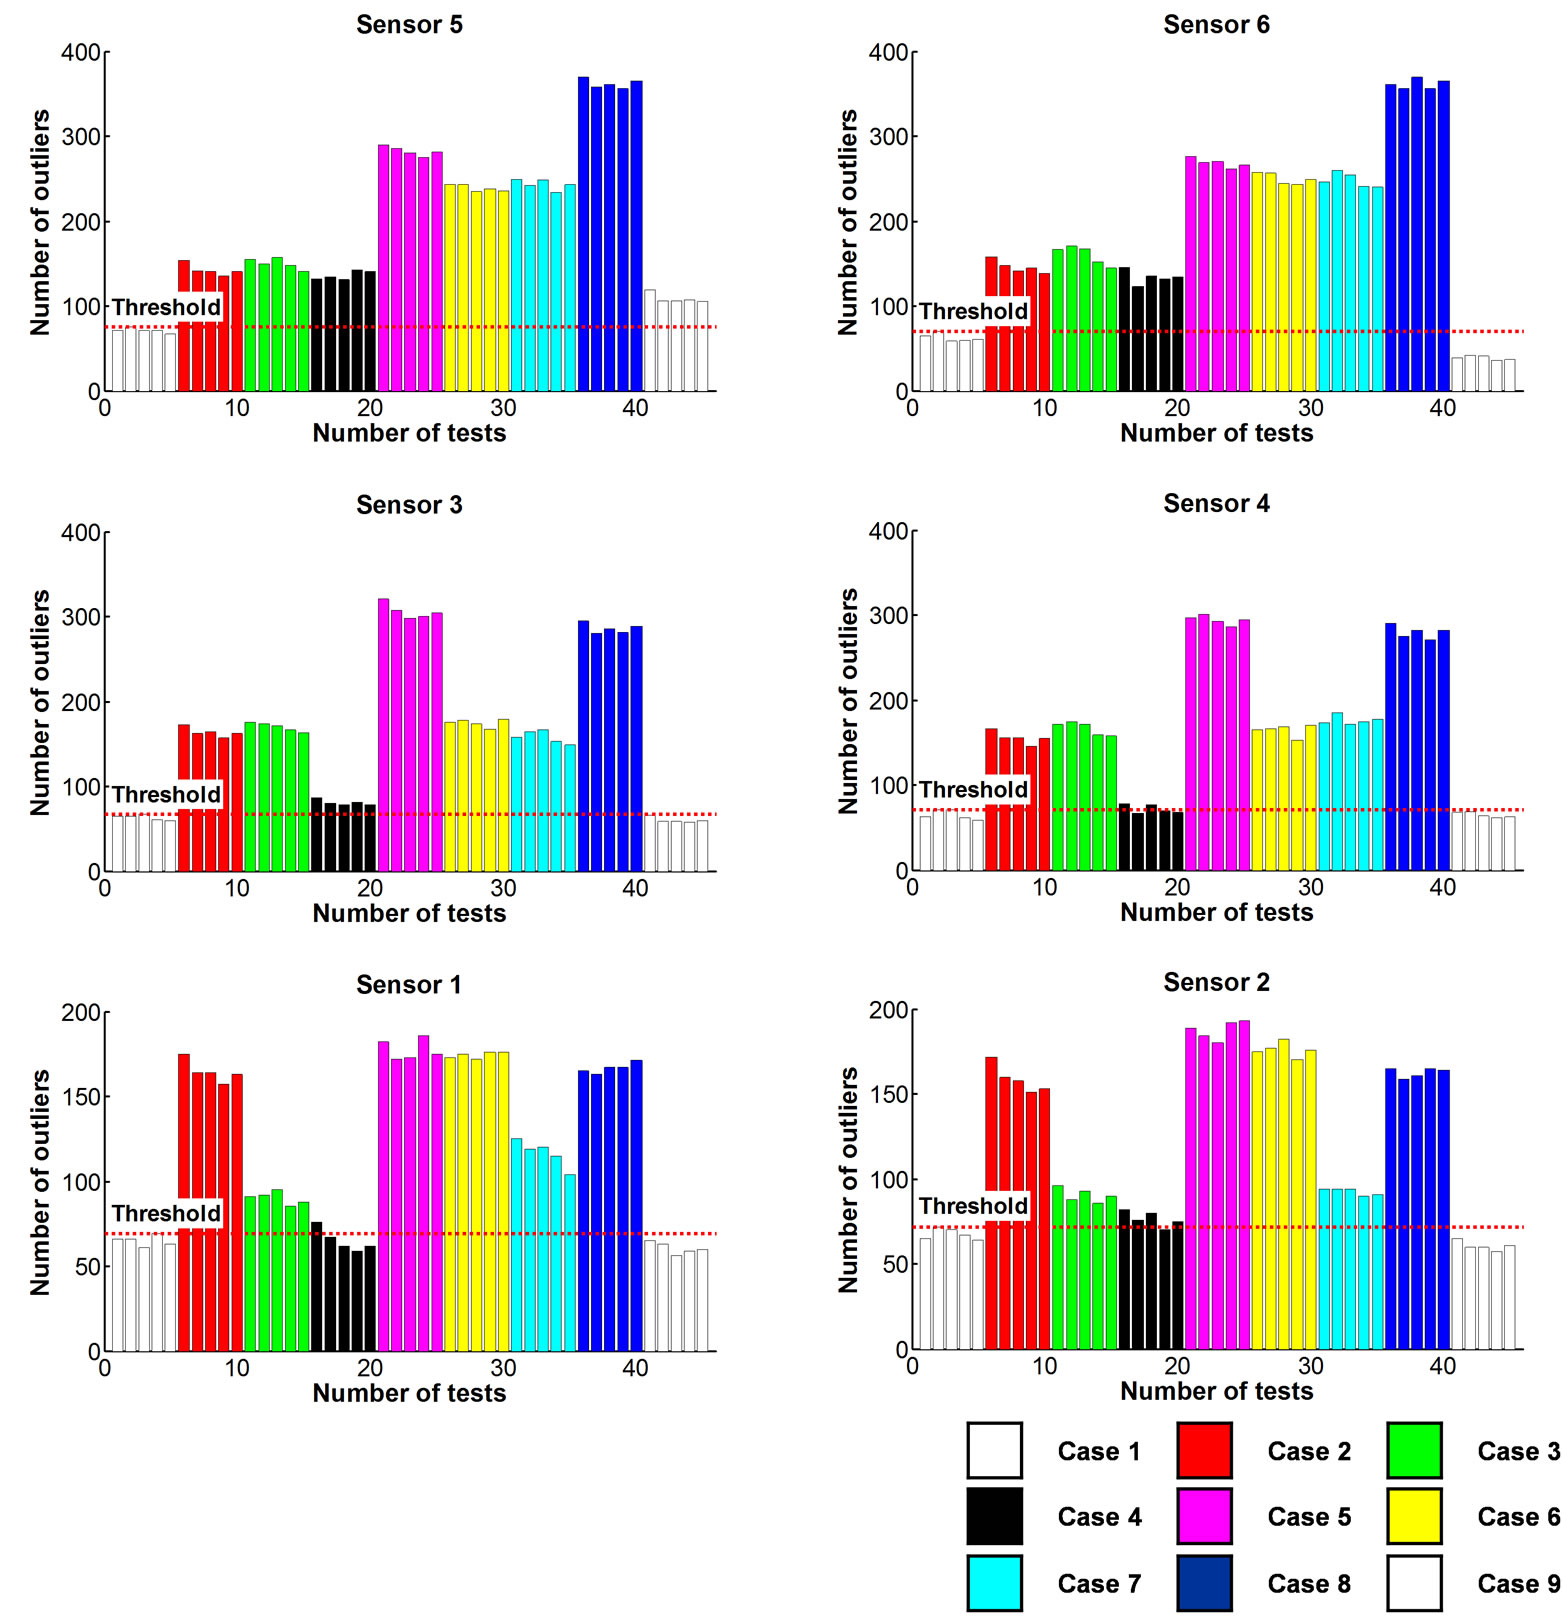
Figure 8. Damage detection results by sensor location.
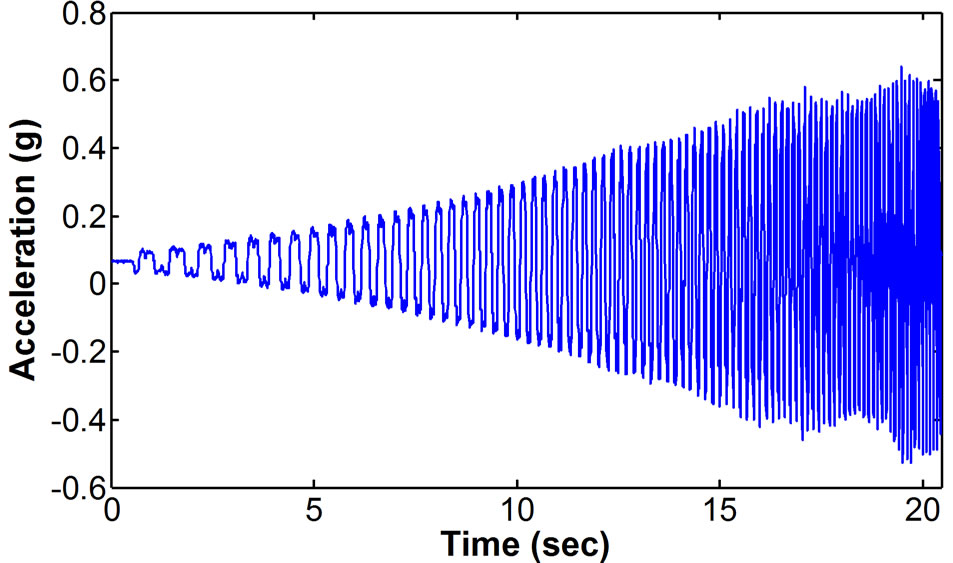
Figure 9. Sine sweep input signal (1 - 15 Hz).
proved by removing the noise through key element analysis technique.
Figure 11 shows the result of deriving the power spectral density (PSD) in which signal-to-noise ratio is improved through key element analysis technique in sinesweep signals. As dynamic characteristics of the struc-
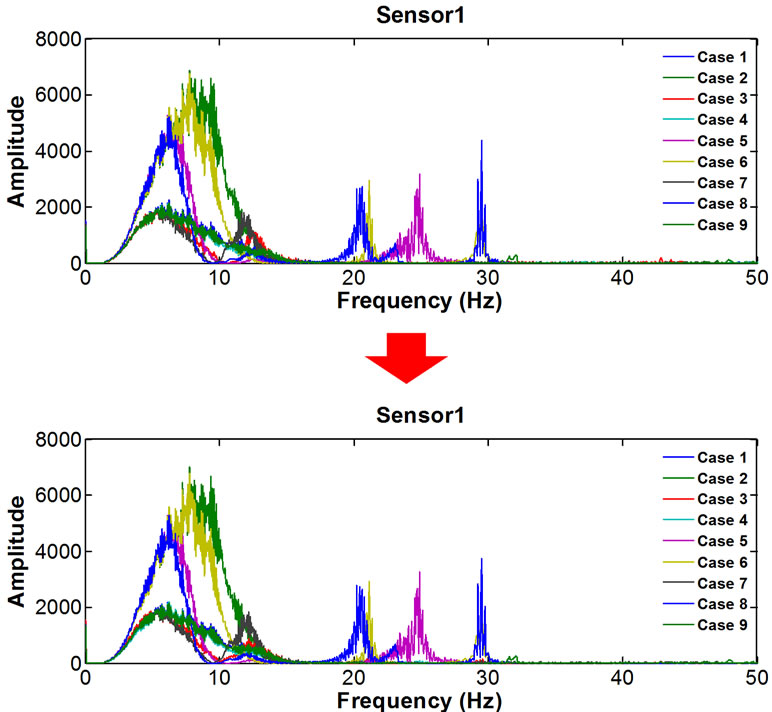
Figure 10. Damage detection results by sensor location.
ture are changed by removing bracings, the change in frequency response by damage case is observed. The change characteristics include the creation of new resonant frequency, movement of the resonant frequency and extinction of resonant frequency, etc.
The damage index to determine the presence of damage was derived using frequency response signals that improve the signal-to-noise ratio through the key element analysis technique. Among various damage index techniques, the root mean squared deviation (RMSD) was used, and using data distribution characteristics, the threshold to determine the steady and damage conditions was set by calculating and listing RMSD values for each case. In this study, since the distribution of RMSD values follows generalized extreme value distribution, the value corresponding to 99% of confidence level was used as threshold by fitting RMSD values into the generalized extreme value distribution.
Figure 12 shows RMSD values by each sensor data. In comparison with Figure 8 where damage detection results are represented as the number of outliers through time-domain analysis, damage detection results of the same pattern can be found. Based on the results, the validity of data analysis techniques through the proposed damage detection algorithm in time-domain and frequency-domain can be verified, and it is suggested that the complement of the proposed algorithm is needed through the integration between time-domain data and frequency-domain data.
4. Conclusions
In this study, the algorithm to evaluate the safety of structures by analyzing signals of time domain and frequency domain was developed, and the developed algorithm was verified through a forced vibration test.
In the verification test, a three-storied building model was used as target structure, and the presence of bracings by floor was assumed as damage to simulate the damage of the structure.
In this study, the damage detection algorithm was verified only using structural response of time domain and frequency domain without considering input signals. In the time-domain data analysis, signal-to-noise ratio was improved by extracting frequency components in which the energy of response signals is concentrated through the wavelet transform, and the damage by damage case was detected by applying characteristic signals with improved signal-to-noise ratio to the outlier detection technique to make the number of outliers damage index. In the frequency-domain data analysis, the signal with improved damage detection accuracy was extracted by removing noise through key element analysis technique and extracting only structural response. Using this signal, damage index was derived, and the damage was detected by fitting it into probability distribution.
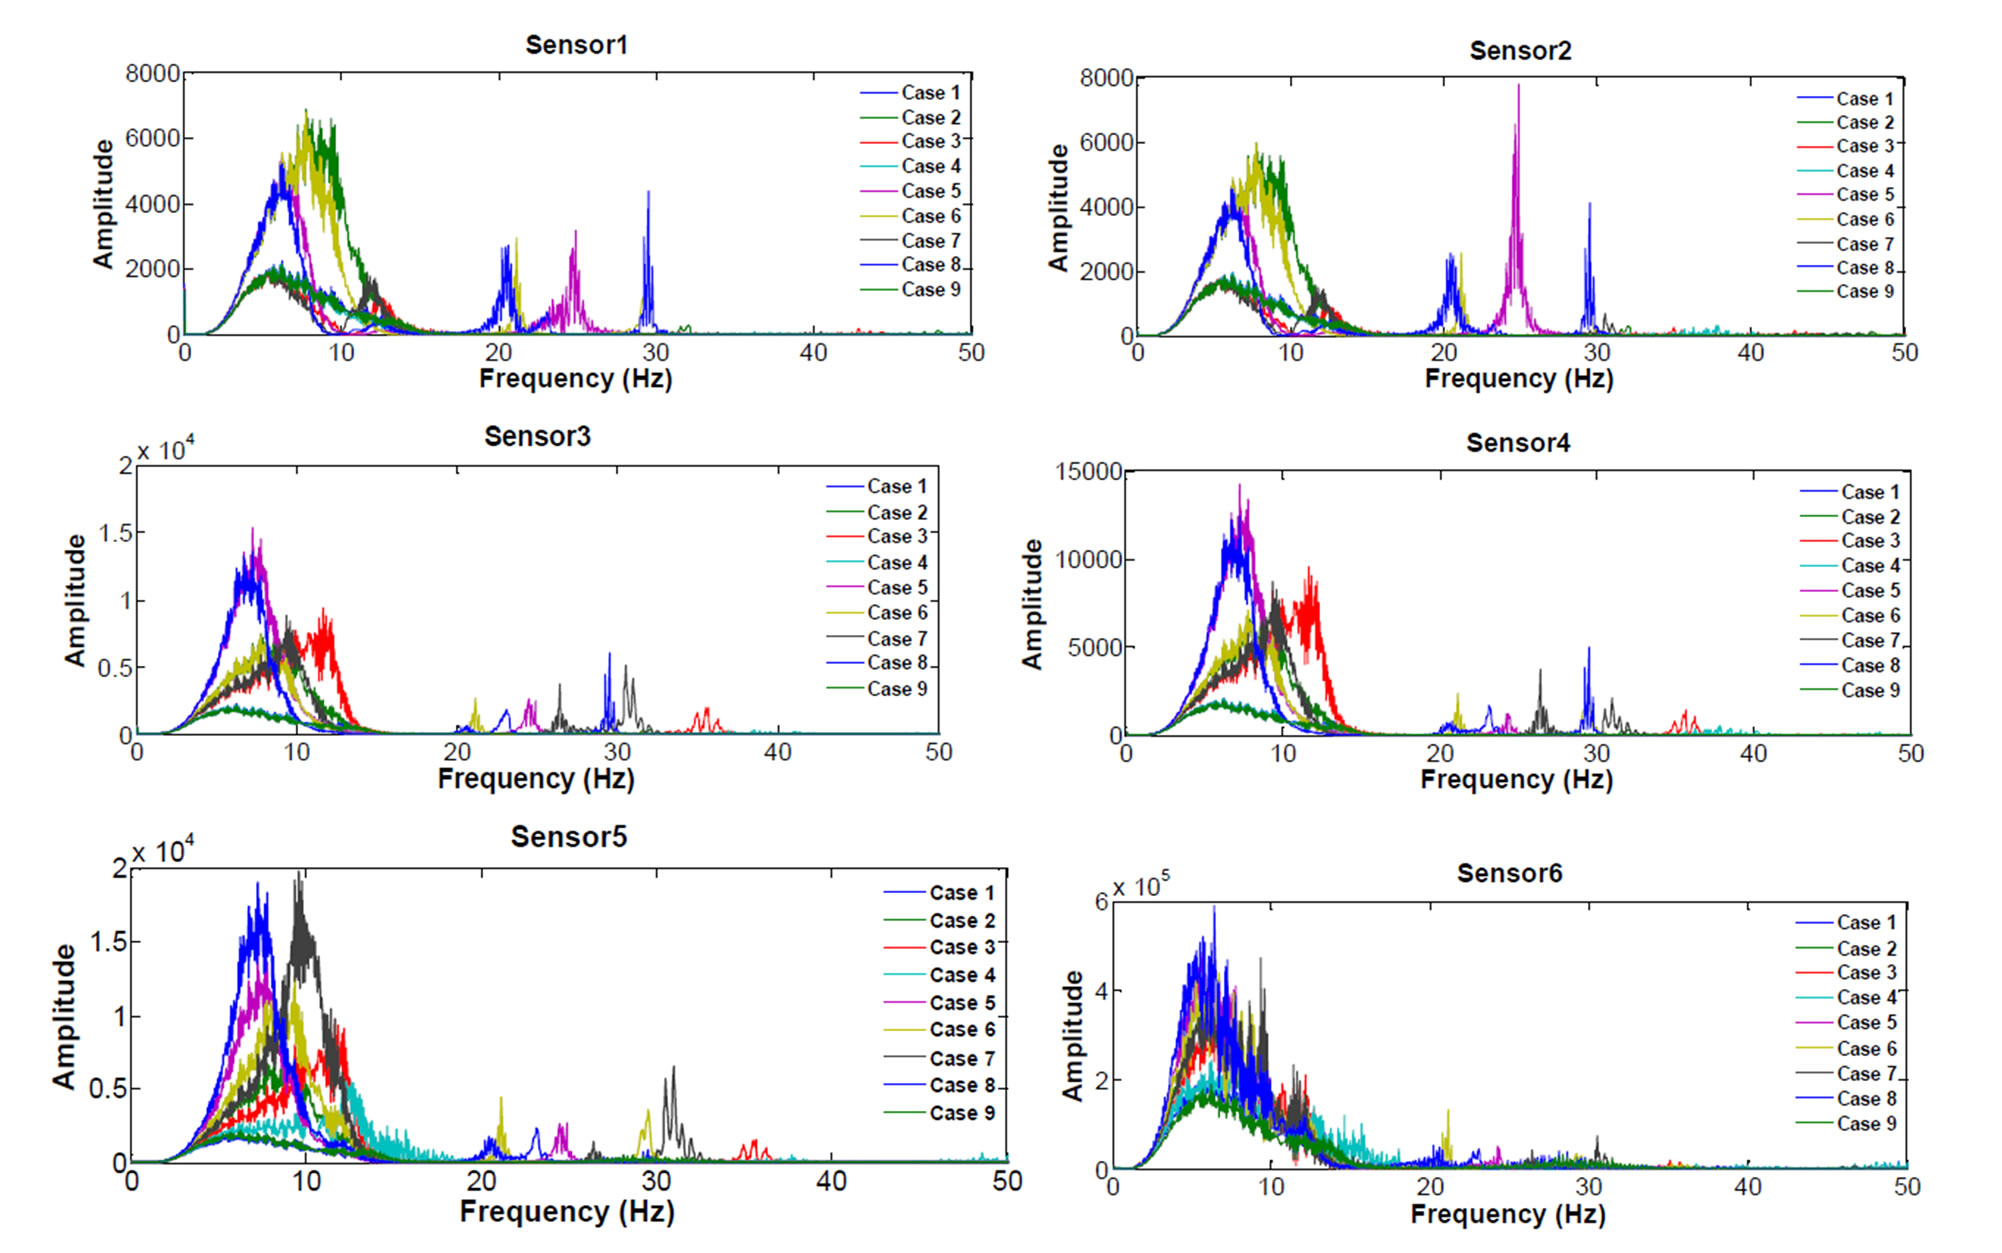
Figure 11. Comparison between damage cases of frequency-domain signal.

Figure 12. Damage detection results by sensor location.
From the results of time-domain and frequency-domain data analysis, the damage detection results by each sensor location with a high degree of accuracy were derived in both methods. Accordingly, it can be safely concluded that highly reliable judgment on the presence of damage is possible using the proposed unsupervised learning technique. Through further studies, damage location and damage level detection algorithm is to be developed based on the analysis on the damage index patterns by sensor location, and the effects of this algorithm on the change in external environment such as temperature and working load condition will also be investigated.
5. Acknowledgements
This research was supported by a research project (Development of Patch/Implant System based on IT Technology for Safe Management of Large Scale-Structure) funded by the Ministry of Knowledge Economy of the Korean Government.
NOTES