The Principles of the Seaborne Trade and the Determining Factors of the Demand for Ship Space ()
1. Introduction
2Data from Stopford (2009: p. 385) , for 1950-2005, & from Institute of shipping economics & logistics, Bremen, Germany, for 2006-2020.
The Seaborne Trade-ST served well by the International Commercial Shipping, we believe, & the ST showed indeed a remarkable evolution, i.e., from 0.55 billion tons1950 to 7.22005 within 55 years (almost 5% p.a.; more than a 13 times rise)2 ! In addition, it arrived at ~11.5 bt2020 (within 15 years; more than a 1.6 times rise) or 21 times1950-2020 (within 70 years)!
The demand for ships’ space emanates from the need to transport—mainly 14—important products (Table I1), required for the economic life & progress of humanity. This demand is apropos called derived demand, stressing the fact that shipping is a service-industry destined to carry-out the goods by crossing the oceans, and it is not demanded per se!
The ST moved up faster than the global GDP by an additional 1% p.a. More important is, however, to underline the two products, which according to our opinion, indicate the worldwide “economic growth”: the Iron Ore, which increased 2.4 times1986-2005, & the “cargo in containers”, which increased about 10% p.a.1986-2005! Equally important are the exports of Crude Oil (in million tons) 2009-2020 (Scan I1).
The composition of the ST over all these 70 years indicates clearly the main trends that the world economies followed by establishing oil as the main fuel since the start of the century with the appearance of automobile—abandoning steam, the effort to increase grain production for people to have food & the use of proper materials to proceed in various constructions (iron-ore).
As shown, the “Middle East Gulf/Near East” kept steady its leadership in exporting crude oil the last 122009-20 years—with a pace more than 2.6 times higher than “North West Africa”, “Central & South America”, & “others”—up to 2013. As shown, the Middle East Gulf/Near East, exported about 1000 million tons in most of the years presented (2011-13 & 2016-18) vis-à-vis all the rest—except the others—achieving about 400 mt.
In imports (not shown) of crude oil, “West Europe”, America, Japan & China—and especially China—as well “others”, excelled the last 12 years2009-2020. Japan & China started to import near 380 million tons2009 to reach 680mt2020 (!), while “the others” stepped down to 6102020 from 820mt2009.
Our subject is the physical quantities of cargo, following Stopford (2009: p. 387) , and not their values, which concern mainly the “international trade economists”, equally, or more, important of course. E.g., the iron ore exported in great quantities from Brazil2008 valued $45/ton, while 1 ton manufactured goods valued $20,000!
The composition of the seaborne trade changes as time goes by and this interests us, though the “general economists” care for the broad categories of trade—i.e., the “primary” goods versus the “manufactured” ones. Moreover, maritime economists care for the trade over the various geographical regions (e.g., USA’s “East Coast” versus its “West Coast”).
![]()
Table I1. The 14 main products carried by ships1986,2005,2020.
Source: Data from Stopford (2009: Chap. 10, p. 387) for 1986 & 2005; ISL (2021) for 2020.
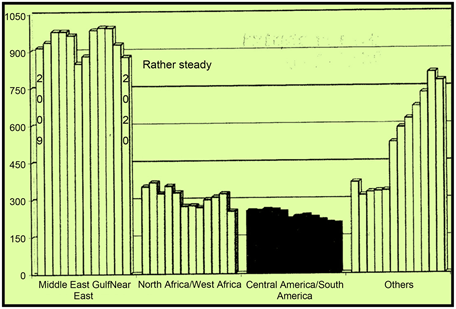
Scan I1. Crude oil exports, 2009-2020, in million tons. Source: ISL (2021).
Greeks maintained their top global positions (BIMCO11/2023) as ship-owners, owning 19% of the world fleet, in dwt terms, with an inclination in tankers (23%), followed by bulk carriers 22%, gas carriers 18%, containerships 7%, general cargo 1% and other types 29%. The family companies of the Greek ship-owners maintained their top positions, owning 134m dwt08/11/2023 (Figure I1). This means that the ~38% of the Greek-owned fleet03/2023 (~349 m dwt/4110 ships/85,000 dwt av. size) is owned by only 10 companies-families!
2. Aim and Structure of the Paper
Our first aim is to analyze the principal factors, which determine the Seaborne Trade2004,2011-2020 (Graph 1) by running, or taking into account, a number of linear regressions fitted on the basic variables, i.e.,: GDP, exports and imports, as well the land area and the total population found in the countries. This paper is a companion to the one of Goulielmos (2023a) .
Our second aim is to find-out the central reasons in order for countries to trade (Graph 2).
The paper is organized in 6 parts—after the literature review—as follows: Part I dealt with 5 adventures, which occurred to Seaborne Trade2009-2018; Part II dealt with the 2 most important components of the Seaborne Trade: Exports & Imports; Part III tested the theory of trade specialization exploiting the existing abundant factor; Part IV dealt with the analysis of a country’s international Imports vis-à-vis its GDP; Part V dealt with the question: “Can the ‘Land Area’ and/or ‘Country’s population’ influence its Imports?” Part VI dealt with another question: “To trade abroad or not to trade?” “This is the question”; finally, we concluded.
![]()
Figure I1. The fleets owned by the top 10 Greek families-ship-owners in m dwt11/2023. Source: data from BIMCO/Clarksons.
![]()
Graph 1. The principal factors, which may determine Seaborne Trade2004,2020. Source: author.
3. Literature Review
During the history of the Mankind, certain great powers emerged, which first built a “respectable” Navy, followed by a dynamic Merchant Marine. Such powers looked-after, immediately, in establishing colonies3, like par excellence, Great Britain, and as a result they were at once in favor of the Seaborne Trade.
A powerful class emerged in UK apropos, more than 3 centuries ago (16th-17th c)—the “Mercantilists”—who argued that the “sea trade”—and particularly when country’s imports, in value, exceed its exports, in value—“gives” country’s gold—to foreign countries, something not desirable. This led to the co called “navigation laws”, etc.
3The first who taught this was the people of Greece, and the Phoenicians.
4Hume also argued that when the reserves of one country are all gone due to exports the country will be left…in poverty. Hume was not an economist.
Hume, D (1711-1776) (1752) described the above phenomenon4, and Adam Smith (1723-1790) attacked it (1776) . In 1816 appeared also the problem of the price of corn, in Great Britain, by prohibiting its imports, when the price fell below a certain level, till 1846. This event was the one to make clear the need for an international trade theory.
Moreover, the “theory of the absolute advantage”, due to Adam Smith (1776) , argued that if trade “dictates” a country to focus on its scarce resource(s), and thus on products—in which it is most efficient in their production—a higher standard of living will this way be attained!
Further, the “theory of the comparative advantage”, due to Ricardo (1817) , argued that the trading countries are better-off, even if they are efficient in everything.
The “Physiocrats” appeared, next, in France, in 18th c., believing that wealth comes only from exchange, which is made possible by Agriculture, and by production in general, carried-out by labor together with land. These were the proponents of the “laissez-faire”, and supporters of the natural order and its supposed laws…
Heckscher (1950) and Ohlin (1933) —H-O, argued that international trade results from the differences in costs of the traded products, due to the variations in factor endowments, and a subsequent specialization, which has to follow—in line with the abundant factor. This meant to produce, and export goods intensive in the abundant and supposed cheap factor.
Muntean (2005) provided an analysis of the H-O model concluding that the owners of the abundant factor in production will only be benefitted from international trade… Leontief (1954) tested the H-O theory—using the well-known by now “input-output technique”—in USA’s foreign trade—and he found that USA’s exports were… labor intensive, instead of capital intensive, something not expected (called after that this the “Leontief’s Paradox”)!
Stopford (2009: p. 385) argued that the impressive rise in ST was due to the rapid economic growth achieved by certain of the (international) countries, and by the increasing wealth obtained by their consumers! This took place, par excellence, soon after the “Bretton Woods” conference1944, i.e., in our times (Graph 3).
Almost all countries moved—gradually—towards increased free trade, and also with the participation of the ex USSR1989, and China1995, par excellence, due to its size! The 2nd peaceful revolution was made by the expanded communications (telex, direct-dial phone, fax, e-mail, internet, interregional broadband cabling, as well the famous “mobile smart phone”). Communications, we believe, speed-up the human actions during a 24-hours “working day” (achieving the… “Economies of time”), and increasing the degree of managers’ control from a distance—so important for shipping managers!
5This theory we believe is right, because the average cost falls with the size of the production. The size of the production depends on the size of the sales, including those abroad, which depend on price and quality. Quality is improving by “doing and learning” and after a “sale research”, plus the parity of the national currency (Japanese car production is a good paradigm) (Goulielmos, 2018) .
Transport—through its economies of scale and the adequate bank finance it obtained after the 2nd WW—reduced its long term average cost—in almost all its means, including shipping (Stopford, 2009) . Transport brought, gradually, the places of production—no matter their distances—nearer, and in a faster way as time elapsed, to the places of consumption—adding utility! Moreover, the “assembly functions” relocated in cheaper countries—reducing their cost further, even located within ports’ areas avoiding import taxes!
Last, but not least, maritime economists were/are against any kind of protectionism/isolationism, which from time to time emerged in ST in the form of tariffs or quotas, etc.; also, in forms of cargo reservation, flag preference, shipbuilding subsidies and similar protectionist schemes. Well-known and widely spread, however, was the protection of a newly starting industry5, (i.e., “the infant industry protection theory”).
Certain of the above mentioned practices, no doubt, distorted global competition, taking also into account the regional regulations for safety—instead of the international ones—preferably coming from IMO. Thus, maritime economists were also in favor of lower, or zero, tariffs, (as achieved eventually by GATT, est. in 1947-1948, and globalization).
![]()
Graph 3. The important developments since 1944, which influenced Seaborne Trade. Source: Author.
Summarizing, economists understood-well that certain countries were fit—by Nature—to be efficient in the production of certain products for a variety of reasons—one being climate. Also nations understood-well that by “exchanging” they could obtain the products, which were missing, given their cost and the parity of the foreign currencies. These two understandings have expanded ST over the past decades.
4. Part I: The 5 Adventures of the Seaborne Trade2009-2018
As time elapsed, managing the economies became a more and more complex issue. Economies became increasingly vulnerable to a frequent number of problems of a non-economic nature, like: local wars, floods, fires, earthquakes, pandemics, typhoons, migrations, famines, terrorisms, piracy attacks, and the likes!
Moreover, a number of socio-economic problems also emerged (Graph 4).
4.1. Globalization
This was an effort to open-up—the existing markets completely, something which made them larger, and more international, and caused so that certain trading blocs to be formed (EU, NAFTA & ASEAN, as well others). Moreover all kinds of barriers and tariffs had to be removed, and many removed worldwide, and in EU-28. It is a common sense, we believe, that all efforts, destined to reduce the cost of production, globally, and thus to reduce all FOB prices, they will expand exports, and ST in general, towards a final benefit of shipping industry—which undertakes the sea transport!
Worth noting was the 1970 start of USA’s trade with China, and the subsequent opening of China to global trade—in more than 20 years ago—ending for China to become a member of the WTO2001.
6A 30% of the USA firms is estimated to have interrupted or diminished their activity in China.
The economies, of course, wish to create markets, where to export their products, but they do not like to import foreign products in excess of what they export, or even less than that! This wish proves that a new theory of the international trade is required, which nowadays listens to the cry: “let us disengage6 our business in the trade with our competitors as being better”!
The above means an “anti-globalization” movement! Its cost is estimated to be 7% of the world GDP—taking into account only China! The German cars which used to supply the 50% of China’s imports2020, fell to 30%2023. USA2018 imported 22% from China, which fell to 14%2023. China introduced the Chinese Coca-Cola
![]()
Graph 4. Five important socio-economic factors, which affected Seaborne Trade & Shipping2009-2018. Source: author; inspired by Lorange (2009: Chap. 1) .
and a “new faster smart mobile phone”. Germany lost 37b euro from its reduced exports to China, while it also lost the “German robot manufacturing ‘Kuka’” sold to Chinese. The German “disengagement” from China is estimated to cost from 2% - 3% less GDP…, or 22b euro less exports, out of 298b euro2022 trade.
4.2. Manufacturing’s International Mobility Eastwards
Manufacturing, during the years, obtained a remarkable mobility—due to “factor mobility”, we believe, from country to country, guided mainly by the lower cost of production! During certain past days, Japan was the “manufacturing center” of most of the durable consumer goods—destined to be exported to USA & Europe! The succession, however, in such exports, was inevitable, and manufacturing moved eventually to South Korea, China, India perhaps and Vietnam, and tomorrow to Mexico…! The business entire world became a village…
The above is mainly a cost-driven mobility, as mentioned, which seems to be functional forever! Did USA’s pre-Biden administration understand that and rejected globalization to prevent7 USA industries to “fly”-away to other countries? Shipping, of course, likes not only the larger quantities to be transported, but also the longer distances to be covered! The more distant is production, and the more distant is consumption, the better for shipping!
7Worth noting is the recorded movements of EU-28 industries to USA, as the economic atmosphere changes in the two continents (e.g., concerning the interest rates, taxes, banking status, etc.)! Thus the attraction, of businesses from other countries to one’s own, emerged as a very important economic phenomenon, lacking, however, the attention it deserved. A proper office had to be established at Prime’s minister office, (the highest possible level), we believe, to attend, and promote, the wish of companies looking forward to establish a branch in one’s other country! The reasons that a company believes that somewhere else its business life will be more profitable, and smoother, increase, as time goes-by, due to local wars and terrorism in certain countries, to mention only two basic ones. Interesting is the fact that many non-economic factors may play an important role, like: the political and social stability, the friendly climate, as well market’s (import) proximity, etc., due to the fact that the transportation cost became prohibitive, following the 2022 Energy crisis.
Money capital surely has a high degree of international mobility than the other factors, but what about labor? This is a very interesting subject requiring further research, we believe! Nowadays we saw India to wish to “export” its excessive labor force especially in UK, Greece and EU-28!
The issues created by our modern civil organization are, however, many: the “illegal migration” and its impact on national unemployment; the “terrorism” in the capital cities; the “Safety” in working places; the “Piracy” in the Seas; to mention the main ones…
As far as shipbuilding is concerned, we all are aware of its eastward mobility by now, (a further research topic is about the Japanese shipbuilding, which remained rather robust over 70 continuous years!) (Goulielmos, 2023b) . The Chinese shipbuilding—according to recent statistics—has assumed, however, the first international position in orders!
4.3. The Demand for Goods, Raw Materials and Consumables
Economists distinguish the countries in low-cost developing nations, and in high-cost ones, but every country, in order to grow, needs: ore, steel & energy—and those having them, are the Kings of the present, and of the future, ST, till energy is produced the way Sun does it!
We believe that the economic history is repeatable, even not in an exact pattern (Goulielmos, 2009) ! In the past, economists considered certain large and strong international economies as the “locomotives (or engines) of growth of the entire world”! These were, and they may still be: USA, Germany, and Japan, and others, but surely now one must add at least South Korea, China and perhaps India tomorrow or Mexico?
Indeed China determined—and will determine—ST, and given that its growth is beneficial for almost all global economies, it is also, however, detrimental its slowdown, as this happened since 2008 with China’s GDP (Figure 1)!
As shown, China’s GDP, in 2008-9, stalled, and then fell in 2011-2020. The 2021, and the relevant estimations for 2023, showed an improvement, but it is estimated not to be sustained in 2024. The Foreign direct investment between 1998 and 2022 in China was as follows (Scan 1), which is an indicator influenced heavily by the interest rate in the country.
![]()
Figure 1. Growth rates of the Chinese economy, 2000-2024 (est.) Source: Nikkei.
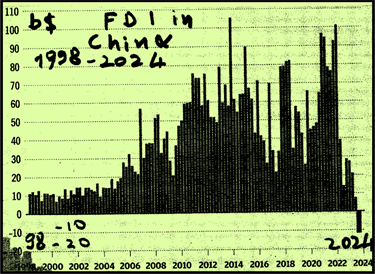
Scan 1. The Foreign Direct Investment in China, 1998-2024 (est.). Source: Goldman Sachs, 2023 Nov.
As shown, the FDI in China had an increasing performance since 1998, intensified in 2008, 2010; 14; 15; (2014q max. $105b) and in 2018, as well in 2021-2022. In 2023 the outflow has been noted with about $12b in the 3rd quarter of the year.
4.4. World Trade
The crisis in the capitalistic banking system, in 2009, left specific signs, which is better to know, as they may come back: the flow of the raw materials retarded, and the steel production reduced, if not due to other reasons, because of consumers’ cut of their demand, and where fewer cars e.g., were purchased. The iron-ore was not imported at quantities used to. The only “positive” law working in such situations is that of demand, where if the demanded quantity falls, the price of a good falls—given its elasticity of demand…
Moreover, consumption is not sustained at the levels used to—especially in large economies like USA, Europe and China—and the prime victim is destined to be the containerized trade, as in few years ago, (concerning all finished goods; products of manufacturing and of cottage industries), especially those coming from the hitherto large supply areas like China.
4.5. The Demographic Issues
Table 1 presents the population status of the 10 most populated areas, in the World end-August 2023.
China and India are the 2 most populated areas covering the 31.5% and 31% of the population of the 10 countries. Economists, however, the so called “labor coefficient of production” did not identify with “population”, and as a result population did not receive the attention it deserved! This was a mistake from the beginning! This is so because all citizens must be made able to be fed, have health care, basic education as well cheap transportation, a car and decent shelter, etc.
![]()
Table 1. Population in the 10 most populated countries worldwide, 08/2023.
Source: Data from “Statista”, 2023/Oct. (internet).
Societies must become more human-centered than labor-centered, as are now, we believe! We must care about population, and not just about only “labor force”… The first is humanitarian, the second is economic! The real target of the economies is not to “create” laborers, or profits, but to have satisfied citizens using a number of sciences—including economics, and applied research. Production, imports, exports are nothing more than the means towards “people’s welfare”, and not a self-target—as it became to be till hitherto!
Moreover, economists care only about a specific period of the life of a human being: i.e., his/her “working (& part of unemployment) life”, starting at the earliest at about 18 years of age, or 21 (if university studies follow, and there is no military service). The economic life of humans before 18 years of age & after 65 years, no body, or few people, care equally about! This has to change, we believe! The entire life of humans must be the subject of economic science!
Graph 5 indicates 9 at least subjects that “economists”, & not only, have to deal with in future in connection with country’s population, we believe.
The fertility of a country’s people is important to be maintained at its natural rate, and this is a composite target, requiring a number of preconditions. Mortality is also a target for reduction! Scientists maintain such statistics like death rates & birth ones to just determine if a population is going to increase or not! The life expectancy is used nowadays as a statistic for which a society can be proud for! But a universal index of the “quality of life” is missing8! The modern issue is not just to be alive, but to have a qualitative one!
8An important research subject; non-qualitative life is not proper for modern citizens! If we define the “quality of life”, then we will see thousands of things that have to be altered! Please try!
There was also a governmental policy called “one child”, which restrict family size (China1980-1990). In West European countries—called civilized societies—1 or 2 children are considered maximum per family!
However, the number of abortions may reduce the potential size of a population drastically by killing most of the babies-to-be (not recommended). We calculated that in the world 400 m children are “missing” every year due to abortions, and a double figure (800 m) perhaps belongs to all contraceptive manners… Humans took over the role of God by deciding who is going to die & who is going to live!
![]()
Graph 5. The 9 subjects that “economists”, (and not only), HAVE TO deal with more emphasis in future! Source: author.
Here we may mention also the mobility of the pensioners from low temperature countries to high temperature ones, (e.g., from Germany to Greece), where also the season’s bill of heating is lower! Such population movements will continue as long as gas, electricity, central & other means of heating remain very expensive! Mobility is a vast chapter in economics, which did not receive the attention it deserved!
5. Part II: The 2 Most Important Components of the Seaborne Trade: Exports & Imports!
These 2 main factors have caused the expansion of the ST, i.e., the “sea exports + the sea imports”, & economists tried to explain why certain countries have a substantial trade & others have not! The exports—as we all know—boost the national income, & reduce the national unemployment, unlike imports, which reduce unemployment in the foreign countries, & increase the national income there!
In the world, there were2004 more than 170 countries, of which, according to Stopford (2009: p. 389) , only 100 (59%) take part in the seaborne trade—& from them—only 40 (23.5%) are important, by serving the 89% of the ST! All countries, however—except few—wish “to export” their products & services, so that to derive at last the valuable foreign exchange. But the key to trade are the (low) (FOB-export) prices…to which we turn.
5.1. CIF Prices: The Decisive Variables for ST
To start a trade, the CIF price—in the exporting country (FOB + insurance + freight rate)—must be lower than the same price—in the importing country—for the same, or equivalent, good, if at all, & of the same or close quality. The last crisis was not at all favorable for the ST (Figure 2).
As shown, 3 of the most basic products of the ST, doubled2008-2021 their prices/ton from $1001980 - $24o1980 to $5502008, to $6202012 & to about $5802021! With such high prices, due to the energy crisis, & the global inflation, no trade can ever be expanded!
Usually, exporters export their best quality, obtaining higher prices than at home, due to a higher standard of living abroad, & also due to a favorable foreign
![]()
Figure 2. World commodity prices for 3 selected ones1980-2021 (monthly). Source: modified from that in ISL (2021); cotton price = US$/kg.
exchange parity. Governments of course care about—or they have to—their people so that to have all they want at the quantities/qualities required. Moreover governments can “prevent”—if allowed by the WTO etc.—their exports by imposing tariffs or legislating quotas, etc.
We will next ask, and answer, 4 questions, and limit our investigation on 57 countries (covering, however, the 82.5% of the total ST).
5.2. Which Country/Area Supported the Global Exports2004?
Figure 3 shows the 20 most important countries/areas, which have carried-out the majority of the international exports2004.
9Worth noting is that from the 20 countries/areas presented (Figure 3) 4 are composite: “North West Europe” stands with Germany, Belgium, Netherlands & France (5 cases); the “East coast of South America” comes with Guyana, Venezuela, Suriname, Argentina, Bolivia & Uruguay (7 cases); the “Central Asia” comes with at least Russia & Kazakhstan (3 cases), and the “West coast of South America” comes with Chile, Columbia, Ecuador & Peru (5 cases) (20 + 15 = 35 cases in total).
As shown9, the Middle East, (taken as one area), was 1st among exporting areas2004, followed by “North West Europe”, Australia and East Coast of South America. The performance of the ST (exports) in 6 main worldwide areas recently2011-2020 was as follows (Figure 4).
As shown, “Middle East” traded higher (~18%2020) than the rest2011-20 at a rather low 2.2% average p.a. increase, equal to that of the world. It followed by the faster “South East Asia” (15.5%; 3.4%2011-20). Oceania also exported faster by 2.8%2011-20. The ST, however, stalled2019 and fell2020! All countries/areas retarded their exports2018-2020, starting in 2018, except for “others”. One main reason for the retardation, and the fall of ST, was the Pandemic2019 (Goulielmos, 2020a) .
5.3. Which Country/Area Supported the Global Imports?
Figure 5 presents the 20 countries/areas carrying-out the global imports2004.
As shown, “North West Europe”2004 held the 1st worldwide position in imports, followed by USA, Japan, China & South Korea. Among the EU-28, Spain was the one to excel! During the recent years (Figure 6)2011-2020, things changed: “North East Asia” took over all imports, covering the ~47% of them (!), followed by “South East Asia” with almost 13% (=60% Asia), EU-272020-282021 had 8.5%, North America ~7%, Middle East ~4% and others ~20%!
Worth noting is that “South East Asia” had a 16% fall2019-2020 together with EU-28 (~−13%) & North America (−6.5%).
“North East Asia” grew faster, in imports, than the rest, with 5% average rise p.a.2011-2020 followed by “Middle East” with 3.2% & “South East Asia” with 2.7%.
![]()
Figure 4. Development of the Seaborne Trade in 6—main-exporting regions2011-2020. Source: data from ISL (2021).
![]()
Figure 6. Main importing regions2011-2020. Source: data from ISL (2021).
5.4. Which Country/Area Imported More Than Exported?
More important than the export-import volumes—for economists—is the difference between Exports and Imports (Figure 7)—i.e., the “balance of trade”.
As shown, Japan had2004 the higher trade deficit, of 651 mt, followed by USA with 606 mt, “North West Europe” with 423, South Korea 302, China 294 & Spain 150! In 2020 matters changed, however, and “North East Asia” excelled, followed by “North West Europe” & “North America” (Figure 8).
Three important areas produced trade deficits2020: “North East Asia”, par excellence, “EU-28” & “North America”! “North East Asia” stands for 11 countries, including the following 6: Indonesia, Malaysia, Philippines, Singapore, Thailand & Vietnam, considered important for imports.
![]()
Figure 7. The global balance of trade2004. Source: author; data from imports minus exports (2004).
![]()
Figure 8. The Trade balance deficits, in million metric tons2020. Source: data from ISL (2021).
5.5. Which Country/Area Supported Strongly the Global ST?
The 8 stronger2004 sea traders are shown, by adding-up their exports & imports together2004 (Figure 9).
As shown, 8 countries/3 areas created the majority of the ST2004 by exporting/importing, in one year, from 600 million tons to over 1200 each! These were: “North West Europe”, USA, “Middle East”, Japan, China, South Korea, Australia & the “East Coast of South America”. Here has appeared Australia, & the “East Coast of South America”, having among others the important trading countries: Venezuela, Argentina & Brazil!
About 16 years after, in 2020, the protagonists, however, were different than in 2004 (Figure 10)!
![]()
Figure 10. The 8 stronger areas in ST2020. Source: data from ISL (2021).
As shown, the “Middle East” increased its activity by more than 2 times2004, while the “North East Asia” with 6584 m.m.t., or 28.5%, emerged first. It followed by the “South East Asia” 3269 (14.2%), with only a 6% to be achieved by “South America” & a 5.7% by “Oceania”!
ST, clearly, moved massively eastwards in the last 16 years—with Asia to hold an about 43% share—a trend expected to continue in future provided “income per capita” will be rising, as well as the GDPs of the countries involved! The decadence of both EU-28 and USA in ST is clear! The growth of the ST has moved east, no doubt, without perhaps a return!
We will next test certain international trade theories using a simple statistical tool—a linear regression.
6. Part III: Testing the Theory Demanding Specialization in Trade by Exploiting the Abundant Factor(s)
This theory supports the opinion that “each country has to specialize to those products in which it has ‘adequate’ resources”—meaning resources in the proper quantity, quality & cost for export (Figure 11), and then to exchange them!
As shown, only 6 countries, globally, (i.e., France, Spain, South Korea, China, Japan & USA) plus 3 countries in the “North West Europe” area (i.e., Germany, Belgium & Netherlands)—total 9 are laid-up at the left of the 45˚ degrees line, (the orange line drawn by us)! These 9 countries/plus 1 area, are considered poorly endowed with resources, in comparison with their needs! This is so because they have showed2004 a strong inclination towards importing more than exporting!
Moreover, there are 11 additional countries—not appearing in name in figure 11—but which also are laid-up at the left of the 45˚ degrees line. The total is 21 countries/areas.
Important is, that the countries/areas which showed an import inclination/bias, are fewer in number (~37%) vis-à-vis those inclined to “export” more (61%)! Thus the trade specialization has been clearly followed by the international trading countries—by their majority—based on their natural endowments! Practice followed theory!
10Norway, Latvia, Portugal, Cyprus, Slovenia & Croatia.
Next, 2 + 2 countries/areas, in name, are considered to be rich in resources, vis-à-vis their needs, because they are laid-up at the right hand side of the 45˚ degrees line (Figure 11), showing a strong inclination/bias towards exports! These are: Australia, “Middle East”, Indonesia & the “East Coast of South America” (7 countries = 11 total cases)! Moreover, 24 countries/areas fall also in the above category belonging to: “Central Asia” (including Russia, Kazakhstan & other Asian countries = 3 cases), “West Coast of South America” (including 4 countries = 5 cases) etc., & the others10.
Moreover, 1 country-Singapore—laid-up on the 45˚ degrees line, showing that it has not either abundant resources, or lack of them, vis-à-vis its needs! The end result, however, in million tons was balanced: the World exported2004 6759 m.t. & imported 6787 million tons (only a 28 m t difference in favor of imports)!
We will analyze next the global imports & their connection with country’s GDP.
7. Part IV: Analysis of a Country’s International Imports vis-à-vis Its GDP
Stopford (2009: p. 391) run a linear regression in determining the relationship between Importsper country in million tons, & its GDP2004 in $ tr. He found: Y = 0.1105X + 60.199 [1], with R2 = ~0.71 < 1.00, where Y stands for Imports (in million tons) & X stands for the GDP (in $ tr) (Scan 2). The coefficient R2 is considered rather high, explaining the 71% of the relationship!
![]()
Figure 11. Exports versus Imports vis-à-vis the available resources in 57 countries2004. Source: author; a similar figure in Stopford (2009: p. 391) has been corrected by the present.
![]()
Scan 2. A linear regression between countries’ Imports & their GDP2004. Source: modified from that in Stopford (2009: p. 391) .
As shown, France, Spain, South Korea, China, Japan, “North West Europe” (4 cases) & USA (= 10 cases in total), deviated from the regression line by serious imported amounts! In fact, from the 10 countries/areas plotted in Scan 1, by name, the 8 imported more than “can be explained” by their regression line & their GDP2004! These 8 countries/areas were: Spain, Japan, China, “North West Europe”, (including France, Belgium, Germany & Netherlands) & South Korea, while USA & France imported less than it was “justified” by their regression line and GDP2004!
As shown, the 45˚ degrees line, we drew, confirmed that the situation shows strong inclination/bias in favor of a decreasing quantity of imports vis-à-vis an increasing GDP! Only France achieved a rather symmetry between the level of its GDP2004 ($2003b) & the level of its imports (224 m.t.), as being very near to the 45˚ degrees line!
We proceed now to present a couple of other regressions.
8. Part V: Can the “Land Area” &/or a Country’s “Population” Influence Its Imports?
Stopford, (2009: pp. 392-393) , run 2 further linear regressions: 1) one between the “land area” of an economy, & its imports, and 2) one between the “population” of an economy, & its imports:
The determination coefficient R2 in the above regressions are indeed low, meaning that there is either small, or no influence, on imports, of either country’s land area or population! This is perhaps a common sense finding, supporting the idea that it is not how many hectares a country has, but whether these hectares provide any, (and how much), of the 13 products mentioned in Table I1, & at certain adequate quantities & superior qualities compared with other external sources…!
Moreover, it does not matter to have millions of citizens, but what these can produce in an even more productive manner than hitherto… & if they are equipped with technology, are educated, & helped by applied research…
What the Regression between Exports and GDP Tells Us?
11Germany, Belgium, Netherlands, France, USA, Middle East area, Japan, China, South Korea, Australia, Singapore, Spain, Indonesia, South Africa, Panama, Norway, Malaysia, Sri Lanka, Sweden & Finland.
12r = 7620955—20 times 1394.45 times 235.45/20 times 238.97 times 2994.21.
Reading Stopford, (2009): chap. 10) , we were surprised to find-out that an obvious candidate for correlation, i.e., the Exports (on GDP) was missing! We run it ourselves taking into account 20 countries11. The correlation coefficient is given by: r = ∑xy – nxmym/nσxσy [2], where n is the number of the countries, xm the mean of exports; ym is the mean of the GDP; and the 2 standard deviations σx, σy. r found equal to 0.07612 (rounded). This also was low, meaning that GDP does not correlate with country’s exports in any significant statistical way!
Running further the regression between exports & GDP, among the 20 countries, we calculated also the coefficients: a and b: Exports= X = a + b GDP [3] or Exports = X = 224.82 + GDP 0.007595 [4] (Figure 12).
As shown, the regression equation, & its line, confirmed the suspected insensitivity between GDP & Exports—among the 20 countries—where USA dominated again in the scene. Thus, the countries cannot hope to increase their GDP, &, by so doing, to export more, in proportion, in a definite way, but they will surely only import more according to statistical analysis!
9. Part VI: To Trade or Not to Trade? This Is the Question!
Stopford (2009) argued that trade is an activity, which is pursued because it provides profits to the “export-import” merchants! His thinking is rational. For any exporter to obtain a profit there must be a price (FOB), to which if one adds to it the transport & the insurance costs (=CIF price), is lower than the price of a similar good—if exists—of equal quality in the importing country, expressed in the national currency! This is a simple truth.
Exporters obviously add utility to the products produced somewhere, & sold elsewhere, crossing the oceans. Governments know this, and try—if they are allowed—to “make” CIF prices > than the similar Prices within their borders! They add tariffs, using also several other mechanisms & quotas, using also the “regulated” parity of their currency… so that to prevent, or restrict, imports!
When we talk about Prices, in fact, we mean—apart from the profits—also the quantities & the rewards of the means of production, which first economists called “coefficients of production”. However, they thought them wrongly to be only 3—land, labor & capital! This distinction brought many calamities to humanity, we believe, because the question emerged at once as who creates the “value”…& thus who is “entitled to take it home”… Land obviously creates extra value, as it needs say $10,000 per acre to provide perhaps $20,000 in production!
Latter economists called the coefficients of production “inputs”, i.e., all factors used in production, & as a result the coefficients became many as they should (Graph 6) from the start.
![]()
Graph 6. The modern main inputs of production. Source: author.
As shown, the main ingredients, for one to produce, are many! In fact, we added the cost of energy—we should not expect the “Russian-Ukraine” war to appreciate the importance of this! Also, we added the cost of restoring the environment—& here we should not expect the “climate destruction” to include this into the production function! Further, we added the cost of restoring Peace—where we should not expect the “Israel-Palestine” war & the “Russia-Ukraine” one, to appreciate its importance! Without this ingredient—the Peace—production & business as usual, as well life, are not possible!
10. Conclusion
Our world became eventually more & more complex, and more than a dozen issues cropped-up recently, since 2009, and played such an important role, which caught our attention away from economics!
The expansion of the ST rested on 5 very simple principles: 1) the low FOB prices; 2) the increased production for exports; 3) the import of machinery & technology to boost exports; 4) the low CIF prices; 5) the favorable foreign exchange parities for exports!
Economists—most strange—when they supported economic growth of a specific country, in fact, they supported… the gradual departure… from the country—in the long term—of all its “traditional industries”! The mobility has been towards such countries, which offer mainly a lower cost, & a favorable foreign exchange parity!
One may consider economists irrational… by suggesting to make citizens wealthier, as time goes by, & then to “ask them”, indirectly, to abandon their traditional industries because they became less competitive in the meantime, and to rest thereafter heavily on… imports from foreigners!
The list below is impressive:
As shown, China took2004 the 5th position in all the above 4 statistics! The lack of oil & iron-ore was responsible for the above Japanese situation, we believe. Moreover, the trade deficits came clearly from the excessive imports.
Economists, unlike Malthus (1766-1834), cared almost exclusively, after Keynes in 1936, about the effective demand of the millions of the emerging customers/users, e.g., from the heavily populated areas of China & India (Goulielmos, 2020b) ! Is, e.g., Greece capable to accommodate, say 40 m tourists, (double than hitherto2022), from China, India and from elsewhere, in future as the increased populations there indicate?
Nowadays, there is also the elimination of humans…carried-out so far by the… Climate per se, & by the local wars! The number & the entire cost of such victims are not as yet known…
An obvious repercussion from the changes in population is to allow pensioners to work after their final pension year—if so they wish—up to their life expectancy (say the 80 years of age), without any penalty as hitherto! This may lead to an improved pension, & save the relevant pension funds at the same time!
There must be a new branch of economics, we propose: i.e., the “Old-Aged economics”! Humanity goes fast towards fewer children, & thus fewer nurseries-secondary schools-high schools, fewer teachers, & a greater number of old-age houses, hospitals specializing in old age, dentists for old, old age hotels, & resorts, cruises, etc. This new branch of economics will deal with how a pensioner has to spend his/her pension &/or his/her savings in the best possible economic manner…!
Perhaps, in the distant future, massive population movements—apart from the massive migration in force for certain decades by now—will occur towards…the “Sub-Saharan Africa”-S/SA, we believe, obtaining a passport, & visa, and plenty of land! There are 53 countries in S/SA, including the beautiful “Ivory Coast” and “Seychelles”!
13It is an excellent idea to classify the worldwide cities by creating a grading system—which must have weights—for certain characteristics: like reduced pollution, low frequency of fires-floods-drains - terrorism attacks - earthquakes - car accidents - crimes & other negative activities; a grade for safety, drug users, 5G, Internet, AI, efficient transportation, high level education, high defense, high level of political & social stability, peace & reduced bureaucracy, a strong banking system, proper & fast justice-appointing system & of low corruption, & similar properties, so that a person to be able to choose the smart city to which he/she wants to work-in!
Surely, the world became a village, & the citizens of one village are free to go from one place of the village to another, seeking the ideal conditions to spend the rest of their life, or even their whole or part of their working life, nowadays where a job can be done from a distance, as the last pandemic has taught us! Research13—in progress—showed which cities are globally best to work-in called “smart or green” ones! People will go there!
Very interesting is the example of the international shipping where the nationality of the entrepreneur remains as used to be, while…the nationality of labor, finance, cargoes & markets are…international! Important is, however, for us, the nationality…of profits! This is a subject needing further research14!
The linear regressions confirmed the theory that countries with serious natural endowments, (abundant quality resources), specialized (or had to) in products—used them intensively par excellence. Moreover, they exported2004 them, (to the extent from 200 to 1100 million tons), while imported relatively less products as a result (from 0 to 200 million tons maximum2004)!
Clearly the sign of the regression, (imports versus GDP), by being positive, meant that “the higher the GDP, the larger the quantity of goods that will be imported”—by the majority of the international countries/areas—but at a decreasing pace, with the exception of France!
USA2004 showed a radically different pattern from the rest of the international countries over the way of handling its imports (956 mt; 16%) vis-à-vis its GDP (~$12tr; 38%)! USA’s imports seem substantially lower in comparison with its rather enormous GDP2004!
We may warn, however, scientists using statistical tools involving means & variances, which are affected by the extreme values—like the GDP of USA… If we get—USA—out from the regressions presented then the GDPs will correlate almost perfectly (near 100%) to the imports of the countries! This finding must be noted by the reader meaning that the majority of the economies depend heavily on their imported goods!
14Our opinion is that if manufacturing is destined to move to other more profitable countries/locations for matters of cost, and perhaps safety, of favorable legislation, of cheap & efficient labor, etc., we do not reject such a possibility, provided the profits of the manufacturing to return—one day—to the home country! Certain Greek ship-owners, (Onassis; Niarchos; & others), & other entrepreneurs have done that—and this is one subject of one of our prospective papers…
It seems that it does not matter—statistically—whether a country is large in hectares, or highly populated in millions, in order to import great quantities of products. Moreover, it does not matter to have a substantial GDP to excel in exports! Exports seem to depend on the GDPs of the rest of the global community excluding our economy!