Mapping and Botanical Study of Pressures Causing Mangrove Dynamics of Tiko (Southwest Cameroon) ()

1. Introduction
The regressive dynamics of forest cover has been a problem at the center of scientific concerns since the end of the 19th century. This regression is more accentuated in the intertropical zone where the Congo Basin forest develops. This extent is deteriorating significantly in the Democratic Republic of Congo, Cameroon and Congo (COMIFAC, 2010) [1] . The decreasing evolution of the forest does not exclude the vegetation cover of mangrove, which develops in the tidal swing zones of tropical and subtropical latitudes. Indeed, the extent of the world’s mangroves is continuously decreasing over the years (FAO, 2005 [2] ; Spalding and al, 1997 [3] ; Spalding and al, 2010 [4] ; Giri and al, 2010 [5] ). According to the FAO (2005) [2] , this cover fell from 152,000 km2 in 1980 to less than 116,000 km2 in 2005, with an accentuated regression in 1980 (i.e. an annual loss of 1850 km2), contrary to the trend observed in 1990 (decrease estimated at 1185 km2) and in the interval from 2000 to 2005 (loss of 1020 km2). However, the decline in mangrove areas differs from region to other, and depends on natural and human factors. The results of the study conducted by Nathan T et al. (2017) [6] illustrate an accentuated loss of cover in Southeast Asia, due to the intensive development of aquaculture and coastal erosion catalyzed by human activities. These results also show a trend of mangrove expansion in latitudes between 30˚N and 30˚S around the equator, especially in Central America and Australasia where successful regeneration is observed in large areas. This progressive advancement is very little observed in the regions of Southeast Asia and Central Africa, which are marked by an accentuated degradation of the mangrove cover.
In 1992, the Commission of the European Community estimated the area of mangroves in Africa and Madagascar at around 32,000 km2, i.e. 27,000 km2 in West Africa, 3000 km2 in Madagascar and 2000 km2 in East Africa. In West Africa, several countries have a mangrove area greater than or equal to 2500 km2. These include Nigeria (9700 km2), Senegal (4400 km2), Guinea-Bissau (2500 km2), Guinea (2500 km2), and Cameroon (2500 km2). According to the FAO (2007) [7] , the degradation of the mangrove varies greatly depending on the country. This contrast can be observed precisely with the mangroves of Nigeria and Cameroon. With regard to the mangroves of Nigeria, they regressed slightly between 1980 (9977 km2) and 2005 (9970 km2), unlike the mangroves of Cameroon which in the same interval decreased from 2720 to 2500 km2.
The development of Cameroon’s mangroves has been the subject of many studies between the decade 2010-2020 (Minep, 2010 [8] ; Nfotabong, 2011 [9] ; Mbevo and al, 2017 [10] ; Zogning, 2014 [11] ; Zogning, 2021 [12] ; Minepded-RCM, 2016 [13] ; Yemmafouo and al, 2017 [14] , Kana and al, 2019 [15] ). Most of this research was carried out in the mangroves around the Wouri estuary. These studies are based on the method of diachronic analysis that makes it possible to illustrate exhaustive results on the dynamics of spatial occupation of the mangrove. The results of the work of Yemmafouo and al (2017) [14] show a regression of the Douala mangrove which fell from 151.63 (in 1975) to 112.58 km2 in 2016. The same is true of the research carried out by Kana and al (2019) [15] which highlight the dynamics of spatial occupation of plant cover near the cities of Douala and Tiko. In addition, the results of the studies doing by Mbevo and al (2017) [10] also present results on the recent evolution of the Mabé mangrove reserve, which has declined by 103 hectares in 28 years. This study is part of this same reasoning insofar as it uses the method of diachronic analysis of landsat images with a view to illustrating the spatial evolution of the Tiko mangrove between 1976 and 2016. It is main question in this research not only to show the dynamics of the Tiko mangrove during the previous five decades, but also to determine the main factors of this degradation.
The interest of the research is declined on the scientific level (improvement of scientific knowledge on the evolution of the locality’s mangroves between 1976 and 2016), socio-economic (raising awareness on the degradation of the mangrove which in addition to play a role of coastal protection, constitutes an ecosystem exploited for fishing, collecting, collecting wood, etc.). The interest is also declined on biological (the vegetation constitutes a spawning and nesting area for aquatic fauna. Its degradation leads to a loss of habitat and consequently a reduction in the aquatic fauna indigenous to the mangrove) and ecological (through photosynthesis, the plants of the mangrove contribute to the regulation of the local climate and to the fight against climate change. The deteriorating of mangrove favors the appearance of harsh microclimates, a release of carbon dioxide and as a consequence a deterioration of the ozone layer). In addition, the results of this research constitute important data for better governance of the mangrove by decision-makers.
2. Study Area and Methodology
2.1. Study Area
The Tiko mangrove which is the subject of this study is located in the South-West region of Cameroon, more precisely in the department of Ndian where it is located between latitudes 3˚57'30N - 4˚17'30E, and the longitudes 9˚17'30E - 9˚28'30E. This expanse is limited to the north by the town of Tiko that is surrounded by several agricultural plantations. The ecosystem extends to the northeast boundary of the mainland that is located at Mudeka. In the southern part, the mangrove is restricted at the level of the marine influence. It is separated to the east by the district boundaries of Dibombari (in the Moungou) and Bonabéri (in the fourth district of Douala) respectively. Figure 1 shows this location of the mangrove, which occupies an area of 387.15 km2. The mangrove environment is recognized in the intertidal zone that is made up of hydromorphic soils. The environment receives significant precipitation and temperatures, the annual averages of which are respectively between 1700 mm and 26˚C. This boundary is occupied by a cosmopolitan population whose total number was 117,884 inhabitants in 2010 (Bucrep, 2010) [16] .
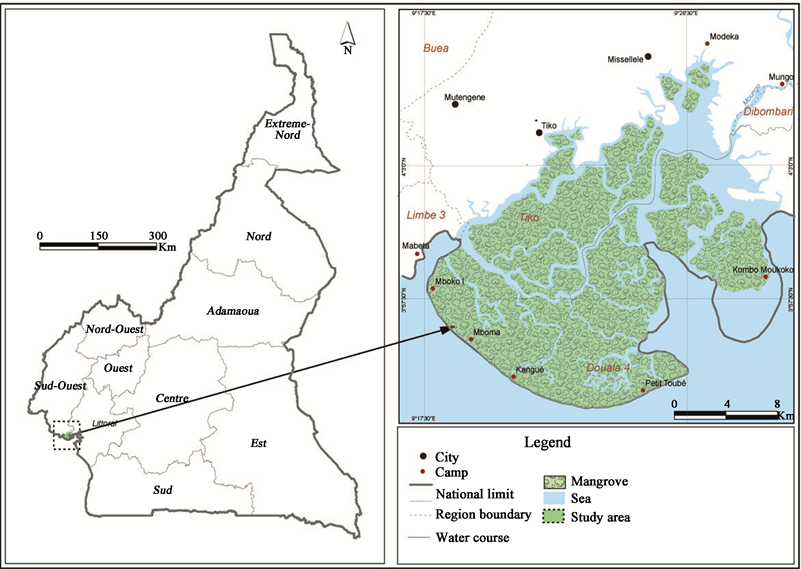
Fulbert Rodrigue ZOGNING L (2017).
Figure 1. Location map of the study area.
2.2. Methodology
2.2.1. The Data Collection
Data collection was done in several stages. The research required a bibliographic quest and a download of Landsat images, respectively from the MSS (1976), TM (1986), TM (1996), TM+ (2006), and ETM (2016) sensors. This acquisition of bibliographic and satellite data go before the field descent phases (for verification of the results of the cartographic analysis) and the field survey were carried out. A survey document was sent to local mangrove users and to public and private operators concerned with local development and sustainable management issues. This survey document was used to collect specific information (knowledge about the mangrove, perception of its evolution, development strategies, consequences of use and strategies for sustainable management of the mangrove). The collection of field data was carried out in 37 neighborhoods distributed in urban, peri-urban areas and camps.
2.2.2. Data Analysis and Interpretation
The data collected was analyzed separately. The processing of cartographic data required the use of specific software (Quantum GIS 1.8; Adobe Illustrator 11 and Envi 4.7). The landsat optical satellite images used are shown in Table 1 below.
The specificity of the data in the previous table involved geometric processing operations (to match each pixel of the ortho-images to the same elements on the ground) and radiometric processing (to bring together the information from different images into a single common representation in order to preserve in this one, the best spectral information of each image. The operation consisted of red-green-blue coding and principal component analysis). It is at the end of the previous corrections that the actual data analysis was carried out according to the NDVI method (vegetation index) which involves the calculation of the electromagnetic bands of red (R) and near infrared (PIR). This index is calculated by the formula below:
With NDVI = Normalized Difference Vegetation Index; PIR = Near Infrared; and R = Red
The use of the NDVI index is linked to the fact that it not only makes it possible to illustrate vegetation dynamics, but also to distinguish and classify land cover (Patakamuri and al, 2014) [17] . The results of the analysis chosen the gathering of the images obtained, the calculation of the areas of the different layers and the development of land use maps for each of the periods.
2.2.3. Botanical Records Data
Botanical surveys were carried out in order to identify the main woody species of the mangrove, and to assess the dynamics of plant populations according to the stages and types of disturbance. These surveys were carried out in three transects established respectively within a dense mangrove, a moderately disturbed mangrove and a degraded mangrove. Because the botanical survey focused entirely on woody stands, transects 100 m long by 10 m wide (1000 m2) were established. Each transect was subdivided into two plots 50 m long by 10 m wide, before these were again subdivided singly into 2 sub-plots 25 m long by 10 m wide each. The plots were subdivided in order to facilitate surveys in the different landscape.
The dense mangrove transect was defined in an area surrounded by a complex of creeks (Bimbia creek to the North, Matumal creek to the South and Mabeta creek to the East). The location was chosen because of the group of small creeks
![]()
Table 1. Data downloaded for the diachronic analysis.
Data source: Global landcover facility.
that simplified movement in these hydromorphic spaces and controlled by stilt roots reducing accessibility to the various sites.
The slightly degraded mangrove transect was established perpendicularly 500 meters from the Kangué camp; while the significantly degraded mangrove transect was delineated in the forest landscape behind the Akra-kombo Camp.
The botanical surveys were also used to identify the dissimilar families of species in terms of plenty and domination. Due to the lack of an appropriate tool for measuring tree heights, the study only measured the diameters at chest height of individuals of each species represented in the different sub-plots.
The statistical processing of the statements made it possible to characterize the floristic composition of each plot. Classes of specific diameters that vary from 1 to 40 cm have grouped individuals of the same family. The calculation of the basal area made it possible to identify the most important species in terms of spatial occupation (domination). The basal area (G) of the stand of each transect was calculated by summing the basal areas of the N trees per hectare constituting it.
With G = the basal area of a class of n individuals; n = the number of individuals in the class; and d = the diameter of the class.
3. Results
A Deteriorating of the Tiko Mangrove
The results of the processing of the landsat images used illustrate a spatiotemporal dynamic of the Tiko mangrove. This evolution is characterized by the progressive development of degraded vegetation in an environment previously represented by virgin mangroves. This dynamic classification can be seen in Figure 2 and Figure 3.
Figure 2 and Figure 3 illustrate the occupation dynamics of the Tiko environment, which extends over an area of 529.3 km2 (i.e. 142.15 km2 of land area where the continental forest develops, and 387.15 km2, which constitutes the area of the mangrove located in the marine part).
With regard to the environment of the mainland, the illustrations show five main landscape, namely dense forest, degraded forest, much degraded forest, buildings and cultivated areas. The 1976 design is only dominated by dense forest (68.3 km2) and slightly degraded forest (51.1 km2). These statistics show an abundance of forest cover in relation to anthropogenic activities that extend over 22.75 km2. According to the illustrations in the previous figure, the situation of the continental surface observed in 1976 is constantly changing over the years. Those changes are usually characterized by the loss of the forest surface that decreases from 119.3 km2 to less than 10 km2 in 2016. In the same interval, study detect an increase in the built surface area, which evolves from 4.2 km2 in 1996 to 36 km2 in 2016. The same is factual of agricultural areas that evolve from 18
![]() Source: Data Landsat MSS (1976), TM (1986) TM (1996), TM+ (2006) and ETM (2016).
Source: Data Landsat MSS (1976), TM (1986) TM (1996), TM+ (2006) and ETM (2016).
Figure 2. Occupation of the Tiko environment between 1976 and 2016.
![]() Source: Excerpt from Figure 2.
Source: Excerpt from Figure 2.
Figure 3. Diagrams of the occupation of the Tiko environment between 1976 and 2016.
km2 in 1976, to about 120 km2 in 2016.
In the area of marine regulation, the mangrove that develops over a total area of 387.15 km2 is also delineated in several landscapes. The dense mangrove (275.4 km2) is therefore clearly distinguished from the slightly degraded mangrove (102.9 km2) and the significantly degraded mangrove (8.1 km2). These three dominant units observed in the mangrove environment of 1976, evolve significantly over the years since the following annual intervals show a loss of the mangrove, through the reduction in the extent of the dense cover (less than 2 km2 in 2016). In the same case, study observed an increase in slightly degraded (151 km2 in 2016) and greatly degraded (131 km2 in 2016) mangrove areas. In the marine area dominated fully by mangroves in 1976, the illustrations show the appearance of constructions over the decades. Table 2 illustrates this dynamic of changes observed in the environment of Tiko between 1976 and 2016.
Table 2 shows the degradation of natural environments and an increase in constructions and anthropogenic activities. In the marine part where the mangrove develops, the study notes a permanent regression of the cover. This continuous degradation translates into a loss of 102.4 km2 of mangroves in the period from 1976 to 2016. In the same dated, the study records an increase (9.5 km2) in the surface covered only by water. This representation is materialized by the development of water frames around the mangrove. The same is accurate of constructions that evolve from 0 to 16 km2 between 1976 and 2016. In the terrestrial part where the continental forest develops, there is also a loss of 115.4 km2 of forest cover between 1976 and 2016, while the agricultural area increases by 96.6 km2 over the same period. The same applies to the surface area of buildings, which
![]()
Table 2. Summary of changes in Tiko’s environment between 1976 and 2016.
Source: Figure 2.
increased from 4.2 km2 in 1976 to 20 km2 in 2020. The degradation of the mangrove already highlighted in Table 2 is further justified in Table 3 that presents the average structure of the cover by level of degradation.
According to the data in Table 3, the number and middling diameters of the main plant populations of the Tiko mangrove significantly differ according to the levels of disturbance. The table presents three mangrove landscapes namely dense cover, slightly disturbed mangrove and considerably degraded vegetation. The table presents two main families, namely the Rhizophoraceae (Rhizophora racemosa and mangle species) and the Avicenniaceae (avicennia germinans species). With regard to the illustrations in the table, the Rhizophoraceae constitute the dominant family in the dense mangrove sites. They are also the most affected stands in disturbed facies.
Table 3 shows a predominance of rhizophoraceae (261, 185 and 84 individuals) over avicenniaceae (73, 66 and 55 individuals), respectively in the dense, weakly disturbed and considerably degraded mangrove landscape. This relative dominance is linked to the morphological and physiological characteristics of Rhizophoraceae, which favor their development in the intertidal zone.
Table 3 also shows a trend towards the reduction of plant populations according to the stages of development. Individuals with small diameters (0 - 10) dominate in the 3 main landscape, unlike individuals in the intermediate (10 - 20, 20 - 30) and upper (30 - 40) classes. The table also shows a low disturbance of the species Avicennia germinans compared to rhizophoras. Referring to the sum of the individuals presented in the table, the loss is less significant in the species avicennia germinans (only 18 individuals) than it is in the rhizophoraceae plants (177 individuals). This mainly observation is also illustrated at the level of the basal area occupied by these main plant populations inventorying in the different facies of the mangrove. In the three stages, namely the dense mangrove, the moderately disturbed stand and the cover under high pressure, the basal area decreases by around (1.4), (1.3) and 1.2 m2/ha for the species Avicennia germinans; and (6.3), (3.8), and 1.6 m2/ha for the rhizophora family.
![]()
Table 3. Average structure of the Tiko mangrove by level of degradation.
Source: field surveys.
4. Discussion
4.1. The Main Factors of Mangrove Degradation
With regard to mangrove degradation in most countries around the world, there is no doubt that population growth and marine pollution are the main causes identified in almost all regions (Spalding et al., 2010) [4] . They are distinguished from specific factors that vary from one region to another. In most countries of Southeast Asia, the practice of aquaculture and rice cultivation widespread in most countries such as Indonesia (WRM, 2013) [18] , Malaysia and Thailand promotes a strong degradation of the cover (Mazni and al, 2018) [19] . In West (Bassene and al, 2013 [20] ; Boubacar and al, 2018 [21] ) and central africa (Okanga-Guay M and al, 2019) [22] , the degradation of mangrove cover seems to be mainly linked to the activities such as the exploitation of wood and fishery resources (fish, sand, salt).
4.1.1. Population Growth and Agricultural Development of Tiko
The occupation of the environment of Tiko is linked to historical factors (colonization and agricultural development) which favored immigration (internal ethnic groups of various origins and neighboring countries) to the locality of Tiko in search of employment in plantations, and for the development of trade.
Colonization has played an important part in the spatial and temporal evolution of Tiko’s environment. Indeed, the Germans by developing agricultural plantations favored an occupation of Tiko by a cosmopolitan population. This demographic growth intensified during the British government, which, in addition to boosting the increase of plantations and the creation of the Cameroon Development Corporation (CDC), also led to an economic flourishing catalyzed by the construction of road, airport and others infrastructures (Mbala Paul, 2009) [23] . These factors have favored population growth, the saturation of the land surface and the progressive exploitation of the peri-urban mangrove for constructions, fishing, exploitation of sand and wood.
The locality of Tiko, which covers an area of nearly 529.3 km2, is home to an ever-growing population as in most cities in sub-Saharan Africa. The population of Tiko increased from 64,478 hts (1987), to more than 117,884 hts (BUCREP, 2010) [16] . This population is settled in a small space with regard to the spatial delimitation of the locality (in the marine part, the mangrove develops over 387.15 km2. The continental surface is partially dominated by plantations that extend over 99.5 km2. The site faithful to construction is very small for an ever-growing population, which is therefore forced to occupy and exploit the mangroves of the intertidal zone). It is especially since the end of the 19th century that this trend has been on the increase. Indeed, the smallness of the site of the continental facade and the importance of the agricultural plantations of the continental part, catalyze the expansion of the populations towards the spaces occupied by the peri-urban mangrove. Figure 4 illustrates a comparative evolution of the surface of the building and the mangrove respectively in the period of 1976
![]()
Figure 4. Comparative evolution of built and mangrove surfaces between 1976 and 2016.
and 2016.
The figure illustrates a temporal increase in built area and a simultaneous reduction in mangrove cover. This link makes it possible to justify an influence of population growth on the evolution of the initial mangrove surface. This influence does not necessarily materialize through the growth of buildings to the damage of the mangrove. Indeed, it is in the peri-urban area (Moukoro beach, Missellele, Mudeka districts) and along the coastline (Mabeta, Mboko, Mboma, Kangué, Toubé, Cap-Cameroun, Kombo Moukoko camps) that is observed, a development of homes in the environment of the mangrove. The regressive evolution of the ecosystem is partly reflected in the activities that are consequence to population growth. The critical social status of the communities that settle around the mangroves encourages abusive exploitation of the resource.
These results corroborate with the studies of Mainet (1981 [24] , 1985 [25] ) who also highlighted the influence of colonization and economic development (construction of various infrastructures: port, airport, roads, industries), which favored population growth and an occupation of the marshy zone, seat of development of the peri-urban mangroves of Douala. This anarchic spatial growth of the major economic cities of Cameroon, which are gradually colonizing the mangrove environment, is also highlighted in the work of Yemmafouo and al (2017) [14] , Kana and al (2019) [15] .
4.1.2. The Development of Hypothetical Fishing and the Exploitation of Mangrove
The development of theoretical fishing and the exploitation of mangroves are also factors that justify this trend of abusive exploitation of the natural environments of the mainland and the mangroves located between the sea and the land surface. This factor of the anthropization of the mangrove is emphasized in most studies carried out in the coastal zone of Cameroon (Din, 2008 [26] ; Ajonina, 2008 [27] ; Feka and al, 2011 [28] ; Dzalla, 2013 [29] ; Zogning and al, 2021 [30] ). Indeed, the critical social status and the search for plots of land force the migrant population to gradually settle in the mangrove that would otherwise be a good with free access. The new human groups that settle in the mangrove mainly exploit the cover for the processing of fish products by smoking. Rhizophoraceae (red mangrove) are the stand used for construction, heating and smoking. This species is exploited at all stages of development. Individuals with large diameters are prized in the mainland where the trunks are subdivided into logs and or delineated according to use. In the camps, the individuals of small diameters are extensively exploited compared to the large trees. This stem collection activity carried out by groups of women and children allows the processing by smoking of fish and shrimp that are brought back from the high seas by groups of men. Due to the lack of electricity in the camps, processing by smoking is the main method of preserving fish products.
The excessive exploitation of vegetation results in the non-selective cutting of woody species in most facies near dwellings and in sites far from camps. This crazy cutting is linked to the ever-increasing demand for mangroves. Photo 1 illustrates the main livelihood activities behind the abusive exploitation of the Tiko mangrove.
Photo 1 presents the main activities carried out in the Tiko mangrove environment. These include constructions and subsistence activities such as logging (photos C and D) and fishing. The constructions there require the destruction of the mangroves for the building. Indeed, these woody plants are used as supports for the raised floor and the walls of the huts (photo B). In addition, the mangroves are also cut down and sold to households in the peri-urban and urban areas. The red mangrove, which is usually sold, is distinguished from other species by its high calorific property to burn even in the fresh state. This wood, which is also the main species of the locality (in terms of both profusion and domination), is also exploited for the construction of traditional huts. The occupation of the mangrove is complemented by the exploitation of the plant cover near the dwellings (photos A and F). With regard to the exploitation of sand, which is a lucrative activity carried out in the subsoil of the mangrove; it promotes the release of deposits essential to the accretion of mangrove soils. Guiral (1994a [31] , 1994 [32] ), showed the importance of sedimentary deposits in the formation and balance of mangrove substrates.
4.1.3. Lack of Support from Public Authorities
The conversion of mangrove cover into habitats is also linked to the weak application of specific policies and actions for the sustainable management of a common good with free access. In addition, Law No. 96/12 of August 5, 1996 on environmental management does not contain specific articles on the modalities of mangrove management. Indeed, article 94 of the said law that stipulates that “mangrove ecosystems are subject to special protection which takes into account their role and their importance in the conservation of marine biological diversity and the maintenance of balances coastal areas”, does not define the methods of

Photo 1. Illustration of some activities involving abuse exploitation of the mangrove.
managing the ecosystem. During the sub-regional forum on community management of mangrove ecosystems in Central Africa (COMIFAC, 2017) [33] , panelists from Cameroon and Congo further highlighted an implicit marginalization of mangrove ecosystems in legal and policy instruments.
Several problems reduce better implementation of the policies and strategies that are set up for the sustainable management of Cameroon’s mangrove ecosystems (FAO, 2006) [34] . The strategic management axes that are clearly defined are not implemented, one of the difficulties being the diversity of actors and decision-makers who are defined as responsible for the management of a vegetation cover at the crossroads of natural and administrative boundaries. This arrangement is justified by the presence of urban town halls (Tiko, Douala 4th, and Limbé 3) and specific ministries (Ministry of Forests and Wildlife, Ministry of the Environment, Nature Protection and Sustainable Development, Ministry of Fisheries and Animal Industries, Ministry of Territorial Administration…) which do not always act in consultation. As a result, controversies ensue that promote conflicts of attribution of responsibilities and, as a corollary, a weak operationalization of strategies for the sustainable management of the cover. This trend is an asset for the local population who exploit the mangroves.
4.2. The Originality of the Research Compared to Recent Studies Carried out in the Mangroves around the Wouri Estuary
The results of this study globally illustrate a degradation of the forest of the continental part and the mangrove that develops in the zone of marine influence in the south of the study area. With regard to the dynamics of the Tiko mangrove, which is the main theme of this study, there is an overall loss of cover of 102.4 km2 between 1976 and 2016. This means that the Tiko mangrove cover has decreased from 387.15 km2 (MINEP 2010) [8] to 284.75 km2 over the past four decades.
This study stands out from the others because it illustrates recent data on the dynamics of the Tiko mangrove by referring to the delimitation of the mangrove made by the Ministry of the Environment, Nature Protection and Sustainable Development from Cameroon. Mbevo and al (2017) [10] studied the Mabe mangrove reserve, which formal one of the areas of the Tiko mangrove. The results of this study show an initial extent of mangroves estimated at 417.41 km2 in 1986 and 360.30 km2 in 2014. This study highlights a loss of 57.10 km2 between 1986 and 2014. The study by Kana and al (2019) [15] also shows the usefulness of multi-sensor imagery which is used for mangrove monitoring of the Wouri estuary in Cameroon. These results estimate the mangrove of the Wouri estuary at 910 km2, and also highpoint a regressive dynamic of 74.54 km2 of cover over the last three decades. The study also illustrates a decrease in the Tiko mangrove, which would have gone from 113.10 km2 to 112.03 km2. Table 4 presents this recent dynamic of the mangrove around the Wouri estuary that is illustrated by these different authors.
Table 4 illustrates the statistical trends on the recent dynamics of the Cameroon
![]()
Table 4. Statistical data on recent mangrove dynamics around the Wouri estuary.
estuary mangrove. This table makes it possible to observe the precision of our study, which presents defined figures of the losses recorded in the cover at ten-year intervals, and for a long period that extends from 1976 to 2016. This research also makes it possible to observe the rhythm evolution of the losses that are accentuated with the passing of the decades. In particular, a significant loss of mangrove cover is observed in the period 2006-2016, while the decades prior to this date are characterized by a reduced regression. In addition, the initial area of the Tiko mangrove as presented in this study (386.4 km2) happens to be practically the same as that presented in the Minep report (2010) [8] which estimated the total area of this extended to 387.15 km2. In addition to being a more recent study, this research differs from that of Mbevo and al (2017) [10] in its duration and precision. It also differs from the study carried out by Kana and al (2019) [15] which does not present dynamic statistical data on the evolution of the vegetation covers of the mangrove that are highlighted. As shown in Table 2, this study presents recent mangrove dynamics without illustrating earlier spatiotemporal estimates of these specific mangrove covers. The same applies to the study area, which concerns all the mangroves around the Wouri estuary, and not just that of the Wouri estuary. The Tiko mangrove is mainly underlined in this research. The botanical surveys carried out in this research further justify this originality of the study in relation to the above-mentioned research, which focused exclusively on the diachronic analysis.
5. Conclusion
The main objective of this study was to show the dynamics of the Tiko mangrove between 1976 and 2016. The results of the study reveal a progressive degradation of the mangrove, which is characterized by an increasing spatial occupation. Over the past 5 decades, virgin mangrove vegetation cover has declined from 275.4 to less than 10 km2. This loss is justified by the increase in slightly and considerably degraded mangrove areas that in the same interval evolve respectively from 102.9 to 153 km2, and 8.1 to 131 km2. The analysis also shows a constantly evolving spatial occupation, particularly with regard to constructions (4.2 km2 in 1976 and 36 km2 in 2016), and plantations (18.4 in 1976 to 120 km2 in 2016). The degradation of the mangrove is justified by several factors. These include population growth, which certainly leads to spatial occupation in a reduced site and considerably occupied by agricultural plantations on the land. Moreover, economic development, the prevailing poverty due to unemployment and the low diversification of lucrative activities, promote not only the development of the mangrove for construction, but also and above all the exploitation of the cover which is a source of socio-economic income economic. In addition, the absence of specific legislation on mangroves and the conflicts of attributions between the various public and private services, further encourage the abusive exploitation of the vegetation cover.