Determination of upper reference value of urinary calcium-creatinine ratio for the paediatric population in Burdwan district ()
A genetic study was carried out on spadefoot toads (Pelobates syriacus) from habitats of various locations and altitudes in northern Israel. Cytochrome b and 12S were amplified by PCR for the analysis of genetic variation based on five DNA polymorphisms and for RAPD PCR. The nucleotide sequences of the mitochondrial DNA fragments were determined from a 460 bp clone of cytochrome b and a 380 bp clone of 12S (GenBank accession numbers, FJ595199-FJ59- 5203). No genetic variation was found among the populations with regard to 12S. According to the analysis of five sequences using Arlequin software, there was a high gene identity among the populations (98.7% - 99.6%). Both populations, Elrom Pond breeding site, at the highest altitude and Fara Pond, at the lowest, had the lowest identities as compared to other populations. The DNA variation among P. syriacus populations from various breeding sites, according to band sharing (BS), when using the OP-4 primer, was 0.92 - 1.00. Similarity was low between the population of Elrom Pond and the populations of Kash Pond, Raihania Pond and Sasa Pond (0.92 BS), as well as between the population of Fara Pond at the lowest altitude, and the populations of Kash Pond, Raihania Pond and Sasa Pond (0.92 BS). Similar results were obtained when comparing the results obtained using primer OPA-3. The lowest similarity was found between populations of the highest altitude (Elrom Pond) and lowest altitude (Fara Pond), relative to the other ponds (Kash Pond, Raihania Pond and Sasa Pond) with a BS of 0.93.
1. INTRODUCTION
Spadefoot toads (Pelobates syriacus) are distributed in: Azerbaijan (syriacus), Bulgaria (balcanicus), Greece (balcanicus), Iran (syriacus), Iraq (syriacus), Israel (syriacus), Lebanon (syriacus), Romania (balcanicus), Russia (syriacus), Syria (syriacus) and Turkey (syriacus). They belong to Pelobatidae, with only one genus, Pelobates, which contains four species [1-3]. Dzukic et al. [3] reported that the distribution range of P. syriacus in the Balkans is much larger than the previously known, rather compact but disjunctive. The range of P. fuscus penetrates deeply into the Balkans, but has a rather fragmented distribution. The systematic relationships among Pelobates species have recently been studied by GarciaParis et al. [4]. They showed that a P. cultripes-P. varaldii clade is sister to a P. fuscus-P. syriacus clade. Eiselt [5] even considered P. syriacus to be a monotypic species. Ugurtas et al. [6] suggested that P. Syriacus comprises at least three taxa: P. s. syriacus, P. s. balcanicus and a third lineage that they collected in Serbia Eggerti et al. [7] studied the phylogeographic structure in P. fuscus from 16 localities throughout Europe using mitochondrial cytochrome b gene sequence analysis.
Different aspects of biology, ecology and genetics of P. syriacus in Israel, at the southern border of its distribution, have been described. The distribution and habitat selection of the ponds were related to water availability during spring and the beginning of summer [8], larval growth and complete metamorphosis [9,10], burrowing behavior [11], physiology adaptations to various environments [12,13], biology and life cycle [14-16] and genetic variation among populations [17,18]. Nevo [17] suggested that Pelobates is best explained by the environmental variability model based on selection for homozygosity, as an adaptive strategy, in the relatively constant and narrow subterranean niche. This hypothesis is derived from experiments on proteins of the spadefoot toads, P. syriacus and P. cultripes, from Israel and Portugal encoded by 32 gene loci, that were analyzed electrophoretically.
In the present paper, we use molecular sequence data of mitochondrial genes to analyze the genetic variation of P. syriacus populations from various breeding sites in northern Israel.
2. MATERIALS AND METHODS
2.1. Specimens
In order to analyze P. syriacus populations from various areas in northern Israel, five P. syriacus specimens were collected from each population. The tissues were studied by mitochondrial sequence analysis. As previously described by Degani [10], sampling of specimens was carried out randomly from the entire area of the water body by hand net or collected from the area surrounding the five breeding sites of P. syriacus in northern Israel (Figure 1 and Table 1).
2.2. DNA Extraction, Amplification and Sequencing
Genomic DNA was extracted from ethanol-preserved tissue samples (clipped or whole tail of larvae) with the QIAamp DNA Mini Kit that employed proteinase K lysis on the tissue, as well as specific DNA binding to the QIAamp silica-gel membrane, through which contaminants pass. DNA samples were visualized after electrophoresis on a 0.8% agarose gel, stained with ethidium bromide. DNA concentration was measured using Nano Drop 100 (ThermoFisherScientific, Wilmington, DE, USA).
DNA of Pelobates cytochrome b and 12S was amplified by PCR and analyzed by RAPD PCR. Primers for DNA amplification of 12S genes were based on those of Veith et al. [2], and of cytochrome b were derived from sequences determined in our laboratory (Table 2).
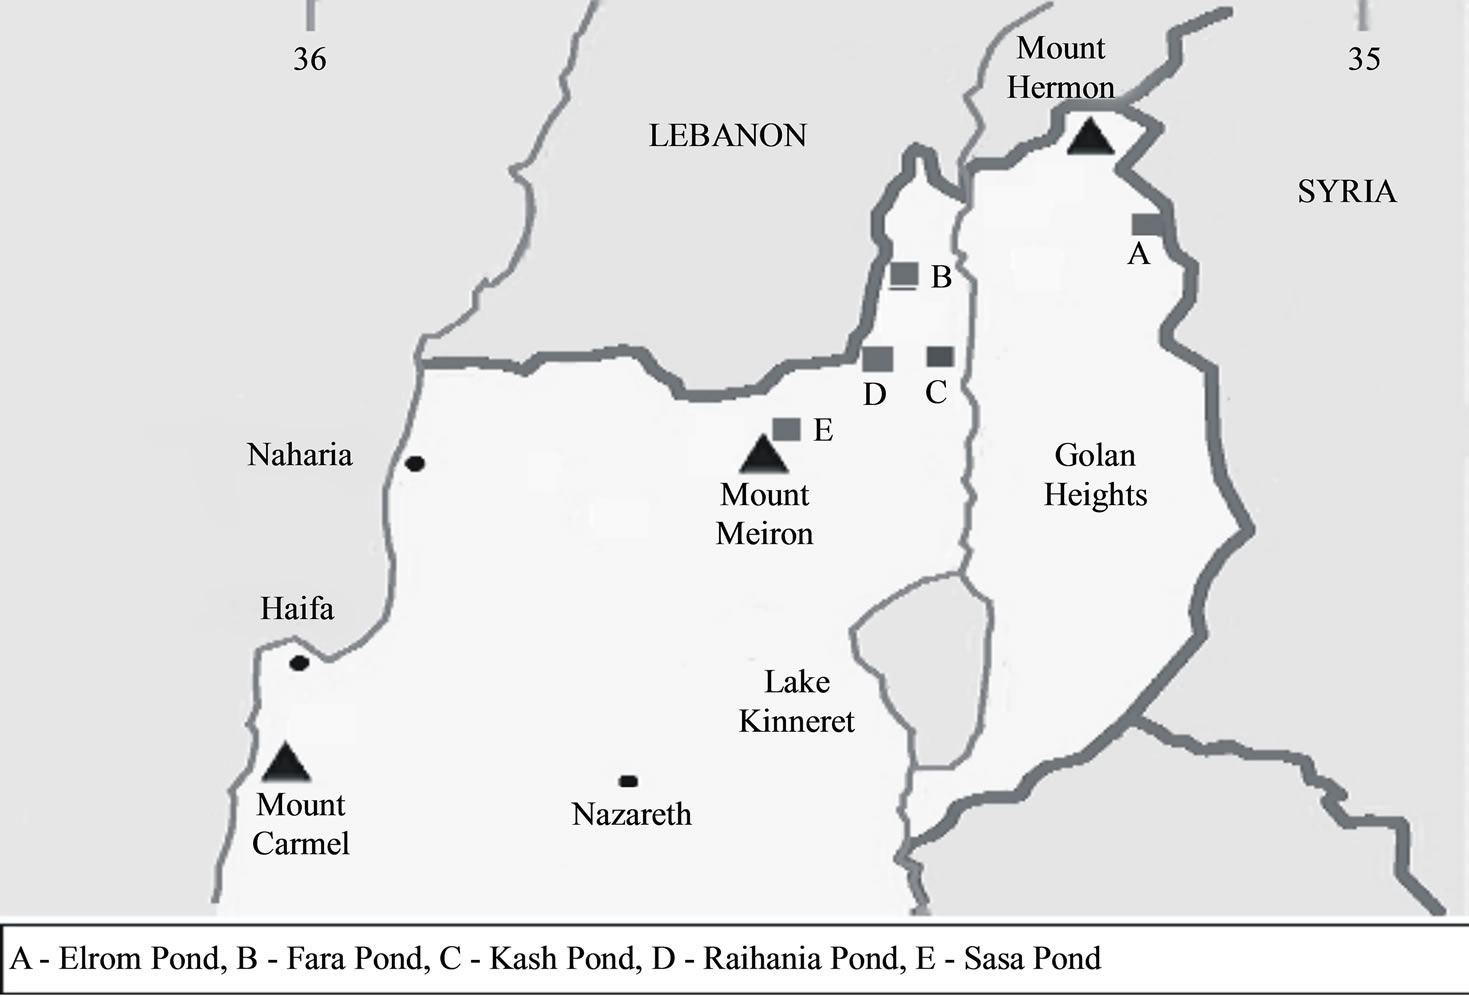
Figure 1. The breeding sites in northern Israel from which specimens of P. syriacus were sampled.
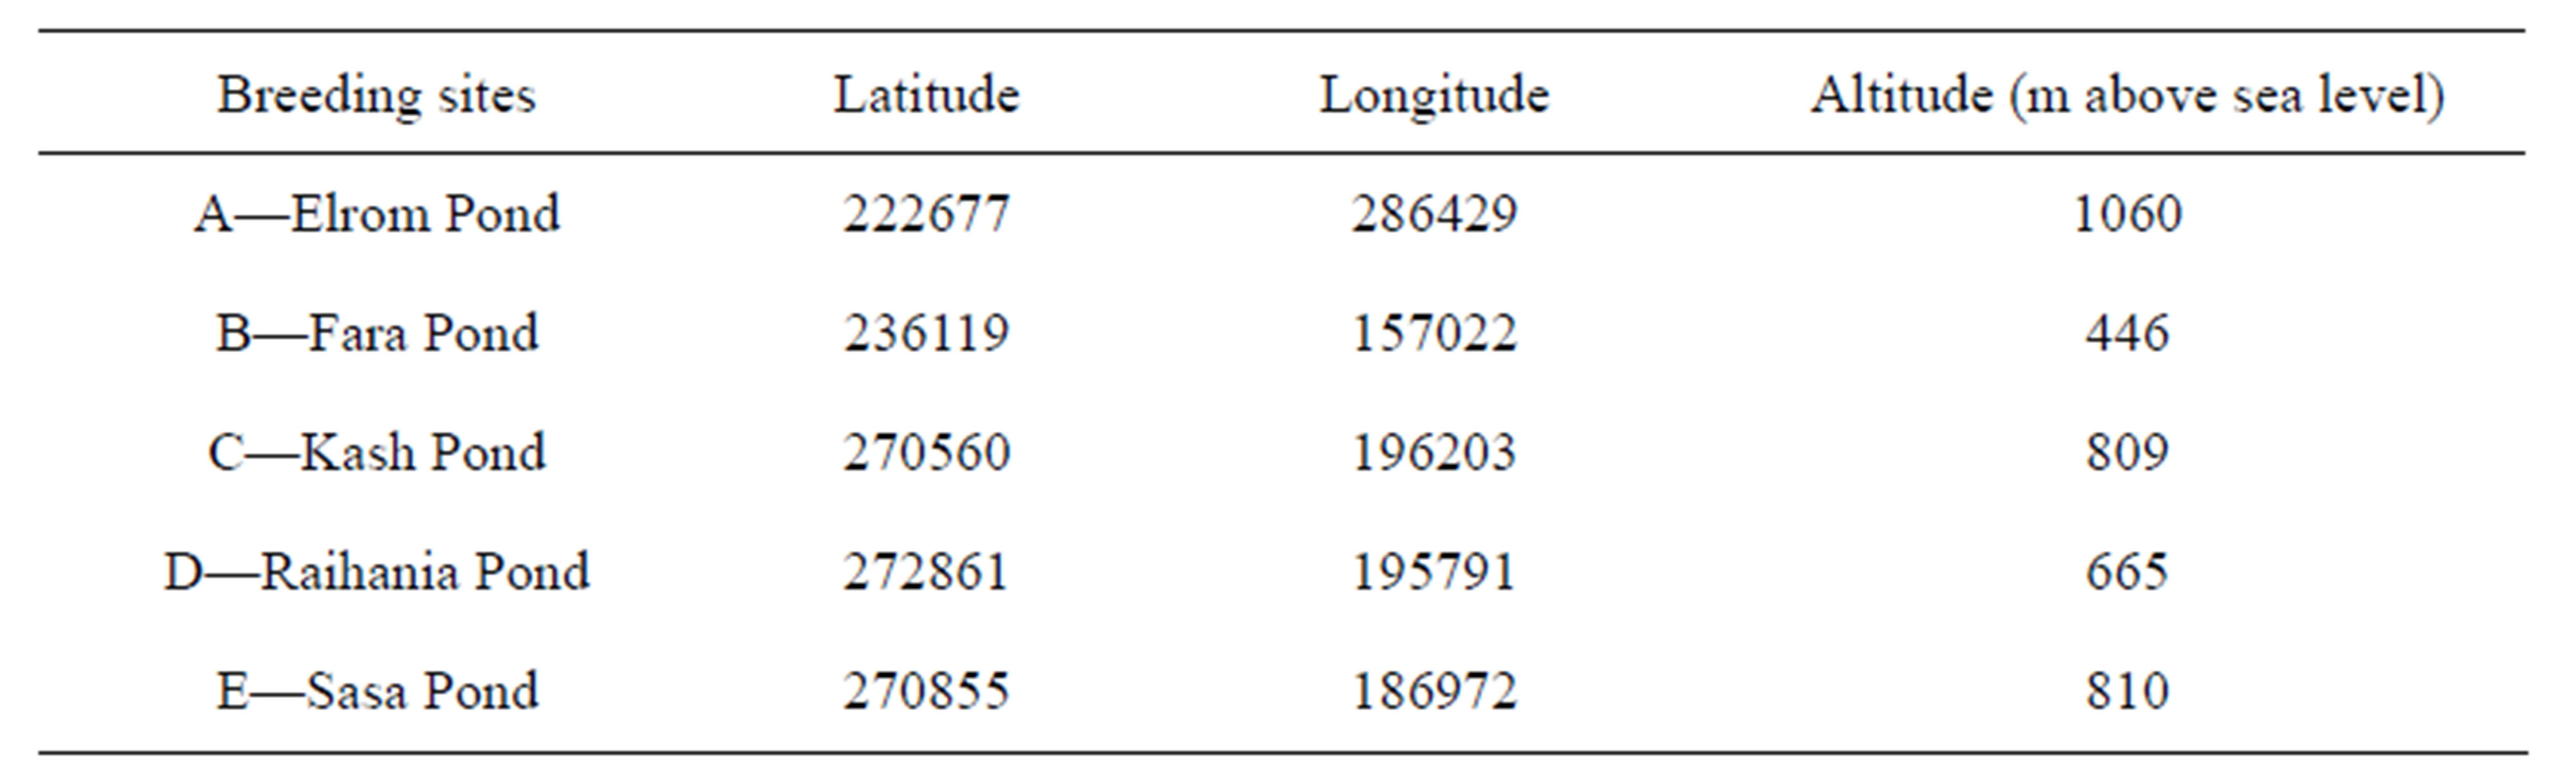
Table 1. Breeding sites in northern Israel from which specimens of P. syriacus were sampled.
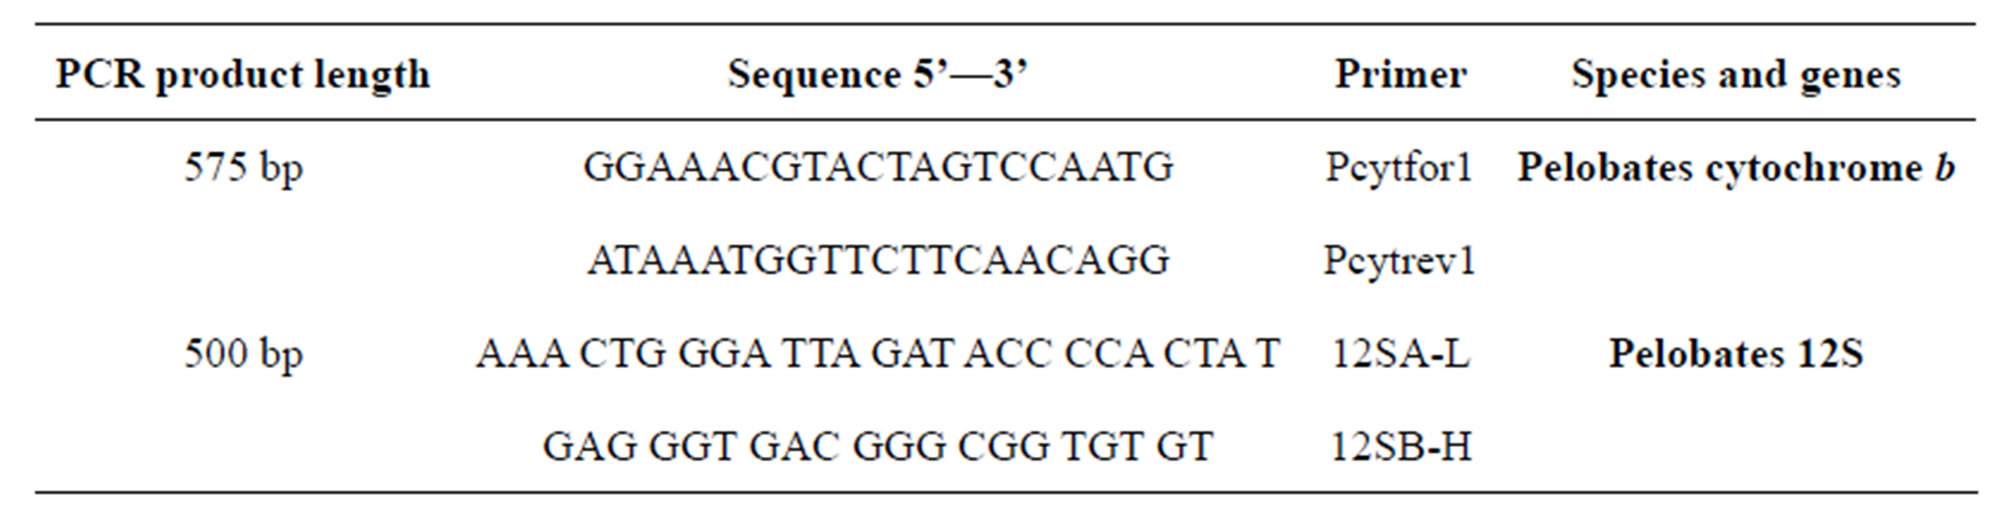
Table 2. Primers used in this study.
PCR amplification was performed in a 50 μl solution containing 10 mM Tris-HCl, 50 mM KCl, 2.5 mM MgCl2, 0.5 mM of each dNTP, 2 μM of primer, 10 - 500 ng gemonic DNA and 2.5 units of Taq DNA polymerase (Promega, USA). The reaction was performed in a PTC-150 MiniCycler (MJ Research, USA) with the following parameters: 3 min denaturation at 94˚C, followed by 36 cycles of denaturation for 1 min at 94˚C, annealing for 1 min at 52˚C and elongation for 1 min at 72˚C. An additional 5 min elongation period at 72˚C followed the last cycle. After amplification, the PCR products were separated by electrophoresis on a 1.5% agarose gel, stained with ethidium bromide. PCR products that had been purified using the HiYield Gel/PCR DNA Fragment Extraction Kit (RBC Bioscience, Taiwan) were sequenced at the Hy Laboratories (Rehovot, Israel).
2.3. DNA Sequence Analysis
The primer decamers (Mikulice and Pialek, 2003), OPA-3 (5’AGTCAGCCAC) and OPA-4 (5’AATCGGGCTG), were found to be best for sequence analysis of Pelobates by RAPD PCR. The reaction was performed in a 50 μl solution containing 10 mM Tris-HCl, 50 mM KCl, 2.5 mM MgCl2, 0.5 mM of each dNTP, 2 μM of primer, 10 ng genomic DNA and 2.5 units of Taq DNA polymerase (Promega, USA), with the following parameters: 3 min denaturation at 94˚C, followed by 40 cycles of 1 min at 94˚C, annealing for 1 min at 35˚C and elongation for 1 min at 72˚C. An additional 5 min elongation period at 72˚C followed the last cycle. After amplification, the PCR products were separated by electrophoresis on a 1.5% agarose gel, stained with ethidium bromide.
The DNA variations study was executed in two steps. First, the variations in the populations were examined. Subsequently, the samples were run on one gel to find the genetic variations among the populations. To assess the similarity between individuals, band sharing (BS) of the RAPD PCR products was calculated as:
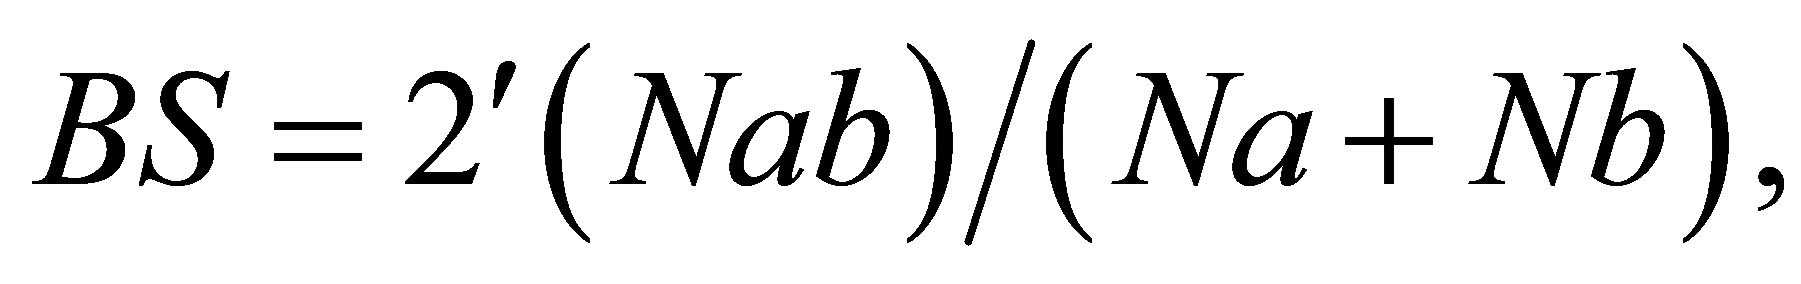
where BS = level of band sharing between individuals a and b, Nab = number of bands shared by individuals, a and b, Na = total number of bands of individual a and Nb = total number of bands for individual b [19,20]. The PCR patterns were compared only among samples that had been run on a single gel. Differences in BS were examined by the d-test for differences between proportions [21].
Multiple sequence alignments and phylogenetic cluster analysis were carried out using the MegAlign computer program (Windows32 MegAlign6.1, DNASTAR Inc.). Phylogenetic trees were generated by the Neighbourjoining method from distance matrices, which were based on multiple sequence alignments.
3. RESULTS AND DISCUSSION
The nucleotide sequences of the mitochondrial DNA fragments were determined from a 460 bp clone of cytochrome b (Figure 2) and a 380 bp clone of 12S. The cytochrome b fragment varied at the nucleotide sites, 61, 121, 205, 274 and 286 among populations of various breeding sites (Table 3) (GenBank accession numbers - FJ595199 to FJ595203). However, no genetic variation was found among the sequences of 12S (Figure 3).
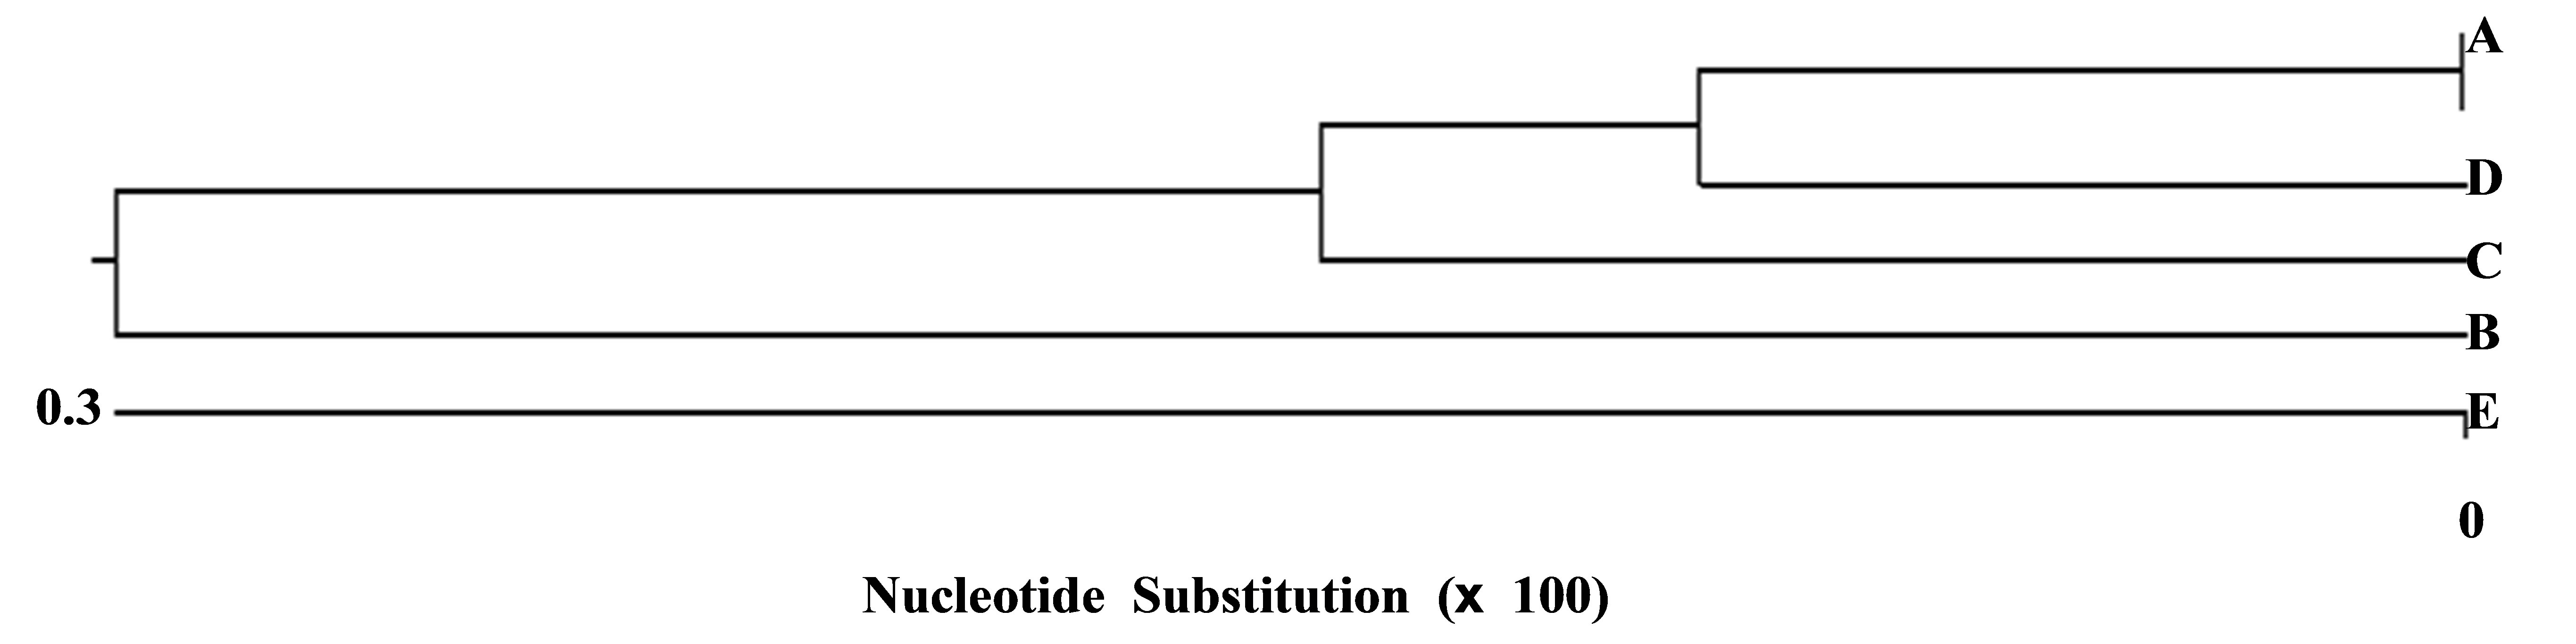
A similar situation was revealed when comparing the cytochrome b gene variation among P. syriacus populations from various breeding sites (Figure 4). The analysis of five sequences by Arlequin software revealed a high gene identity (98.7% - 99.6%). In addition, it showed that Elrom Pond (A), the breeding site at the highest altitude, and Fara Pond (B) at the lowest altitude, had lower identities than other populations Figure 4.
The DNA variation among P. syriacus populations of various breeding sites, according to the primers, OPA-3 and OPA-4, is presented in Figure 5. There were 7 - 8 identical bands when using OPA-3 and 11 - 12 identical bands when employing OPA-4. With primer OPA-4, the BS among populations varied between 0.92 - 1.00 (Table 4). The lowest similarity was revealed between the highest Elrom Pond (A) and population and those of the ponds, Kash Pond (C), Raihania Pond (D) and Sasa Pond (E)(0.92 BS), as well as between the pond population of the lowest altitude, Fara Pond (B)(0.92 BS) (Table 4). Simliar results were obtained in the analysis with the primer OPA-3. It seems that both altitude and the distance have effect on genetic diversities.
The genetic variation analysis of five populations in a small area in northern Israel revealed different results

Figure 2. Alignment of the nucleotide sequences of the cytochrome b fragment of P. syriacus larvae from five breeding sites in northern Israel.
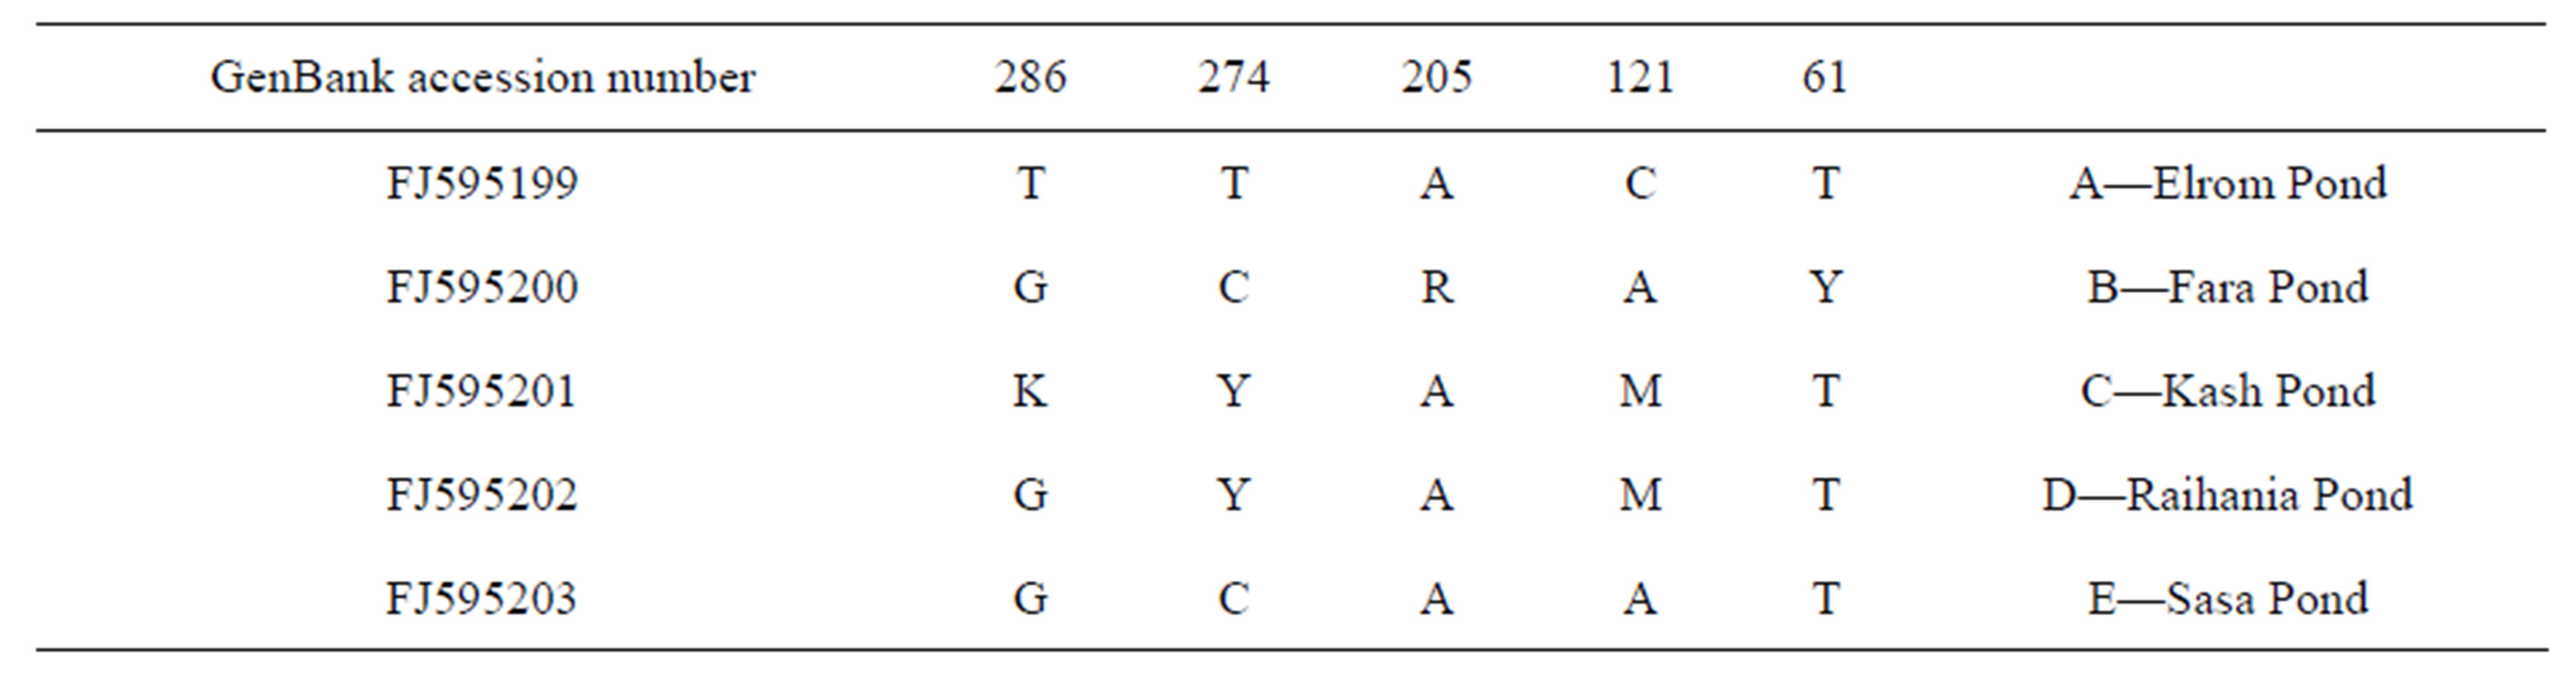
Table 3. The nucleotide sequence variations and GenBank accession numbers of cytochrome b fragments.
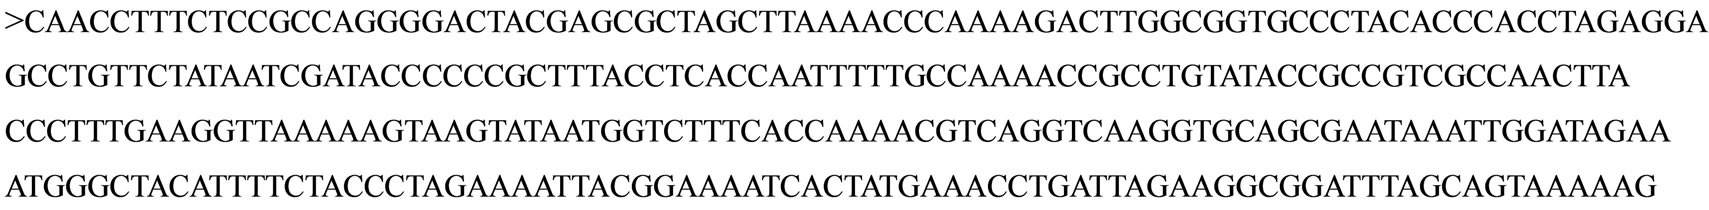
Figure 3. The 12S ribosomal RNA partial sequence of P. syriacus in northern Israel.
| |
E |
A |
B |
C |
D |
| E |
- |
98.9 |
99.1 |
99.3 |
99.3 |
| A |
- |
- |
98.7 |
99.1 |
99.6 |
| B |
- |
- |
- |
99.6 |
99.1 |
| C |
- |
- |
- |
- |
99.6 |
| D |
- |
- |
- |
- |
- |
| |
Sasa Pond |
El-Rom Pond |
Fara Pond |
Kash Pond |
Raihania Pond |
| Sasa Pond |
- |
98.9 |
99.1 |
99.3 |
99.3 |
| El-Rom Pond |
- |
- |
98.7 |
99.1 |
99.6 |
| Fara Pond |
- |
- |
- |
99.6 |
99.1 |
| Kash Pond |
- |
- |
- |
- |
99.6 |
| Raihania Pond |
- |
- |
- |
- |
- |
Figure 4. Unrooted phylogenetic tree and the percent identity of the partial cb fragment based on nucleotide sequence of the P. syriacus. The length of each pair of branches represents the distance between sequence pairs, while the units at the bottom of the tree indicate the number of the substitution events. The phylogenetic tree was constructed using the MegAlign program (DNASTAR) by the CLUSTALW method. The branch length represents the evolutionary distance. A—Elrom Pond, B—Fara Pond, C—Kash Pond, D—Raihania Pond and E—Sasa Pond.
depending on the genetic marker, molecular mitochondrial DNA (cytochrome b and 12S) and nuclear DNA (RAPD PCR). Cytochrome b was found to be less conservative than 12S, and it showed a low genetic variation when using RAPD PCR. This pattern appeared to be mainly attributed to the sites of the P. syriacus populations. According to this analysis, a very high similarity (98.7% - 99.6) was found among the populations. Munwes et al., 2010 [22] used the eastern spadefoot toad in Israel as a model system to examine these hypotheses
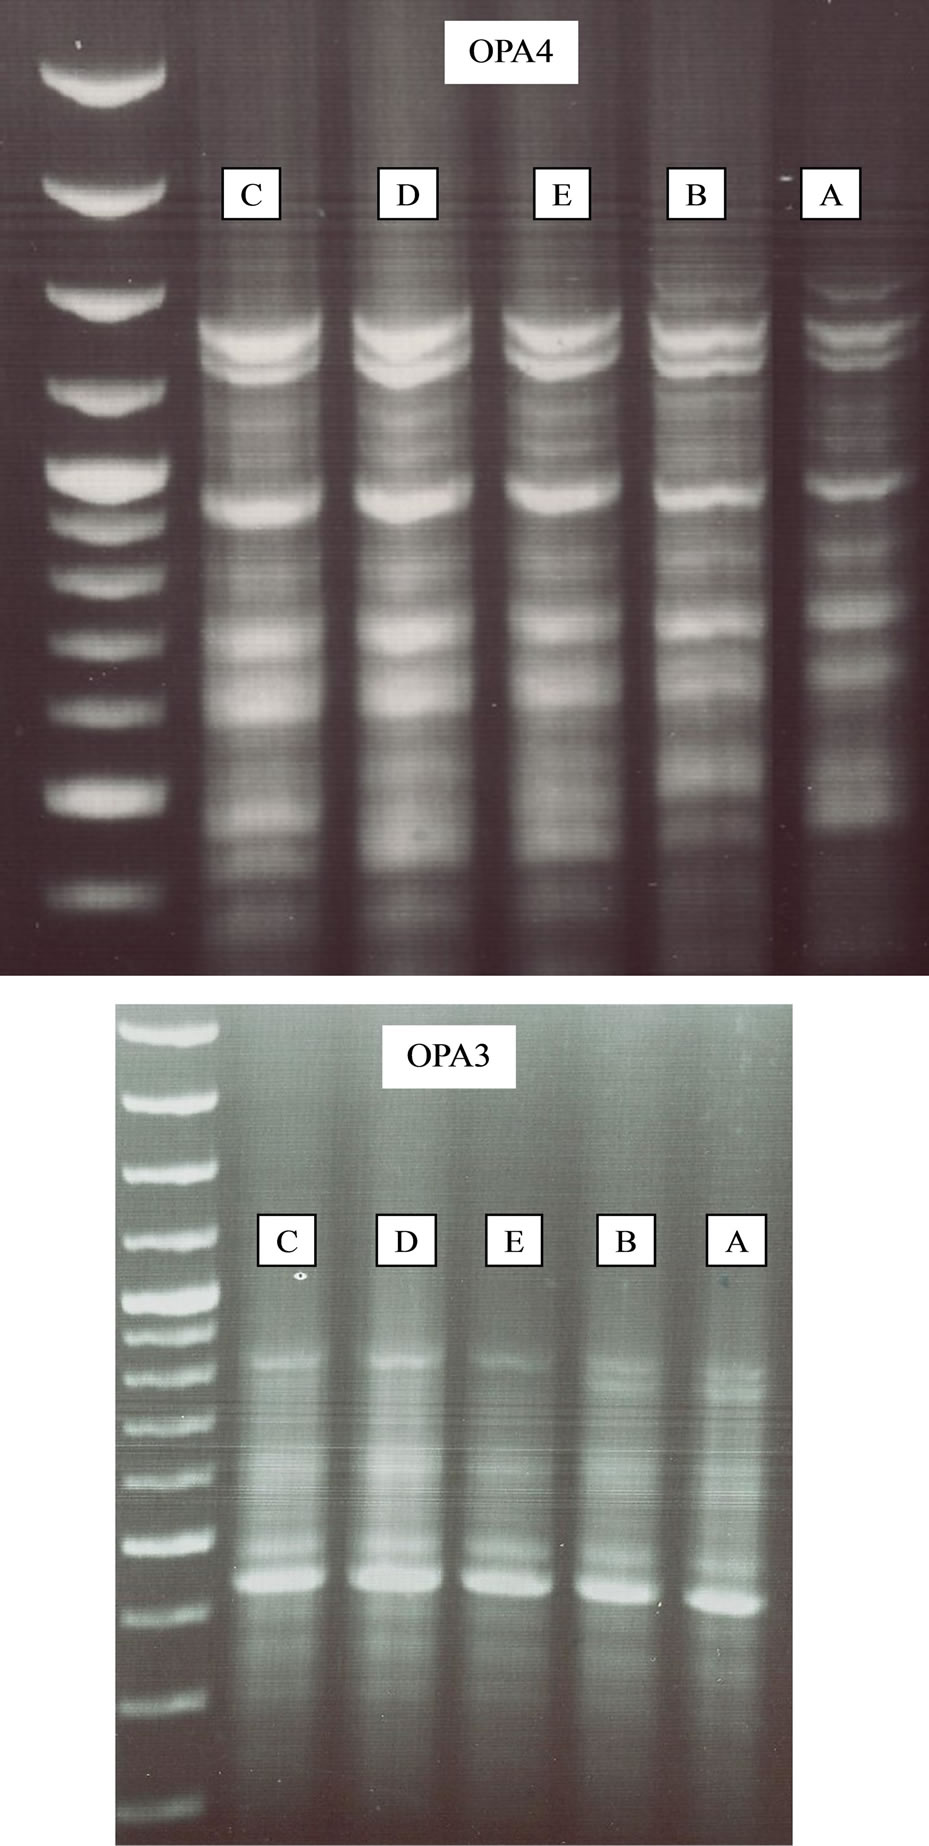
Figure 5. RAPD PCR results using the OPA-3 and OPA-4 primers. A—Elrom Pond, B—Fara Pond, C—Kash Pond, D— Raihania Pond and E—Sasa Pond.
using population genetics analyses and network theory using mitochondrial DNA (only D-loop) region individuals sampled at different locations in Israel but not from various habitats and different altitudes in a small area as was done in the present study. They identified two distinct communities, which are genetically linked through two specific rain pools in the Upper Galilee. Details on the spatial subdivision of this species are cardinal for future management and restoration of temporary wetlandsin Israel [22]. In the present study using different molecular makers (cytochrome b and 12S and RAPD PCR), the lowest similarity was found between populations of the highest altitude (Elrom Pond) and lowest
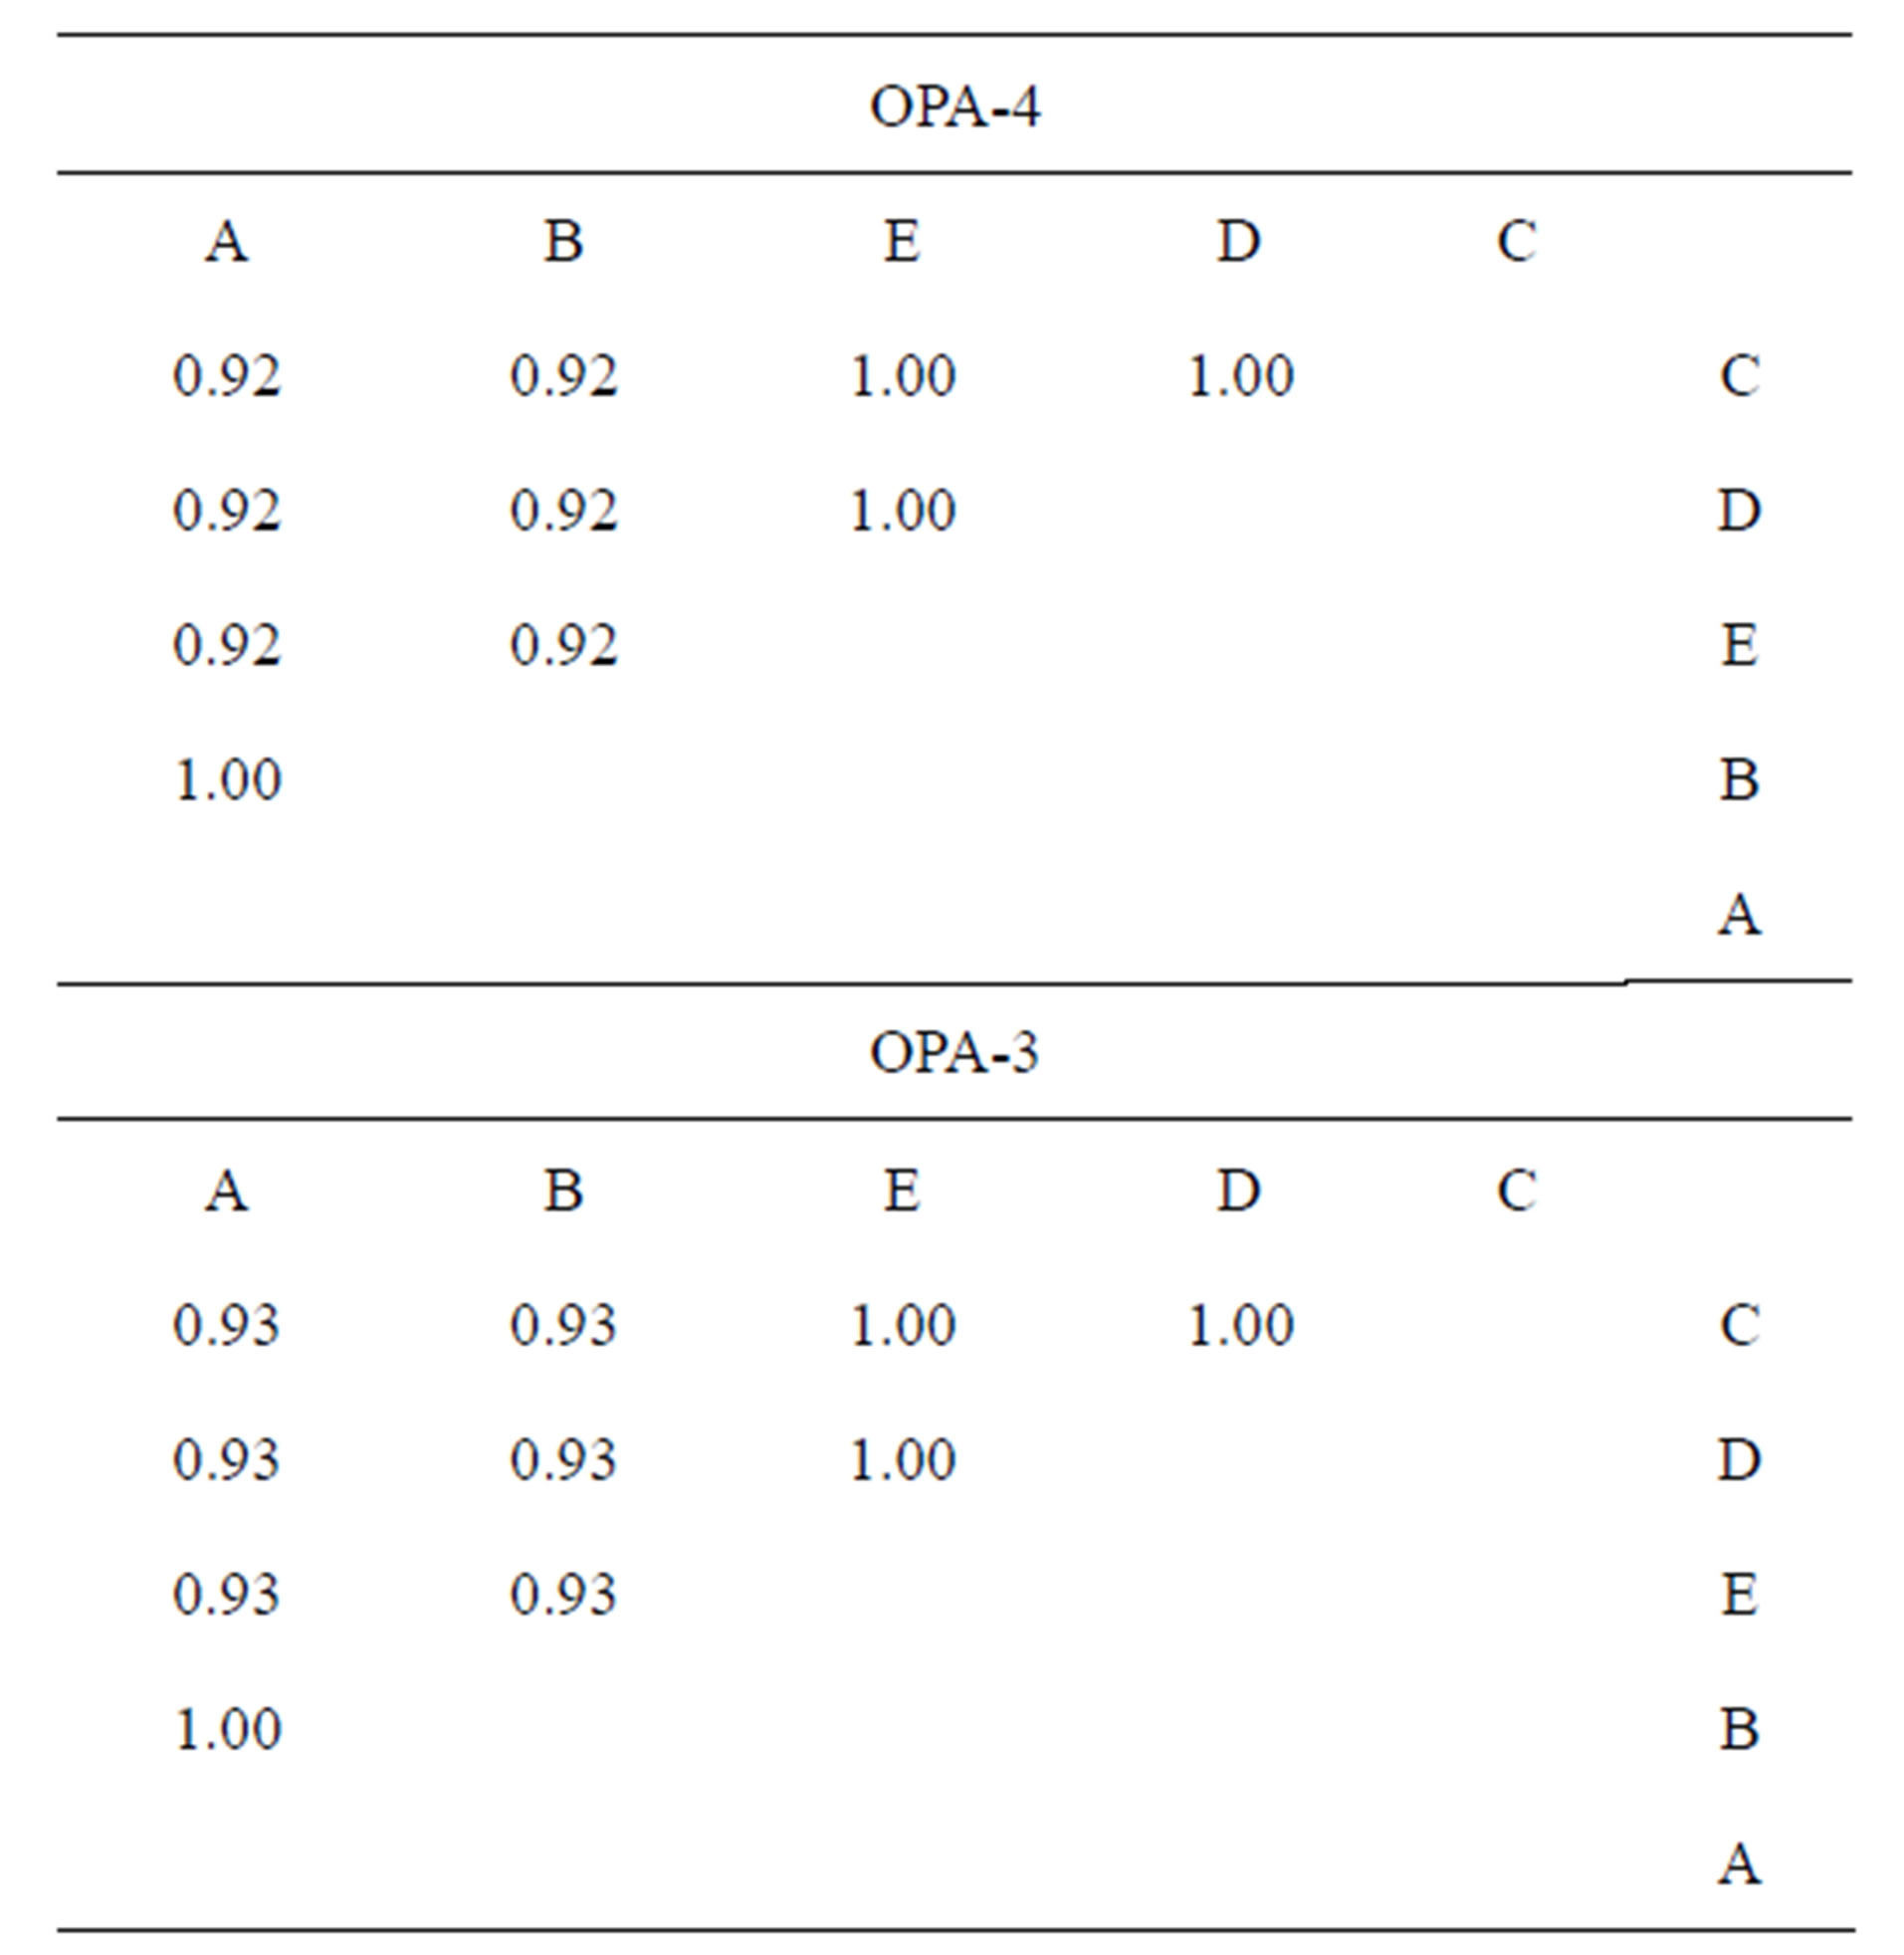
Table 4. The common bands and band sharing (BS) found in RAPD PCR with OPA-3 and OPA-4 primers between paired populations.
A—Elrom Pond, B—Fara Pond, C—Kash Pond, D—Raihania Pond, E— Sasa Pond.
altitude (Fara Pond), relative to the other ponds (Kash Pond, Raihania Pond and Sasa Pond) with a BS of 0.93.
Based on allozymic variations in proteins encoded by 32 gene loci, Nevo [17] suggested that the selection for homozygosity, as an adaptive strategy, seems to operate in the relatively constant and narrow subterranean niche. As compared to many studies on the phylogenetic, geographical and genetic relationships of Pelobatoidea [2,4,6,7], the information on genetic habitat selection in a relatively small area in Israel and the effect of ecological and environmental factors which might be influenced by altitude and other parameters, are very rare in this systematic group [17,18]. Many aspects of P. syriacus biology have been studied. It seems that all of them might be affected by environment. Adaptation to small differences among habitats is very difficult, but is possible. This has been demonstrated in other amphibians in the same area, e.g., in Salamandra infraimmaculata, according to RAPD PCR and the mt DNA method [23,24] and in Triturus v. vittatus, when using the RAPD PCR method [25]. Both S. infraimmaculata (see review [26]) and T. v. Vittatus [27,28] are found at different altitudes and breed in various water bodies, some of which dry up within a few months and others, which remain all year round. The biology and ecology of P. syriacus seem to have been studied less [14-16]. However, based on the results that the P. syriacus larvae can grow and complete metamorphosis only in relatively predictable breeding sites, where water is available during most of the year [9,10] and taking into account the burrowing behavior of this species [11], which prevents dehydration, it seems that P. syriacus is less exposed to extreme conditions in northern Israel than Triturus v. vittatus and S. infraimmaculata. This might explain the low molecular variations among the various populations, as discovered in the present study and as apparently supported by Nevo [17] and Nevo and Beiles [18].
The above circumstances may explain the decline in P. syriacus [7], as shown by the relatively few breeding sites used by this species in northern Israel [8].
In conflation, this study shows that the environment (in different altitudes) and distains in the habitats of P. syriacus have an effect on the genetic molecular level.