Conservation of Capital: Homeomorphic Mapping from Intangible Aggregate Macro-Economic CDR Space into Tangible Micro-Economic Production Spaces ()
1. Introduction
A better way to capture total capitalization for explaining what is responsible for economic growth is the Ridley [10] [11] [12] [13] , Ridley, Davis and Korovyakovskaya [14] and Ridley and Khan [15] CDR growth model: g = f (C, D, R). It is the most recent heterodox model that shows that the way capital is converted to real gross domestic product (GDP) is the same all over the world. Essentially, the catalyst rule of law (R) attracts intangible capital (C), and the catalyst democracy (D) deploys it optimally to create tangible wealth in the form of products and services. The catalysis is as described by Berzelius [16] in that D and R speed up the C to GDP conversion process but are not themselves changed by the process. The purpose of this paper is to show how capital from the aggregate real gross domestic product adjusted for purchasing power parity (G) can be distributed to micro-economic production units. These provide inputs per the Cobb-Douglas micro-economic stipulation. The outputs from the micro-economic units can then be summed to obtain a correct aggregate G. Finally, we show that these mappings from intangible aggregate macro-economic CDR space into tangible micro-economic production spaces are homeomorphic (Weisstein [17] ) such that under certain prescribed configurations of micro-economic production units, capital is conserved.
The remainder of the paper is organized as follows. Because the CDR growth model is a heterodox model that is built on different assumptions and relationships, Section 2 provides unique definitions and specifications. Section 3 provides an account of the relationship between the CDR growth model and the Cobb-Douglas function. Section 4 examines the CDR Cobb-Douglas mapping. Section 5 provides conclusions and suggestions for future research.
2. Definitions and Specifications
Definitions
Entrepreneurship is the process of starting a business, typically a startup company offering an innovative product, process or service.
Capitalist is a person who deploys his or her personal capital so as to maximize his or her own benefit and includes all rational people.
Real gross domestic product adjusted for purchasing power parity (G) is the net product or value added that equates to standard of living.
Capitalism (C) is the mechanism for the collection and assembly of capital, measured by total market capitalization that reflects entrepreneurship capital and capital stock.
Democracy (D) is the private work force idea participation and periodic election of public representatives, and catalyst for the process of generating G from C.
Rule of law (R) is the reverse of corruption, the protection of shareholder and other property rights, and catalyst for the attraction of C.
Corruption is the abuse of entrusted power for private gain and can be classified as grand, petty and political, depending on the amounts of money lost and the sector where it occurs.
Property (rights) is a legal expression of an economically meaningful consensus by people about assets, how they should be held, used and exchanged.
The CDR growth model was created in the search for a model that accounts for the annual contribution to real gross domestic product adjusted for purchasing power parity (G). The objective was to create an index that can be used to calculate G for any year. To accomplish that the model variables G, C, D, R are standardized by linear transformation to ensure lower and upper bounds of 0 and 1. That way, CDR becomes an index for the estimation of G for any country by inverse transformation when the highest G and lowest G are known for the year (see appendix). The CDR index is calculated from published country market capitalization, ranking in democracy, and ranking in corruption (Goel, Mazhar and Nelson [18] , Czap and Nur-tegin [19] , see also Couttenier and Toubal [20] , López, et al. [21] ).
The global time invariant model is given as follows:
where all variables are standardized by linear transformation to ensure upper and lower bounds on
. Democracy and corruption are rank ordered, where the highest = 1 and the lowest = the number of countries. Rule of law is the opposite of corruption. See Appendix.
When estimated from data, we get the CDR index = 1.53C + 0.14D + 0.23R − 1.21C∙D∙R + 0.38N that comprises positive C, D and R effects and a negative interaction component due to friction from democracy that reduces G from what it might otherwise be if there were perfect agreement amongst decision contributors (Click here to download supplementary source data). There is only a small contribution from natural resources (N) in explaining the variation in g, and N is not a decision variable that is under the control of government. There is also the well-known Dutch disease from natural resources that can have positive or negative effects on wealth, depending on how the financial economy is managed (Auty [22] , Frankel [23] , Norman [24] , Sachs and Warner [25] , Ross [26] , Sala-i-Martin and Subramanian [27] , Humphreys [28] , van der Ploeg [29] , Wadho [30] , Ridley [12] ). Therefore, for the purpose of this discussion it can be omitted from the model and from the appellation CDR index. The CDR model was re-estimated for years 1995 to 2016 (see Appendix) with similar results with the conclusion that it is global time invariant.
3. Integrating the CDR and Cobb-Douglas Functions
In general, consider m countries,
, where country i contains
production units. The ith country G estimate is
(highest G-lowest G) + lowest G, where in equilibrium,
.
Since there is no such thing as an aggregate production function (Cohen and Harcourt [7] ), production of
is obtained from the sum of
micro-economic production units. Consider a deterministic Cobb-Douglas function
applied to the jth unit of production in the ith country, where existing capital stock
in the
Cobb-Douglas function is replaced by capital representing the investment of the fraction
of
,
is the matching quantity of physical labor in person-hours per annum, and
is the annual value of production. All labor is identical in nature and functionality. This operating definition of homogenous labor is consistent with the original theory of comparative advantage (Ricardo [31] [32] ). Any human differences due to knowledge, experience and skills are transferred into production capacity of capital stock. Assuming constant returns to scale, then
, where
is the total factor productivity (efficiency) and
and
are output elasticities of capital and labor respectively. The total monetary value of production for country i is given by
.
The global monetary value of production of all m countries is therefore
.
Or, substituting for
,
when the model exponents sum to one (
), the production function is first-order homogeneous, which implies constant returns to scale. That is, if all inputs are scaled by a common factor greater than zero, output will be scaled by the same factor.
4. Homeomorphic Mapping
We now consider the case of a single country i containing
perfectly efficient (
, for all i, j) production units
.
Capital comprises ineffable human capital ideas of imagination and creativity, and capital stock sourced from human capital ideas of imagination and creativity occurring in a prior time period and learning by many human beings through training. Consider capital to be derived entirely from human capital. In the Cobb-Douglas function capital and labor are interchangeable substitutes. In some applications pure labor is treated as mindless and is utilized in much the same way that machines are utilized. On the other hand, consider capital to be such that it has the potential to replace pure corporeal labor in its totality. And, as the capital increases labor decreases. Then, there is an output for input-capital-only that is equal to an output for a particular capital-labor combination. That is, the inputs can be considered to come purely from capital. Consider three hypothetical cases as follows.
Case 1:

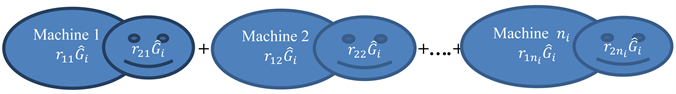
If capital in each production unit is represented in a single machine that can perform all the functions including labor so that no labor is required, then the value of production in country i is given by
, where
, for all i, j,
Since
is independent of j,
.
That is,
where
is constant.
Therefore, f is a linear function.
Moreover,
1) f is continuous;
2) f has a continuous inverse
.
Therefore, this
is a homeomorphic mapping, or bicontinuous or topological isomorphism. If 100% of capital is distributed to production units then
, and the total production from
units is
which is equal to
obtained from the aggregate CDR function, and capital is conserved.
Case 2:
If capital in each production unit is represented in two machines where the first is a traditional machine and the second machine is a robot that performs the function of labor so that no labor is required, then if the capital distributed to the first machine is
and the capital distribution to the second machine (robot) is
, then the value of production in country i is given by
, where
Rewriting,
Since
does not depend on j,
.
That is,
where
is constant.
Therefore, f is a linear function.
Moreover,
1) f is continuous.
2) f has a continuous inverse
.
Therefore, this
is a homeomorphic mapping, or bicontinuous or topological isomorphism. If 100% of capital is distributed to production units such that
, then the total production from
units is
which is equal to
obtained from the aggregate CDR function, and capital is conserved.
For example if
, then
.
Now, consider
, where
such that
. Then
,
,
,
.
Therefore, if
, for all i, j, then
, and
,
,
.
Therefore, there are many combinations of
and
in which
and capital is conserved.
Case 3:

If capital in each production unit is represented in a single machine that can perform all the functions including labor so that no labor is required, and the production units are themselves complementary, then the value of production in country i is given by
, where
.
Rewriting,
Since
does not depend on j,
That is,
where
is constant.
Therefore, f is a linear function.
Moreover,
1) f is continuous.
2) f has a continuous inverse
.
Therefore, this
is a homeomorphic mapping, or bicontinuous or topological isomorphism. If 100% of capital is distributed to production units such that
, then the total production from
units is
which is equal to
obtained from the aggregate CDR function, and capital is conserved.
For example, if
are distributed equally, such that
for all j, then
.
And, in general, if
then
.
Therefore, there are many combinations of
and
in which
and capital is conserved.
5. Conclusions
The CDR model gives us the basis for a unified theory for integrating the macro-economic CDR growth model into the micro-economic Cobb-Douglas production function. That is, a mapping from intangible aggregate macro-economic space into tangible micro-economic production spaces. In the particular cases studied in the paper, mapping CDR space into production spaces is homeomorphic and capital is preserved under certain prescribed combinations of the production units in the sense that the value measures of production sum to GDP. If the prescribed combinations are not present, then the aggregated values of the individual production units will not equate to GDP. Individual firms that construct production units operate independently of each other. So, the prescribed combinations will not exist except by some miracle. Therefore, there is no such thing as an aggregate production function.
We have seen from the CDR growth law (global time invariant CDR model) that the way in which capital is converted to gross domestic product adjusted for purchasing power parity is a universal constant. After adjusting for country factors of productivity, said capital is converted in accordance with the physical and chemical laws of the natural sciences. Like capital, the coefficients of democracy, rule of law and their interaction are global time invariant. Economic catalysis by democracy and rule of law always function the same way across the world. What makes a country more productive is its ability to attract more capital. Future research could investigate additional configurations of production functions beyond the cases presented in this paper.
Acknowledgements
The authors would like to thank Paul Beaumont for comments and good discussions but take full responsibility for any errors and omissions.
Conflicts of Interest
The authors declare no conflicts of interest regarding the publication of this paper.
Appendix
For convenience, the following appendix is reconstructed here from prior CDR publications.
1) The Global Time Invariant CDR model
![]()
Figure 1. Year 2014 G vs CDR Index for 79 countries (line). Bubble size (21 countries) is the square root of population. This model was re-estimated for years 1995 to 2016 with similar results. For additional comments on the countries listed see Ridley (2017a, 2017b).
2) Standardized g model
The ordinary least squares g model is specified as follows:
where, the intercept
and the coefficients
are all dimensionless,
is a random, normally distributed error with a mean of zero and constant standard deviation, and where all model variables are standardized as follows:
G = per capita real gross domestic product per capita (PPP)
These transformations standardize the variables and ensures upper and lower bounds on
. Democracy and corruption are rank ordered, where the highest = 1 and the lowest = the number of countries. G is measured in $/capita/year.
Data for these standardized variables are listed in a supplementary spreadsheet.
Click here to download supplementary source data.
Data sources
G (PPP, constant international$ for 2014, reported by the IMF) http://www.imf.org/external/data.htm
Population http://data.worldbank.org/indicator/SP.POP.TOTL
Capitalization (US$ mundi) http://www.indexmundi.com/facts/indicators/CM.MKT.LCAP.CD/rankings
Democracy rank http://democracyranking.org/wordpress/rank/democracy-ranking-2014/
Corruption rank https://www.transparency.org/research/cpi/
Total natural resources (% of G) http://data.worldbank.org/indicator/NY.GDP.TOTL.RT.ZS
Democracy rank & corruption rank for Bermuda was set to that for United Kingdom as the governing country.
Democracy rank & corruption rank for Hong Kong was set to that for United Kingdom as the recent & last governing country.
Barbados (high CDR) and Equatorial Guinea (high G) are too small for attention by the reporting agencies.
= 1.53C + 0.14D + 0.23R − 1.21C∙D∙R + 0.38N
t = (6.60) (1.69) (2.60) (4.40) (5.59), F ratio = 81.
Partial correlations (contributions to
):
59% 5% 10% 3% 6%
.
83% Fratio=81
(highest G-lowest G) + lowest G.
Highest G = 83,066. Lowest G = 1112.
The CDR index = 1.53C + 0.14D + 0.23R −1.21C∙D∙R comprises positive C, D and R effects and a negative component due to friction from democracy that reduces G from what it might otherwise be if there were perfect agreement amongst decision contributors. The contribution from N is negligible and can be dropped from the model since it is not a decision variable that is under the control of government.
The year 2014 CDR model (Figure 1) was re-estimated using samples from 2016 to 2016, 2015 to 2016, 2014 to 2016, 2013 to 2016, …, 1995 to 2016 (Figure 2). The
,
and
parameter estimates from the CDR model are approximately constant for 22 years. They converge in the forward direction of time. The
and
estimates are approximately constant for the most recent 9 years. Prior to 2008, capitalization data were not available for all countries. So capitalization was held constant. Constancy and convergence of the parameter estimates demonstrates model stability and consistency. Even if there is some bias, the model yields useful stable predictions. Some two hundred and forty years after Smith [33] announced an inquiry into the nature and causes of the wealth of nations, the cause is found to be capitalism, democracy and rule of law, and the CDR model places economics on a sound scientific footing.
![]()
Figure 2. CDR model parameters were re-estimated for years 1995 to 2016 with similar results.