Regional University-Industry Knowledge Flow: A Study of Chinese Academic Patent Licensing Data ()
1. Introduction
University innovation output had been considered a crucial source of knowledge and ideas in industry [1] - [3] . A large number of previous works had focused on the contributions of academic works on industry R & D [4] [5] . Scientific findings generated by public researchers could be transferred into applied science, and then used in industry [6] . The scientific findings changing process was one way for public research to make contributions to the society.
In the private sectors, companies have shifted from mainly exploiting internal resources to exploring ideas
and supports from outside firm boundaries. A research stream about absorptive capacities had highlighted the ability of firms to make good use of the scientific knowledge and technology from outside world [7] [8] . In the relational view, companies intend to form relational ties with other companies and academic organizations, or enter into an alliance network to gain more access to the outside scientific knowledge and resources [9] . Organizations with more social capital, which was originated from the position in social relation structure [10] , could have more access to new resources of scientific knowledge [11] . In the context of open innovation, firms can and should use external ideas as well as internal ideas, and internal and external paths to market, as the firms look to advance their technology [12] . In the resource-based view, knowledge and technologies from external partners were crucial resources for companies seeking competitive advantage.
University is one of the important sources of outside scientific innovation resources of industries [13] . Technology transfer had been considered as the third mission of public research [14] . The Bayh-Dole Act of
1980 in
US and other legislative actions had been taken to facilitate this process [3] . Licensing is one of the crucial ways of universities scientific knowledge transfer and had gained much attention on the practice [3] [15] .
The main purpose of this work is to reveal the regional variance patterns of Chinese university-industry scientific knowledge transfer in the channel of patent licensing. Previous works had investigated the regional variances through other channel: 1) Patent collaboration. Hong (2008) used co-patenting data in Chinese universities in his work and discovered an uneven distribution of knowledge exchange [6] . Gao et al. (2011) had used the same kind of technique to analyze the patent collaboration variance in different regions, with a dataset including all kinds of co-inventorship besides academic-industry co-inventorship [16] . Lei et al. (2012) had used the co-assignee data in patents to illustrate the university-industry-government relationship in research collaboration [2] . 2) Paper collaboration and citations. Scherngell and Hu (2011) had used the paper co-authorship dataset to investigate the regional difference and concluded that the geographic space impedes cross-regional research collaboration in China [17] . Liang and Zhu (2002) had used scientific paper collaboration and co-au- thorship to measure regional research collaboration in China [18] . 3) Patent citation: Azagra-Caro (2012) had investigated on the patent citation data from industry to universities to explore the international variance patterns on academic knowledge flows [19] .
So far, no study on the university-industry knowledge transferring had used patent licensing data to investigate regional performance and variance in the Chinese context. Licensing as a main channel of knowledge transfer had not been studied in the bibliometric way. Compared with other channels, the knowledge transferred through patent licensing is solid technologies, which is more closed to application and could be valued in the market place. Results on patent licensing data are more representative to the innovation commercialization process. Also, the licensing data have knowledge transferring directions embedded and the differences in giving and receiving could be identified. Patent collaboration data, on the other hand, treated collaboration partners in reciprocal relationships, thus could not determine the knowledge flowing directions. Paper collaboration and citation were more suitable to studies on the inter-academy knowledge flow but not as well performed as in the field of academy-industry knowledge transferring for the lack of paper co-authorship and citation between universities and private companies. Patent citation data as measurement of knowledge transferring had long been criticized because the coexistence of applicant citation and examiner citation. Citations added up by examiners could not represent the actual knowledge flow from citation patents to the applicants [20] . For the following reasons, we had used the patent licensing data to represent the actual applicable academic knowledge flow between universities and industries. In the practice, government had input much more political and legislative resource into promoting university licensing activities than facilitating other channels in recent decays [15] [21] - [23] . Therefore, exploring the geographic variances in university licensing could generate more insights in the common practice.
The remainder of this paper had been structured as follow: In the Data and Method section, datasets and methods used in this study had been introduced. The Results sections had been organized to analyze the local knowledge transferring patterns, regional knowledge exportation patterns and regional knowledge importation patterns. The Conclusion sections had summarized results and implications of this study.
2. Data & Methods
In this paper, the regional variances of university patent licensing activities had been studied using patent analyzing techniques. Patent licensing data had been a crucial indicator of scientific knowledge transferring. The patent licensing documents data of all the Chinese universities and colleges from 2002 to 2012 had been collected from the online database in SIPO (State Intellectual Property Office of the PRC). In China, the patent licensing contracts between licensors and licensees had to be registered and documented in SIPO system, or they would not be protected by the national patent law. In that case, licensing activities documented in the system were the actual legal patent licensing activities that had happened in the real world. Each licensing documents had information about licensed patents, including the licensers, licensees, terms and territories. One document indicates one licensing activity.
3. Results
Results on the regional variances of university-industry patent licensing activities had been arranged in the following subsections: First, we look into the local knowledge transferring patterns of each region; second, the patterns of regional universities out licensing patents to industry had been studied; finally, the patterns of regional industries receiving patents from universities had been investigated. These three sections had classified the university-industry knowledge flow into three directions: local universities to local industries, local universities to non-local industries and non-local universities to local industries.
3.1. Local Knowledge Transferring Patterns
Table 1 had shown the local licensing data of 28 Chinese provinces and municipality. Regions in the table were ranked by the number of local licensing. The third column in Table 1 had shown the numbers of total out-li- censing of each region. The total out-licensing data represented the total volume of patents generated by universities in ego region that had been transferred to industry by the channel of licensing. Regions that obtained large number in total out-licensing had more academic researchers that were actively engaged in technology transfer activities. They are the regions that equipped with more applicable academic resources. Jiangsu, Shanghai, Guangdong, Zhejiang and Beijing ranked top 5 in the total out-licensing data. Universities in these regions had more involvement in knowledge transferring process.
The fourth column in Table 1 had shown the number of total in-licensing of each region. The data repre- sented the industries’ absorptive capabilities of academic inventions in ego regions. Companies in regions with large total in-licensing numbers had obtained more knowledge and technologies from universities and colleges and were more capable of commercializing academic innovation outputs. Jiangsu, Guangdong, Zhejiang, Anhui and Shandong ranked top 5 in the total in-licensing data. These regions had effectively utilized academic resources.
The second column had shown the local licensing data and the regions in the first column were ranked by this category. Local licensing data represented the total volume of patents that had been transferred from universities to companies in the same ego district. Numbers in this category had two implications. First, they indicated the knowledge contribution of universities to the local economy. Second, they indicated the efficiency of local knowledge utilization of industries. The average local licensing number was 113.98, with a standard deviation of 168.10. Jiangsu, Guangdong, Anhui, Zhejiang and Shanghai ranked top 5 in local licensing numbers. Inference from these data was that both universities and companies in these regions had actively involved in the academic invention commercialization process.
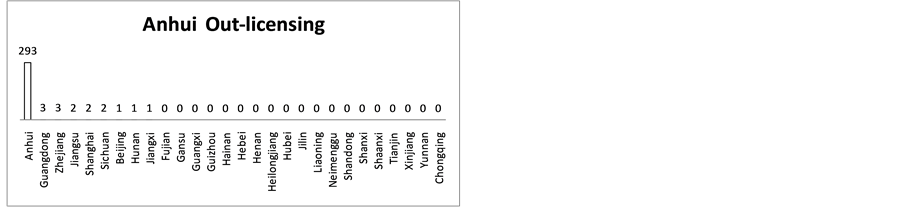
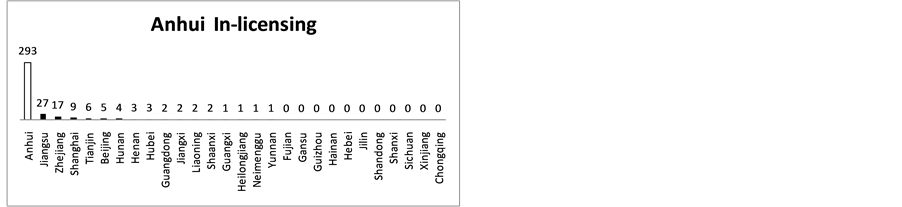
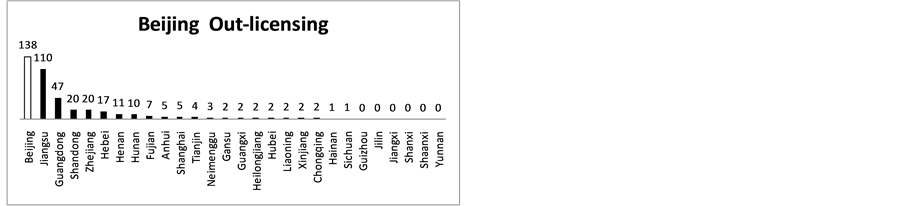
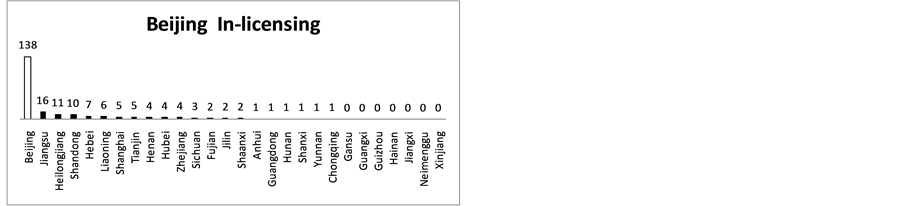
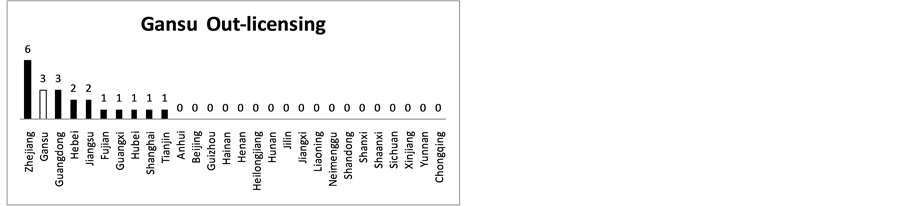
Besides, the average local licensing ratio in this dataset equaled to 56.18% (113.96/2022.86), larger than 50%. In the aspect of academic knowledge out-licensing, 25 of these 28 regions’ universities had transferred the largest amount of patents to local industries, except for Gansu, Shanxi and Hainan. Hainan had no academic patents transferred out therefore was not account. The largest amount of knowledge transferring in Gansu and Shanxi had been generated from Gansu to Zhejiang and from Shanxi to Guangdong. In the aspect of academic knowledge receiving, 26 of 28 regions’ industries had absorbed the largest amount of patents from local universities, except for Hainan and Xinjiang, in which the largest amount of knowledge transferring had been generated from Jiangsu to Hainan and from Jiangsu to Xinjiang. These results indicated that relatively large portion of academic patents bad been transferred into local industries. This result had supported the academic perspective of localization effects on knowledge flow [24] -[26] . The detailed inter-regional academic out-licensing and in-licensing data had been revealed in Appendix 1. In each diagram, the local region had been shown in white bars and non- local regions had been shown in black bars.
![]()
Table 1. Local licensing data of 28 regions.
Data in local licensing number, total out-licensing number, total in-licensing number had been shown in a bar diagram in Figure 1. This diagram could reveal the uneven distribution of licensing numbers in the 28 regions. At least half of these regions had very small numbers in these 3 items. The top 7 districts, including Jiangsu, Guangdong, Anhui, Zhejiang, Shanghai, Shandong and Beijing, had taken up 69.32% of local licensing numbers, 61.83% of total out-licensing numbers and 71.21% of total in-licensing numbers. And it could be observed from Figure 1 that those regions that had large numbers of licensing activities tend to have large numbers in all 3 indicators. Figure 2 had shown the data of total out-licensing and total in-licensing in a scatter plot to reveal this trend. A linear regression line of these two variables had been shown in Figure 2. It had a positive slope coefficient of 1.1671. These 28 regions were distributed around this line. A large number of regions located in the left lower corner, with relative low value in both total out-licensing number and total in-licensing number. It seemed that regions with large number of total out-licensing tend to had large number of total in-licensing, too. The main logic behind this phenomenon was that both total out-licensing numbers and total in-licensing numbers comprised of local licensing numbers. The total out-licensing numbers were the results of local licensing num-
![]()
Figure 1. Local licensing number, totali in-licensing number, total out-licensing number of 28 regions.
![]()
Figure 2. Scatter diagram of total out-licensing (x axis) and total in-licensing (y axis) of 28 regions (The linear coefficient line of these two variables had a positive slope coefficient of 1.1671, with a p-value less than 0.0001, R-squared 0.7807).
bers added up the number of patents that the local universities had transferred to companies in other regions. The total in-licensing numbers were the results of local licensing numbers added up the number of patents that the local industries received from universities in other regions. Therefore, as long as a region had a large number in local licensing, the total out-licensing number and total in-licensing number, which could not be less than local licensing number, would also be large.
To conclude, universities had licensed out more amounts of patents to local industries and the local patents transferred from local universities to local industries through licensing channel were unevenly distributed. Although all 28 regions had local licensing, a small number of regions had been actively involved in local academic licensing than the other regions.
3.2. Regional Knowledge Exportation Patterns
Local licensing numbers could only reveal the academic knowledge transferred from local universities to local industries. Considering each region as a set of academic resources, there had been other patents transferred from ego region to other regions. Some region had transferred more knowledge to other regions and some regions had not. The knowledge out transferring intensity and directions could reflect a region’s ability as the main academic knowledge producer and practitioner. Regions that had transferred more knowledge to other regions had much academic impact on the other region’s industry. The capacity of each region’s knowledge out transferring would be studied in this part.
Table 2 had shown the non-local out-licensing data of each region. Non-local out-licensing data represented the number of patents transferred from local universities to non-local industries. The top 6 regions, including Shanghai, Beijing, Jiangsu, Shaanxi, Tianjin and Zhejiang had more patents licensed out to other regions. These regions were equipped with more applicable academic resources than other regions. A bar diagram of these data had been shown on Figure 3 to reveal the uneven distribution of academic knowledge. A long tail in the right
![]()
Table 2. Non-local out-licensing data of 28 regions.
![]()
Figure 3. Bar diagram of non-local out-licensing data.
side means that a large number of regions didn’t transferred patents to outside regions. Hainan and Xinjiang, in particular, had no patents licensed to other regions. The fourth column in Table 2 was the ratio of non-local out- licensing, it equals to the number of non-local out-licensing divided by total out-licensing number. It represented the portion of transferred knowledge that had been spreading out to other regions. This was depicted in the line on Figure 3. Some regions with low value of non-local out-licensing numbers had shown high value in the ratio.
3.3. Regional Knowledge Importation Patterns
Besides the capacity of local university knowledge exportation, the capacity of local industries absorbing and utilizing academic inventions also mattered. Private companies in some regions could find more academic resources and make good use of them. The absorptive capacity capture by these companies could generate competitive advantage for them. Results in Table 1 column 6 had shown that most regions acquire patents through local channels. Most regions’ local in-licensing ratios were larger than 50%. Therefore, industries which could absorb knowledge and technology across regional boundary would have more access to outside resources and be more competitive in the market place. The capacity of each region’s knowledge importation would be studied in this part.
Table 3 had shown the non-local in-licensing data of each region and Figure 4 was used to reveal the uneven distribution of it. The top 3 regions in non-local in-licensing were Jiangsu, Guangdong and Zhejiang. Industries in these regions had absorbed more knowledge from outside universities than other regions. Compared with the non-local out-licensing data, the non-local in-licensing data had been distributed with much more bias among regions. The standard deviation in Table 2 and Table 3 could reveal this uneven pattern. With identical means, the standard deviation of non-local in-licensing was larger than the standard deviation of non-local out-licensing. This revealed large deviation in the distribution of non-local in-licensing. The non-local in-licensing ratio had been shown in Figure 4 in a line. Still no clear pattern existed on these data.
4. Conclusions
This paper had gone through the data of Chinese academic-industry patent licensing and mainly focused on the performance of different districts. Using patent licensing document analyzing method, the academic-industry knowledge flowing patterns had been discovered.
The academic patent licensing activities had exhibited a localized trend in Chinese regions. As previous works in the regional patent collaboration, Hong (2008) and Gao et al. (2011) had found localized patterns in patent collaboration channel. Our results supported the traditional view on the impact of distances among knowledge transferring. Majority of those 28 regions had exhibited a local knowledge transferring pattern. Local
![]()
Table 3. Non-local in-licensing data of 28 regions.
![]()
Figure 4. Bar diagram of non-local in-licensing data.
Universities had licensed more portion of patents to local industries and local industries had absorbed the majority of licensed technology from local universities. Local universities had made largest technological contribution to local industries. Therefore, public policy should focus on facilitating the knowledge transferring process within regional border.
Different regions had performed differently in various directions of knowledge transferring. This paper had analyzed the patent licensing data in three directions: local universities to local industries, local universities to non-local industries and non-local universities to local industries. The performance of 28 regions had been varied in different directions. Some regions like Jiangsu, Guangdong, Zhejiang, Shanghai and Beijing had engaged in the largest amount of academic patent licensing. Some regions like Neimenggu, Gansu, Guizhou, Xinjiang and Hainan had merely numbers of patents licensed through. Some regions had performed relatively best in local licensing activities, like Anhui. Some regions had licensed out the largest amount of patents to external regions, like Shanghai and Beijing. Some regions had absorbed great amount of knowledge from external universities, like Guangdong and Shandong. Some regions had performed the best in each direction, like Jiangsu. The 28 regions had revealed distinctive patterns in the academic-industry knowledge transferring process. Besides the variances in regional performance, the volume of licensing activities had been spread unevenly in those regions. A very small number of regions had taken up the largest volume of licensing activities in the dataset. The unbalancing patterns of academic knowledge generating and receiving should be taken seriously by policy makers and actions should be made to bridging the gap between knowledge exchange active regions and inactive regions. Since the knowledge transferring patterns had been varied in regional level, the local government of each region should take more responsibility in it. Actions in the local government level should be made to improve regional knowledge transferring performance.
Acknowledgements
This work was supported by the National Natural Science Foundation of China under Grant Nos. 71202054, the Soft Science Research Project of Anhui Province of China under Grant Nos. 1402052002, and “The Fundamental Research Funds for the Central Universities”.
Appendix 1
Inter-regional patent licensing data of 28 regions.
![]()
![]()
![]()
![]()
![]()
![]()
![]()
![]()
![]()
![]()
![]()
![]()
![]()
![]()
![]()
![]()
![]()
![]()
![]()
![]()
![]()
![]()
![]()
![]()
![]()
![]()
![]()
![]()
![]()
![]()
![]()
![]()
![]()
![]()
![]()
![]()
![]()
![]()
![]()
![]()
![]()
![]()
![]()
![]()
![]()
![]()
![]()