Traffic Forecasting and Planning of WiMAX under Multiple Priority Using Fuzzy Time Series Analysis ()
1. Introduction
Fuzzy systems are systems combining fuzzifier, fuzzy rule bases, fuzzy inference engine and defuzzifier (Wang, [1]). The systems have advantages that the developed models are characterized by linguistic interpretability and the generated rules can be understood, verified and extended. As a universal approximator, fuzzy systems have capability to model non stationary time series and give effect of data pre-processing on the forecast performance (Zhang, et al., [2] [3]; Zhang & Qi, [4]). Studying on data pre-processing using soft computing method has been done. Popoola [4] has analyzed effect of data pre-processing on the forecast performance of subtractive clustering fuzzy systems. Then, Popoola [5] has developed fuzzy model for time series using wavelet-based pre- processing method. Wang [1] and Tseng, et al. [6] applied fuzzy model to analyze financial time series data. Not all kinds of series data can be analyzed by conventional time series methods. Song & Chissom [7] introduced fuzzy time series as a dynamic process with linguistic values as its observations. Techniques to model fuzzy time series data are based on fuzzy systems. Network traffic prediction plays a fundamental role in characterizing the network performance [8] and it is of significant interests in many network applications, such as admission control or network management. Therefore, The main idea behind this work, is the development of a WIMAX Traffic Forecasting System for predicting traffic time series based on the daily and monthly traffic data recorded (TRD) with association of feed forward multi-layer perceptron (FFMLP) [9]. The quality of forecasting WIMAX Traffic obtained by comparing different configurations of the FFMLP that consist of investigating different FFMLP model architectures and different Learning Algorithms [10].
The decision of changing the FFMLP architecture is essentially based on prediction results to obtain the FFMLP model for flow traffic prediction model. The different configurations was tested using daily and monthly real traffic data recorded at each of the two base stations (A and B) that belongs to a Libyan WiMAX Network. We evaluate our approach with statistical measurement and a good statistic measure of FMLP indicates the performance of selected neural network configuration [11]. The developed system indicates promising results in which it successfully network traffic prediction through daily and monthly traffic data recorded (TRD) association with artificial neural network.
Fuzzy Time Series
The fuzzy time series model proposed by Song and Chissom [7] consists of two major processes: 1) fuzzification and 2) the establishment of fuzzy relation relationships and forecasting. One study has pointed out that during the fuzzification process, different lengths of intervals will result in various forecasting results, and it has been proposed that the effective lengths of intervals be used [4]. The forecasting results that were based on the effective lengths of intervals were found to outperform those based on arbitrary ones.
Chen’s method uses a simple operation, instead of complex matrix operations, in the establishment step of fuzzy relationships. The algorithm of Chen’s method can be given as follows:
Step 1. Define the universe of discourse and intervals for rules abstraction. Based on the issue domain, the universe of discourse can be defined as: U = [starting, ending]. As the length of interval is determined U can be
Partitioned into several equally length intervals.
Step 2. Define fuzzy sets based on the universe of discourse and fuzzify the historical data.
Step 3. Fuzzify observed rules.
Step 4. Establish fuzzy logical relationships (FLRs) and group them based on the current states of the data of the fuzzy logical relationships.
Step 5. Forecast. Let F(t-1) = Ai
Case 1: If the fuzzy logical relationship of Ai is empty; Ai → Ø, then F(t), forecast value, is equal to Ai.
Case 2: There is only one fuzzy logical relationship in the fuzzy logical relationship sequence. If Ai → Aj, then F(t), forecast value, is equal to Aj.
Case 3: If Ai → Aj1, Aj2, …, Ajk, then F(t), forecast value, is equal to Aj1, Aj2, …, Ajk.
Step 6. Defuzzify. If the forecast of F(t) is Aj1, Aj2, …, Ajk, the defuzzified result is equal to the arithmetic average of the midpoints of Aj1, Aj2, …, Ajk.
2. Methodology
Apart with some modifications Fuzzy Time Series (FTS) models have achieved successes in their own linear or nonlinear domains. Zhang [12] stated that since it is difficult to completely know the characteristics of the data in a real problem, hybrid methodology can be a good strategy for practical use. Liu [13] introduced a combination between decomposition method and FTS for forecasting trend and seasonal time series. In this paper, we proposed a combination method between differencing as data preprocessing method [14] and FTS models for forecasting trend and seasonal time series [15].
Case (1): WIMAX traffic of userA
Trying to estimate the WiMAX Traffic from userA using the daily, weekly and monthly recorded data includes the maximum and the minimum number of online users only, so the Traffic from userA of daily data give as:
T Daily (A) f UserA (X user (Max), X user(Min)) (1)
Case (2): WIMAX traffic of userB
Trying to estimate the WiMAX Traffic from userA using the daily, weekly and monthly recorded data includes the maximum and the minimum number of online users only, so the Traffic from userB of daily data give as:
T Daily (B) f UserB (X user (Max), X user(Min)) (2)
Case (3): WIMAX traffic of userAB
Trying to estimate the WiMAX Traffic from userAB using the daily, weekly and monthly recorded data includes the maximum and the minimum number of online users only, so the Traffic from userB of daily data give as:
T Daily (AB) f UserAB (X user (Max), X user(Min)) (3)
where,
T Daily(A, B, AB) represents the WiMAX traffic from userA, userB and userAB users (byte) respectively.
X user (Max), X user (Min) represent the maximum and the minimum number of online (Max-online) and (Min-online) respectively.
Three differencing process are used in this study, the original series become three new series:
TA = F(t) − F(t − 1) (4)
TB = F(t) − F(t − 2) (5)
TAB = F(t) − F(t − 3) (6)
In summary, the proposed methodology of the FITS system consists of two steps. In the first step, a differencing is used to make stationary process. In the second step, a FTS model is developed to model the differencing data. In this second step, we apply four FTS models proposed by Chen [16], Yu [17], Cheng et al. [18], and Lee and Suhartono [19]. The proposed method exploits the unique feature and strength of FITS model in determining different patterns. Thus, it could be advantageous to model trend, seasonal, and nonlinear patterns separately by using different models and then combine the forecasts to improve the overall modeling and forecasting performance.
To validate the methodology of the FITS method for forecasting trend and seasonal time series data, a new algorithm is proposed as follows:
Step 1. Apply differencing to get the stationary process, TA, TB and TAB
Step 2. Apply FTS method to model the differencing data and get the forecast component of the stationary process, YA(t), YB(t), and YAB(t). In this step, four FTS methods proposed by Chen [16], Yu [17], Cheng et al. [18], and Lee and Suhartono [19] are applied to find the best forecasted values.
Step 3. Calculate the final forecast values at the same original data scale.
1. For UserA differencing data
UA (t) = YA(t) + F(t − 1) (7)
2. For UserB differencing data
UB (t) = YB(t) + F(t − 2) (8)
3. For both UserAB differencing data
UAB (t) = YAB(t) + F(t − 3) (9)
Now Mean Square Error can be calculated as below:
MSE = (∑t = 1 to n [{F(t) - U(t)}2/n])1/2 (10)
where n is the number of forecasts.
3. Result and Discussions
Weekly, monthly and daily data are taken in three category and intermediate of them as shown below:
We have taken the traffic data with 51 in samples and 130 out samples for UserA, UserB and UserAB using FTS method is shown below:
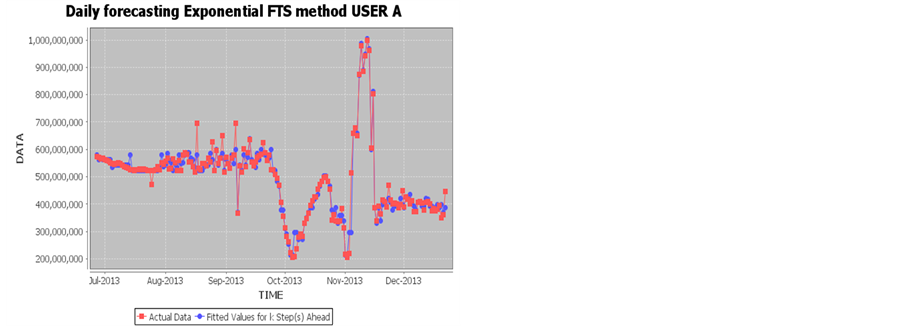
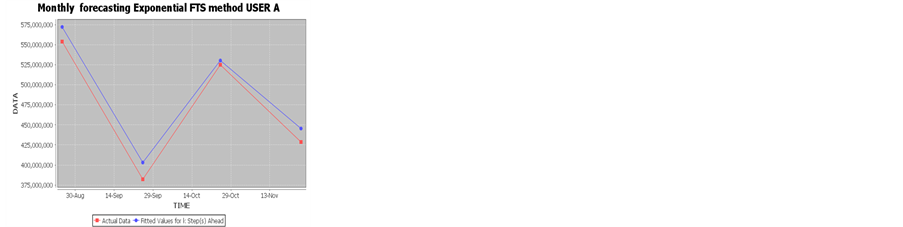
Exponential FTS USER A: 2013m06d25
Daily forecasting Exponential FTS method USER A: Number of outsamples: 130; Number of insample: 51
D1: 100, d2: 100; Order 1,2 E:\FUZZY_forecasting_SYSTEM

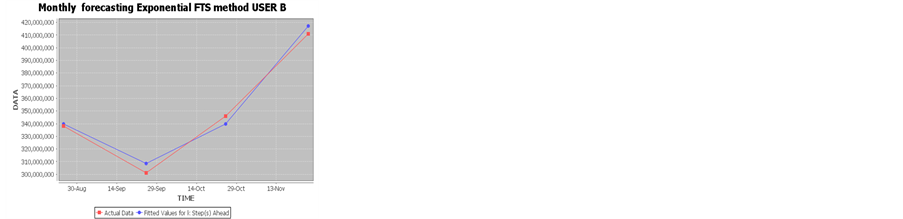
Exponential FTS USER B: 2013m06d25
Daily forecasting Exponential FTS method USER B: Number of outsamples: 130; Number of insample: 51
D1: 100, d2: 100; Order 1,2 E:\FUZZY_forecasting_SYSTEM


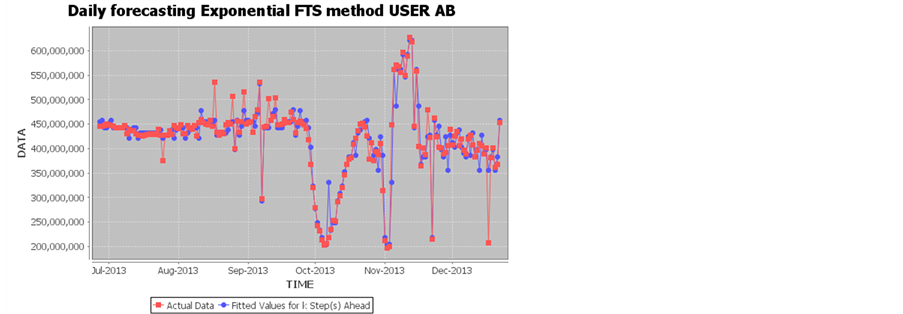
Exponential FTS USER AB: 2013m06d25
Daily forecasting Exponential FTS method USER AB; Number of outsamples: 130; Number of insample: 51
D1: 100, d2: 100; Order 1,2 E:\FUZZY_forecasting_SYSTEM

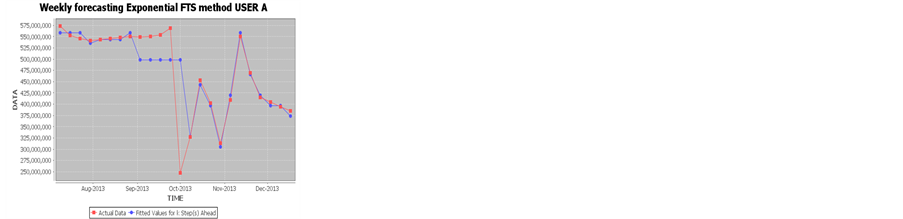
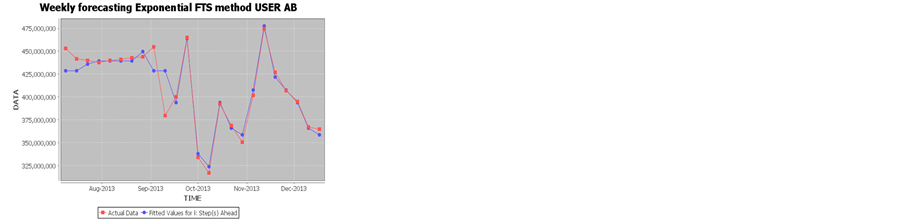
Similarly weekly and monthly data are taken for User A, B and AB


Daily fuzzy time series forecasting results
Mse all: mean square error for all; Mse-in: mean square error for insamples; Mse-o: mean square error for outsamples; l. intr: length of intervals.
The results shows that in case of Weekly data, overall MSE is least for Use rAB, insamples MSE is least for User B, out samples MSE is least for User AB, intermediate MSE is least for User B and MSE fiited v is least for User B.
In case of Monthly data, overall MSE is least for User B, in samples MSE is least for User A, outsamples MSE is least for User B, intermediate MSE is least for User B and MSE fited v is least for User AB.
In case of Daily data, overall MSE is least for Use rAB, in samples MSE is least for User B, outsamples MSE is least for User AB, intermediate MSE is least for User AB and MSE fiited v is least for User AB.
4. Conclusion
In this paper we have used FTS method for forecasting of WIMAX data traffic inbound and outbound which leads to seeking for accuracy in the term of Mean Square Error (MSE). The modeling uses classical FTS to the weighted FTS and finally the differencing provides the accurate results near to actual ones.
Acknowledgements
The authors thank LibyaMax network (WiMAX technology) motorized by Libya Telecom and Technology forproviding us the WiMAX traffic data and for helpful discussions around WiMAX network. We also thank staff of Faculty of Science and Technology, University Sains Islam Malaysia for their help and support.