Long-Term Impact of Maternal Protein Malnutrition on Learning and Memory Abilities and DNA Methylating Profiles of the Nervous System in Offspring Rats ()
1. Introduction
A hypothesis concerning the fetal origins of adult disease (FOAD) which was based on initial retrospective cohort studies that were performed by Barker et al. [1] [2] in 1980s stated that these late-onset diseases can originate from events that occur in utero, and the adverse intrauterine environment can influence fetal developmental programming, causing permanent changes in organ structure and function and leading to functional disorders and adult diseases [3] [4] .
Studies on FOAD have obtained retrospective analyses of human [5] and animal models that have linked low birth weight with diabetes [6] -[8] and hypertension [9] in adulthood, as well as epidemiological research has reported the relationship between birth weight and long-term cognitive and behavioral defects of offspring. But still few studies focused on the long-term impact of maternal protein malnutrition on the cognitive and learning capabilities of the offspring [10] [11] .
It is well known that DNA methylation is an important mechanism that plays important roles in the maintenance of cell function, in the embryonic development process and in genetic imprinting [12] . Studies have found that a number of imprinted genes produce important effects on the embryo and fetus after their birth, influencing the regulation of behavior and brain function [13] . DNA demethylation [14] [15] and hypermethylation [16] -[18] effects lead to changes in aging-related and psycho-related genes [19] . Thus, we hypothesized that maternal protein malnutrition could influence the epigenetic status of the offspring during the embryonic development period.
The aim of this study was to explore the possible mechanism of long-term alterations in learning and memory abilities of the offspring of rats with protein deficiency during pregnancy. Using rat models, we investigated the long-term effects on the learning and cognitive abilities of 8-week-old offspring and investigated changes in the epigenetic state and protein expression levels.
2. Materials and Methods
2.1. Animals
Virgin female Sprague-Dawley rats, weighing 230 - 260 g, were obtained from B & K Laboratory Animal CO. (Shanghai, China), and mated to males of the same strain at a proportion of 1 to 1. After mating was confirmed by the visualization of spermatozoa in a vaginal smear, the pregnant rats were divided randomly into a control (C group, n = 23) and a low-protein (LP group, n = 19) group. Rats in the control group were fed with a diet containing 18% protein (180 g protein/kg), while those in the low-protein group were fed with a low-protein diet that contained 7% protein (70 g protein/kg).
Figure 1 showed the animal treatments and monitoring: Pregnant rats (C group n = 13, LP group n = 9) were fed ad libitum during lactation and at birth each litter was culled to 6 - 10 pups maintaining as close to a 1:1 male to female ratio. After weaning (21 days), all pups received a standard laboratory chow diet until the end of the experiment. They participated in the Morris water maze task, and body weight and serum glucose measurements were obtained at postnatal 8 weeks. The 8-week-old offspring rats’ whole brain tissue was prepared as paraffin sections for immunohistochemistry. The other rats’ brain tissue were removed after anesthesia, frozen in liquid nitrogen, and saved in clean uniform freezing tubes. All the hippocampus tissue of those samples were placed in an −80˚C refrigerator for storage before undergoing NimbleGen MeDIP-chip assays, Western Blot and real-time PCR. When the offsprings reached the age of 1 year, they were again tested with the Morris water maze. The weight of each pup was recorded on the day after birth and every 7 days thereafter, until 100 days after birth. Additional measurements were taken after 100, 120, 150, and 180 days, and 1 year. Serum glucose concentrations of the offspring in the control and low-protein groups were determined with a blood glucose monitor (One Touch Ultra, Johnson Company) after 100 days, 120 days, 150 days, 180 days, and 1 year. (C group n = 12, LP group n = 12, 1:1 male to female ratio). The other pregnant rats (C group, n = 10; LP group, n = 10) were killed by cervical

Figure 1. Animal treatments and monitoring.
vertebra dislocation on the 21st day of gestation, and the truncal blood was collected. Blood and relative organs of all live fetal rats were collected by decapitation. The maternal and fetal blood samples were collected for the measurement of corticosterone, ACTH and insulin. The maternal and fetal blood samples were collected and centrifuged immediately at 3000 g for 10 min. Serum was stored at −70˚C until the assay was conducted. Corticosterone, ACTH and insulin were analyzed by enzyme-linked immunosorbent assay (DSL-1081100 (Rat Corticosterone, EIA); BACHEM S-1130.0001 (ACTH (1-39)-EIA Kit); Alpco Diagnostics (80-INSRTU-E01; detected by SUNRISE: 03930004914). The decapitated fetal rats were perfused with physiological saline followed by 10% formalin. Their organs, such as the brain, adrenals, etc. were placed in 10% formalin. They were then dehydrated in ethanol and embedded in paraffin and cut into sections on glass slides, and examined under a light microscope (OLYMPUS, BX60, Japan).
2.2. Morris Water Maze
The Morris water maze is one of the most widely used tasks in behavioral neuroscience for studying the psychological processes and neural mechanisms of spatial learning and memory [20] [21] . The apparatus was a black circular swimming pool, made of plastic. It measured 1.60 m in diameter and 0.50 m deep, and was filled to a depth of 0.30 m with water. The water temperature was maintained at 20˚C ± 2˚C. The pool was divided into 4 quadrants (I, II, III, IV), and a black circular platform, 0.10 m in diameter, could be placed in the center of the quadrant IV, submerged 2 cm below the water surface (Figure 2(a)). Spatial learning is assessed across repeated trials (navigation trial) and reference memory is determined by preference for the platform area when the platform is absent (probe trial). Eight-week-old and one-year-old offspring of both groups were placed in a large circular pool of water, and they were required to escape from the water onto a hidden platform, the location of which could normally be identified using only spatial memory. In the navigation trial, each rat was given daily trials using a random set of start locations for four days. The rats can learn to navigate a direct path to the hidden platform. We recorded swimming distance and the time as escape latency. In the probe trial, the platform was removed. Each rat was given trial using a fixing set of start locations for just one day. A video camera was fixed above the pool, and its picture was relayed to recording equipment.
2.3. NimbleGen MeDIP-Chip, Bioinformatics, and Statistical Analysis
The methylation status of the global DNA of three individual samples of each group was determined with a
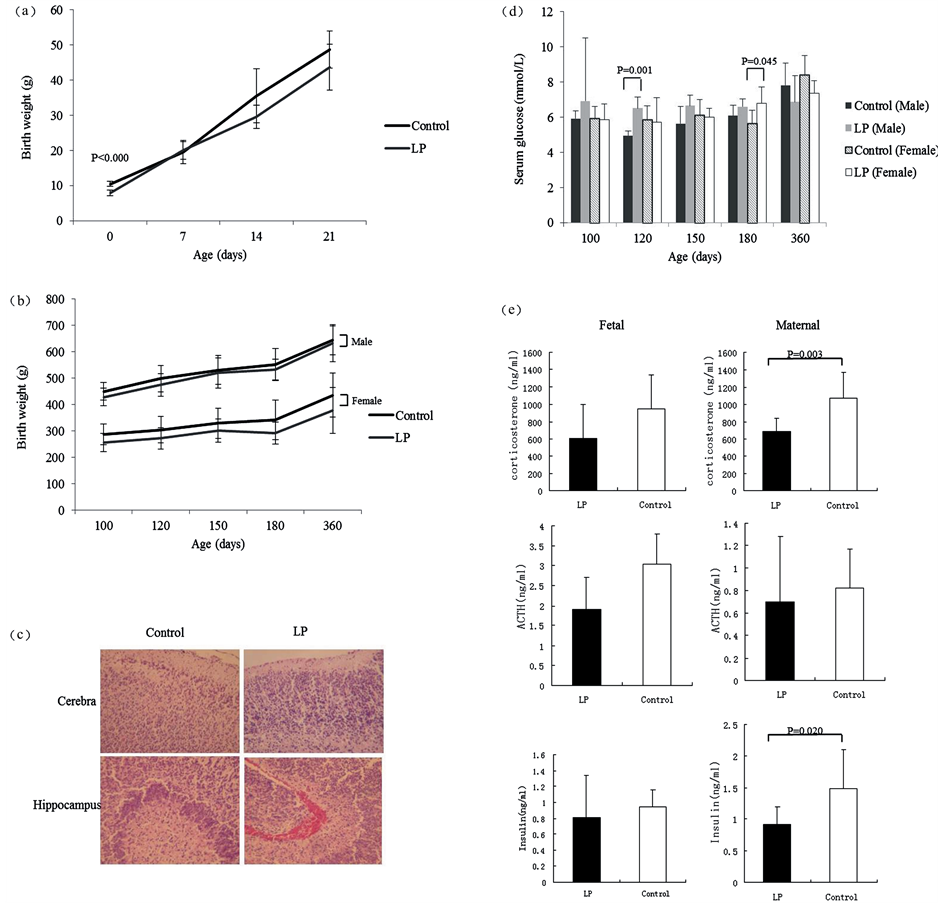
Figure 2. Appearance at birth and growth trend of offspring rats. (a) Body weight of rats in postnatal 21 days; (b) Body weight of rats in both sexes in postnatal 1 year; (c) Fetal cerebral pathological changes in both group; (d) Serum glucose of rats in both sexes at different ages in postnatal 1 year; (e) Fetal and maternal corticosterone, ACTH and insulin levels in LP and control groups.
MeDIP-chip using the MeDIP-chip kit, according to the NimbleGen MeDIP-chip protocol. Genomic DNA from whole brain tissues was extracted and sonicated to random fragments of approximately 500 bp in size. Immunoprecipitation of methylated DNA was performed using a mouse monoclonal antibody against 5-methylcytidine (Diagenode) and BiomagTM magnetic beads (Bangs laboratories, Inc.) coupled to anti-mouse IgG (Jackson). Immunoprecipitated DNA was eluted and purified by phenol chloroform extraction and ethanol precipitation. The Input and IP DNA were labeled with Cy3- and Cy5-labeled random 9-mers (TriLink Biotechnologies, Cat. # N46-0001-50, N46-0002-50), respectively, and hybridized to NimbleGenRN34 CpG IslandPro arrays. These components comprise a single array design containing all known CpG islands, annotated by UCSC and all wellcharacterized RefSeq promoter regions (from about −1300 bp to +500 bp of the TSSs),which are completely covered by ~385,000 probes. Scanning was performed with the Axon GenePix 4000B microarray scanner. The sample analysis was accomplished using Kangcheng Bio-tech, Shanghai by Nimble Scan software.
Based on the results of microarray hybridization data, the area of each sample in which DNA methylation most likely occurred was called peak. Genes with altered DNA methylation in the CpG islands of the promoter or with changes between the two groups of rats were subjected to the following bioinformatics analyses.
Comparisons between groups were performed with selected genes with elevated or decreased peaks between the samples in each group. Those possibly differentially methylated genes underwent further GO enrichment analysis. GO terms with an enrichment P-value of 0.05 or less were considered to be significant. Similar to GO enrichment analysis, we also analyzed the enrichment of the KEGG pathway. Here, the cut-off for significance was set at <0.05.
2.4. Methylation Status of CpG Islands of 5 Genes and Dual-Luciferase Report Detection
The methylation profiles of 5 genes (Grin1, Grin2b, Drd1a, Drd2 and Nr3c1, which corresponded to NMDAR1, NMDAR2B, DR1, DR2 and GR, respectively) in the brain tissue of the 8-week-old offspring of both groups were determined by bisulfite DNA sequencing, following the MASSARRY EpiTyper protocol. The resultant methylation profiles were analyzed on EpiTyper software to generate quantitative CpG methylation results.
A Dual-Luciferase® Reporter Assay System (P/N E1910) was purchased from Promega Corporation (Madison WI). The target sequences were based on the CpG island methylation results, which were amplified with RT-PCR (Supplementary Table 1 shows the primer sequences), and then cloned into PGL3-Basic vector and PGL3-Promoter vector. The recombinant vectors were confirmed by restriction enzyme digestion, colony PCR and sequencing; they then were transfected into HEK293T cells to detect the most probable binding site by dual-luciferase report assay. Each bar represents the mean ± SE of five replicate samples and the data are representative of three independent experiments.
2.5. Protein Expression
2.5.1. Immunohistochemistry
Deparaffinized samples were prepared with 0.3% H2O2 for 15 min, followed by blocking with 0.1% Triton-x- 100 3% BSA for 30 min. Dropped antibody NMDAR1, NMDAR2B, DR1 (Wuhan Boster Company BA0612, BA0614, BA08031:100), DR2 (Wuhan Boster Company BA0804 1:20), GR (Wuhan Boster Company BA0895 1:40) were diluted by Triton-x-100 TBS (PH = 7) and applied onto the sections, with TBS as a negative control. These sections were maintained at 4˚C overnight in a humidified chamber. Then, the sections were dropped in SABC (Gene Technology Co., Ltd. Shanghai) liquid at room temperature for 30 min, colored by DAB, and washed with water and hematoxylin for 10 s. Sections were examined under a light microscope (OLYMPUS, BX60, Japan).
2.5.2. Western Blotting
Sixty micrograms of each sample were resolved by polycrylamide gel electrophoresis on 12% SDS-PAGE polycrylamide gels and electro transferred to PVDF membranes. After blocking in 10% non-fat dry milk for 120min, membranes were incubated with specific primary antibodies overnight at 4˚C. The horseradish-off oxide enzyme-labeled goat anti-rabbit antibody (Beijing Dingguo BioCo IA-0072.) was used as a secondary antibody for 60 min with a dilution of 1:2500. Each step was rinsed by TBST 5 min three times. Chemiluminescent detection methods were used for the membranes. Band Scan 5.0 graphical analysis of the system was used for the results. The gray value ratios of the target protein and the internal reference GAPDH represented the relative expression levels of NMDAR1, NMDAR2B, DR1, DR2 and GR in the rats’ brain tissues.
2.5.3. Real-Time Polymerase Chain Reaction
Total RNA was extracted from the brain tissue using Tirol (Invitrogen, Carlsbad, CA) according to the manufacturer’s instructions. The cDNA was synthesized from 2 μg of total RNA extraction. The primers used in the experiment were synthesized by the Shanghai Yingjun Company (Supplementary Table 2 shows the primer sequences). The amount of template cDNA and the number of cycles used were as described in the SYBR Premix Ex TaqTM kit (TaKaRa Biotechnology (Dalian) Co., Ltd). The results were normalized for 18 s as an internal standard. The following formulas were used to analyze the results of the relative quantitative real-time PCR.
Relative quantification of the target gene was obtained by comparing its CT values with that of the internal reference gene. Formula: the relative content (%) = 2−ΔΔCT × 100%,in which ΔΔCT = (CTtarget gene – CThousekeeping gene)experimental group – (CTtarget gene – CThousekeeping gene)control group. The data of the experimental groups were standardized via the detection and data analysis of the SYBR Green I fluorescence real-time quantitative PCR method.
2.6. Data Analysis
Experimental results are expressed as the means ± SEM. Significant differences between the groups were analyzed using t-tests and one-way ANOVA. The statistical software package SPSS 12.0 (SPSS Inc., Chicago, IL) was used for all data analysis.
3. Results
3.1. Appearance at Birth and Growth Trend of the Offspring Rats
At birth, the offspring rats of the low-protein group (7.89 ± 0.84 g) weighed less than those of the control group (10.44 ± 0.72 g) by 22.50% (Figure 2(a)), and they had neurogliocyte hyperplasia in the cerebral cortex and medullary substance and neurogliocyte hyperplasia in the hippocampus (Figure 2(c)). The fetal serum corticosterone and insulin levels in the low-protein group were significantly lower than those of the control group (p = 0.003, p = 0.020, respectively) (Figure 2(e)). However, there was no significant change in the maternal hormone level between the two groups. The fetal serum corticosterone and insulin levels in low-protein group was significantly lower than control group (680.56 ± 161.78 ng/ml vs. 1073.20 ± 294.37 ng/ml, p = 0.003, 0.91 ± 0.28 ng/ml vs. 1.48 ± 0.62 ng/ml, p = 0.020, respectively) (Figure 2(e)).
After birth, there was no significant difference in body weight between the low-protein and control groups from 7 postnatal days to 1 year of age (Figure 2(b)). However, the serum glucose in the low-protein group trended to be higher than that in the control group, especially in males on day 120 (p = 0.001) and in females on day 180 (p = 0.045) (Figure 2(d)).
3.2. Assessment of Offspring Rats’ Spatial Ability
Figure 3(b) shows the learning curves of the training trials for all rats. The latencies tended to decrease from Day 1 to Day 4 in both two groups, in both 8-week-old and 1-year-old animals. At 8 weeks old, all rats of the control group improved their performance as the training trials progressed. However, the learning pattern of the low-protein rats was different from that of the control group: the latency decreased sharply on Day 2, especially in female rats (p = 0.035), and then was maintained at almost the same level on Day 3 and Day 4. At 1 year of age, all rats of both groups improved their performances as the training trials progressed. However, the latencies of the female offspring in the low-protein group tended to increase compared with those of the control group, which indicated a worse performance, especially on Day 3 (p = 0.041). However, the male rats of the low-protein group learned the Morris water maze task in the same manner as the control animals, with no significant changes in the latency in reaching the platform.
Figure 3(c) shows the percentage of time spent in quadrant IV during the 30 s probe trial provided after training. The percent of time in the target quadrant did not significantly differ between low-protein and control groups at either 8 weeks or 1 year old. One-year-old female rats of the low-protein group spent slightly less time swimming in quadrant IV (which previously contained the platform)
3.3. Changes of DNA Methylation in the Brain Tissue of Offspring in 8-Week-Old
MeDIP-chip revealed that there were 1181 genes with changed methylation statesin the CpG island, with 542 (45.85%) genes hypermethylated and 639 (54.15%) genes demethylated in the low-protein group. GO analysis of the low-protein group demonstrated that53 GO terms were enriched in hypermethylated genes in CpG islands. In addition, there were 138 GO terms enriched in demethylated genes, with one GO term related to memory (p = 0.0029), three GO terms related to neurodevelopment, including forebrain development (p = 5.58E−06), midbrain development (p = 0.0032) and neuron maturation (p = 0.0342), as well as one GO term related to the neuropeptide signaling pathway (p = 0.0047) (Table 1). Five different methylation pathways were found with KEGG pathway analysis, including a neuroactive ligand-receptor interaction (p = 0.0028) (Table 2). Supplementary Table 3 and Table 4 show more details.
Furthermore, 2008 genes showed changes in methylation in the promoter area, with 1018 (50.70%) genes hypermethylated and 990 (49.30%) genes demethylated. GO analysis revealed that hypermethylated and demethylated genes were enriched with 52 and 140 GO terms, respectively. Out of 140 GO terms, two were related to neurodevelopment, including central nerve system development (p = 0.0252) and brain development (p = 0.0426),
 (a)
(a) (b)
(b) (c)
(c)
Figure 3. (a) Morris water maze; (b) Morris water maze latency to platform over days during the training trial and percent time spent in IV quadrant during the probe trial for all rats of 8-week and 1-year-old; (c) Percent time spent in quadrant IV of 8-week and 1-year-old rats.

Table 1. Genetic function classification of demethylated genes in the experimental group, which was associated with the nervous system.
Table 2. Differential methylation pathways.
one was related to the neuropeptide signaling pathway (p = 0.0042), and one was related to the regulation of neurogenesis (p = 0.0336) (Table 1). Four different methylation pathways were screened with KEGG pathway analysis (Table 2), and the neuroactive ligand-receptor interaction, the calcium signaling pathway and the ECMreceptor interaction were highly correlated (p < 0.05). Supplementary Table 5 and Table 6 show more details.
In addition, KEGG pathway analysis showed that the neuroactive ligand-receptor interaction, the calcium signaling pathway and the ECM-receptor interaction were the three methylated pathways that participate in long-term potentiation (LTP) and synaptic transmission. LTP is a form of synaptic plasticity in the cells of the nervous system that is the basis of learning and memory. The NMDA receptor channel, a voltage, dual ligandgated channel, plays an important role in the induction and maintenance of LTP (Figure 4(d)).
3.4. Methylation Status of CpG Islands in 5 Genes
Beyond the results of GO analysis and the analysis of the KEGG pathway, we focused on the changes in the methylation status of NMDA (N-methy-D-aspartate) receptor genes (Grin1 and Grin2b), as well as dopamine receptor (DR) genes (Drd1a and Drd2) and glucocorticoid receptor (GR) gene (Nr3c1), which are based on current studies on the receptors involved in study and memory abilities.
The methylation status was studied in the hippocampus tissue of the 8-week-old offspring of both the lowprotein group and the control group. The MASSARRY EpiTyper results showed that there were 3 Grin2b promoters that contained 50 CpG sites, 4 Drd1a promoters that contained 54 CpG sites, and the Nr3c1 promoter contained 18 CpG sites in the 8-week-old offspring rats’ brain tissue; however, there were few CpG sites in the Grin1 and Drd2 promoters. On the basis of the above sequencing data, we proceeded to validate the degree of methylation of the Grin2b, Drda and Nr3c1 promoters.
Though the CpG sites, Grin2b 3CpG_1, 2 (p = 0.037), Grin2b 3CpG 3, 4, 5 (p = 0.000) (Figure 4(a)) and Drd1a 2_CpG_14 (p = 0.016) (Figure 4(b)) exhibited statistically significant differences between the two groups, there were no significant differences in the other CpG sites of gene promoters (Figure 4(c)).
3.5. Dual-Luciferase Report Detection
The target sequences were Grin2b_3CpG 3, 4, 5, which were 89bp. PCR and sequencing results indicated that the amplified sequence was correct ( Figure 5(A)), which indicated that the recombinant vectors PGL3-BasicGrin2b and PGL3-Promoter-Grin2b were successfully constructed.
The luciferase reporter system showed that the transcription activation of pGL3-Basic-Grin2b was lower than that of pGL3-Basic after 28 h (p = 0.0013) and after 40 h (p = 0.0449) (Figure 5(B1)). The transcription activation of pGL3-Promoter-Grin2b was greater than that of the pGL3-promoter after 28 h (p = 0.07), but was much lower after 40 h (p = 0.0033) (Figure 5(B2)).
3.6. Changes of Related Protein Expression in the Brain Tissue of Adolescent Offspring
To determine whether the effect of maternal protein malnutrition on offspring rats would change protein expression in the offspring’s brains, the location and expression of those five related proteins were evaluated in 8- week-old offspring’s brain tissue in both groups.
Compared with the control group, there were decreases in NMDAR1 and NMDAR2B in 8-week-old offspring rats’ brain tissue, which were reflected in the reduction of total immune reactive neuron cell numbers in either NMDAR1or NMRAR2B, and significantly lower relative expression levels (p = 0.02 and p = 0.03, respectively). In addition, the gene expression of NMDAR2B mRNA was relatively decreased in the low-protein group (p = 0.02) (Figure 6(a), Figure 6(b) and Figure 6(f)).
Though there were no significant differences between both groups in DR1, DR2 or GR in 8-week-old offspring rats’ brain tissue, there was an obvious reduction in the number of pyramidal cells and in the synaptic staining of immunoreactive neurons of DR1. Additionally, a downward trend of immunoreactive neurons of DR2 was found in the number of total cells in the low-protein group (Figure 6(c) to Figure 6(f))
4. Discussion
Our study showed that maternal protein malnutrition resulted in epigenetic changes of uterine environment, which induced long-term neurological damage and influenced the cognitive and learning capabilities of the offspring after birth. These effects were indicated by the changes in learning and memory abilities in both 8-week-old and 1-year-old rat, which relative age is about 13-year-old and 30-year-old in human respectively, as well as by the varying patterns of DNA methylation and changes in protein expression, especially in the Grin2b gene and the NMDAR2B protein receptor.
We detected a significant decrease in transcription activation in the target site, which might cause hypermethylation at the Grin2b_3CpG 3, 4, & 5 site and influence the gene expression of NMDAR2B, which was decreased in the experimental group. Generally, methylation at the CpG islands in the gene promoter favors transcriptional repression [22] . A recent study shows that NMDA receptor-mediated synaptic activity drives DNA
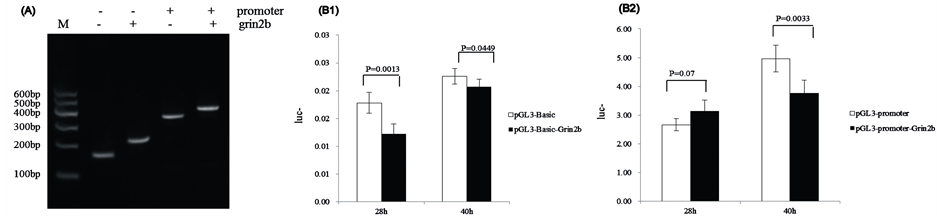
Figure 5. Signal of Firefly and Renilla Luciferase when measured in a Dual Luciferase Assay. (A) Identification of the recombinant plasmid pGL3-Basic+/-Grin2b and pGL3-Promoter+/-Grin2b with restriction enzyme digestion and colony PCR. M) DNA marker; (B1) Vector pGL3-Basic vs vector pGL3-Basic-Grin2b (28 h; 40 h); (B2) Vector pGL3-Promoter vs vector pGL3-Promoter-Grin2b (28 h; 40 h).
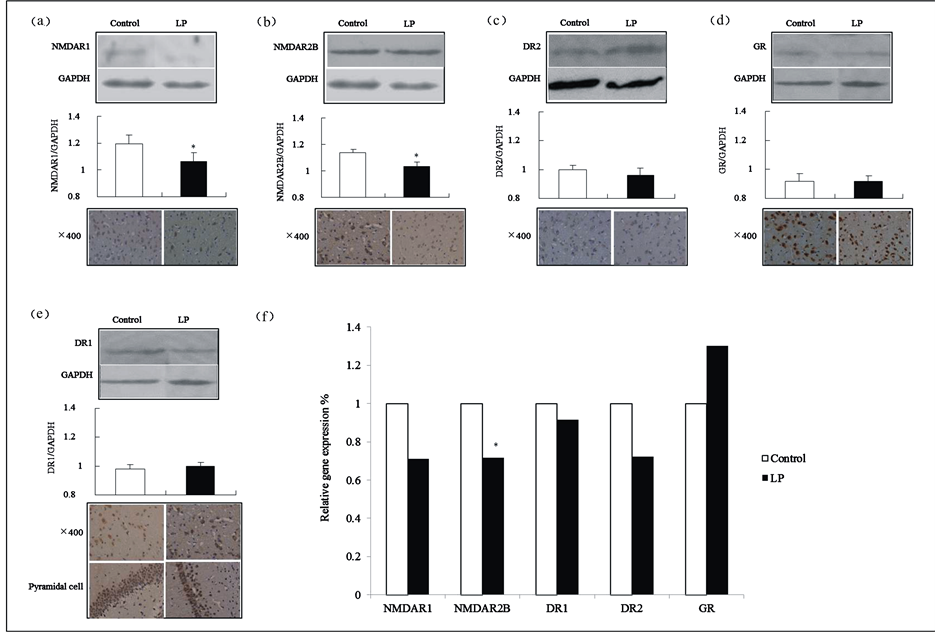
Figure 6. Protein expressions in 8-week-old offspring rats’ brain tissue. (a)-(e) show Western blotting and immunohistochemical results for NMDAR1, NMDAR2B, DR1, DR2 and GR; (f) The reference factor was the data gathered on the five types of target gene mRNAs of the control group.
demethylation within mature neurons and suppresses synaptic function [23] . Thus, several changes in methylation in the hippocampus of 8-week-old offspring rats was found, and had an effect on the methylation status of the Grin2b promoter; it also produced a decrease in the expression of NMDAR2B in offspring, which played an important role in the LTP effect. The LTP effect is the basis of learning and memory in the hippocampus, the key structure in controlling spatial orientation [24] [25] , which is susceptible to damage under acute and chronic stress [26] . The embryonic and fetal period is the most vulnerable stage during pregnancy. It was speculated that thein utero effect on the hippocampus might be the early stage of cognitive and learning dysfunction of offspring, as previous studies have shown that this anatomical abnormality may lead to deficits in hippocampal-related behaviors [27] -[29] . The LTP effect involved histone modification and DNA methylation [30] -[33] . Additionally, the key receptors, NMDA receptors, are involved in a wide range of learning and memory activities, synaptic plasticity, neural development, ischemic brain injury, neurodegeneration, epilepsy, cancer and many other important physiological and pathological processes [34] -[37] .
Also, there was an adverse impact on the learning pattern in both 8-week-old and 1-year-old offspring, accompanied by a lower birth weight associated with catch-up growth, increased serum glucose level, reduced serum corticosterone and ACTH levels of offspring, and morphological changes in cerebral histiocytes, including the fetal hippocampus, similar to the findings of human epidemiology studies [38] -[40] .
5. Conclusion
In summary, maternal protein malnutrition resulted in themethylation of the Grin2b promoter in the offspring’s brain tissues, which had a long-term impact on NMDAR2B expression during the embryonic development period and facilitated themaintenance of differential expression as aging progressed. Through the methylation status of Grin2b and the differential expression of NMDAR2B, the offspring presented with a long-term dysfunction in cognitive and learning abilities. However, our findings do not support a causal link between methylation regulation of Grin2b promoters and the dysfunction in cognitive and learning abilities, which strongly suggests that other mechanisms may be also involved. Results from more animals should be compared and analyzed, and further clinical evidence is needed to prove this theory.
Acknowledgements
This work was supported in part by the Fund of Science and Technology Commission of Shanghai (064909006), National Key Basic Research Plan of China (973 Plan; Grant No.: 2010CB529500), National Science Fund of China (Grant No.: 30872777), the Key Project of Clinical Disciplines of Chinese Ministry of Health (Grant No.: 2007-353), and the Key Projects in the National Science and Technology Pillar Program in the Eleventh FiveYear Plan Period (Grant No.: 2006BAI05A05).
NOTES
*Corresponding author.