Short-Term Field Decomposition and Physico-Chemical Transformation of Jatropha Pod Biochar in Acidic Mineral Soil ()
1. Introduction
Biochar is recognized as C sequester due to its stability and long resident time in soil. Traces of biochar are still found in the Terra preta of Amazon millennia after the last burning [1] . However, biochar is not invulnerable to abiotic and biotic processes and could be degraded over time. In soil, biochar is exposed to a complex system of physico-chemical process causing various changes to it. Biochar experienced surface oxidation and acquired O functionalities like phenolic, carboxylic and hydroxyl after incorporated in soil for a short time span [2] . Moreover, further oxidation on biochar could alter its hydrophobic nature into hydrophilic due to the evolution of surface positive charges into negatively charged functionality [3] .
The hydrophilic nature of aged biochar promotes chemisorptions of readily available organic C and soil minerals; decreasing its surface area, over time [4] . Large and complex organic matter like humic acid was found adsorbed < 2 nm to pores on the external surfaces of powdered wood biochar [5] . Reference [6] reported Fe, Al and Si coatings on biochar that has been to soil for 10 years. This indicates possible complexation and bridging between negatively charged biochar and the positively charged minerals. These interactions rendered biochar biologically unavailable due to the occupied surface and pores, protecting the biochar from chemical degradation.
Biochar decomposition occured into two phases, the volatile and fast degradation of labile fraction and the near stagnant slower degradation of recalcitrant fraction [8] . Volatile phases are attributed to the labile fraction of biochar such as carbohydrates and mineral carbonates are rapidly lost or degraded. Meanwhile, the near stagnant phase was due to the recalcitrant fraction of biochar that lasts for decades or hundreds of years. This fraction arises from stable chemical structure derived from high temperature restructuring during the pyrolysis process. Thus, stability of biochar depends on the inherent properties of the feedstock and the pyrolysis condition.
Studying the short-term biochar decomposition and transformation can provide more clues in predicting long-term stability of biochar. However, most incubation studies [9] [10] excluded the environmental factors from the measurement. Environmental factors such as rainfall are prominent in the volatile tropical weather and could exert serious impact on the degradation of biochar. In this study, we determined the 16 months decomposition and transformation of biochar produced from seed pods of Jatropha curcas in acidic mineral soil. The decomposition of the biochar was fitted to a decay model.
2. Materials and Methods
The JPB used in this study was produced in the laboratory at 275˚C for 3 h with a Carbolite ELF 11/23 type furnace. Raw Jatropha pod (RJP) feedstock was obtained from the Jatropha planting field of UPM. It was air-dried and chipped into small pieces (3 - 5 cm) before pyrolysis. The JPB obtained was ground and sieved to 2 mm. Field decomposition study was based on 2 mm JPB.
2.1. Chemical Composition and Surface Area
The C, H, N and O content were analyzed using CHNS-O analyzer (LECO TruSpec CHN). Combustion temperature of the analyzer was at 950˚C with infrared (IR) baseline time of 2 s. Burning was divided into 3 phases; starting with 30 s high furnace flow followed by 180 s medium flow and backed to 30 s high furnace flow. Iron (Fe) content was determined using the dry ashing method [11] and Atomic Absorption Spectrophotometry (Thermo Scientific S-Series). The surface area was determined using a surface area analyzer (Quantachrome Autosorb-1) applying the Brunauer, Emmet and Teller method. Data and isotherm graph were processed or generated with AUTOSORB software.
2.2. Surface Chemistry and C Skeletal Structure
The infrared spectral properties of JPB were determined by Perkin-Elmer Spectrum 100 Spectrometer with a Perkin-Elmer Universal Attenuated Total Reflectance (ATR) sampling accessory. The results were normalized to highest peak ranged from 400 to 4000 cm−1 with 32 accumulations. Resolution was at 4 cm−1 and 1 cm−1 interval. Data collection and processing were conducted using Spectrum version 6.2.0.0055 software. The C skeletal structure of JPB was determined by a 13C solid state NMR (Bruker Avance 300 MHz).
2.3. Field Decomposition Study
The litterbag method [12] was used for this field decomposition study. Approximately 6 g of JPB was placed in a 6.5 × 10.5 cm nylon bag of 250 µm mesh. The weight of the nylon bags was predetermined. A total of 32 nylon bags were randomly buried vertically at 0 - 10 cm depth in acidic mineral soil of the Batu Lapan series (Plinthic Paleudult) in University Agriculture Park, Plot D, UPM, Malaysia. Elemental characteristics are given in Table1
A total of 8 bags were recovered every4 months till the end of the decomposition study of 16 months. The harvested nylon bags were cleared of foreign materials and oven-dried at 60˚C till constant weight to obtain the dry weight. The weight loss of JPB from its initial weight over 16 months period was plotted and fitted into several decay models.
2.4. Decomposition Model and Statistical Analysis
The field decomposition data over the 16 months were fitted into hyperbolic, single exponential and double exponential decay models. The decay models were generated by using the Marquardt-Levenberg algorithm in SigmaPlot version 11.0 software to obtain the coefficients of the independent variables. The trend of JPB mass remaining over time was determined using the regression analysis of the SigmaPlot version 11.0
3. Results and Discussion
3.1. Elemental Composition and Physical Changes
The elemental composition alteration of JPB over 16 months is summarized in Table2 The total C content varied without any specific pattern. This could be attributed to the dynamic continuum of surface adsorption and loss of volatile C such as dissolved organic C on JPB. Total H decreased from JP 0 M to JP 12 M but there was an increase from 12 M to JP 16 M. Total O content showed similar pattern as the total H with a gradual decrease over 16 months but there was an increase from 12 M to 16 M. The increase of total O and H from 12 M to 16 M could be attributed to adsorption of O and H rich dissolved substances like humic acid. The decreasing H/C and O/C ratio implied the loss of H and O content relative to C content in JPB. This could due to the loss of H and O rich organic molecules such as carbohydrates as carbohydrates are readily dissolved in soil water and mineralized by microorganism [13] . Besides that, declining H/C ratio indicated increased of aromaticity degree [14] .

Table 1. Elemental composition of Batu Lapan soil series.
Table 2. Elemental composition and surface area of JPB over 16 months (n = 3).
*mean ± standard error.
This suggested adsorption of dissolved organic matter with aromatic structures lowering the H/C ratio. The decreasing O and H content of JPB contradicted with the incubation result reported by [2] [3] . Frequent rainfall and high microbial activities at field condition might enhance short-term degradation of biochar compare to laboratory incubation.
The BET surface area increased very slowly from 0 to 4 M but there was a drastic increase from 4 M to 8 M. The highest BET surface area was recorded in JP 8 M (Table 2). This was attributed to physical fragmentation of JPB due to hydrolysis or impact of raindrops [15] and fungal [16] . However, there was a sudden drop in surface area from JP 8 M to JP 12 M and this could be attributed to organic matter and minerals adsorption [17] . Prior physical breakdown and mineralization might had exposed more surface functional groups of JP 8 M and promoted surface adsorption and interactions with soil constituents.
The Fe content in JPB also gradually increased from JP 0 M to JP 12 M and decreased in JP 16 M. Increase of Fe content could be due to ligand bridging or formation of complexes between Fe ion with biochar. The biochar and Fe interactions might have protected JPB from degradation shown by the slow JPB weight lost after initial 4 months in acidic mineral soil (Figure 5). Mineralization of organic matter decreased by addition of free Al3+ [18] and this suggested the plausible mechanism of adsorption of surface minerals in reducing bioavailability of biochar. This calls for further thoroughly research on the effect of minerals on recalcitrance of biochar.
3.2. Surface Chemistry Transformation
The FTIR spectrum of JPB buried under acidic mineral soil for different time period are shown at Figure 1 and interpretated based on [19] . The JP 0 M was hydrophobic and lacked Bronsted acid functional groups like hydroxyl. Presence of sp3 C-H (2854 cm−1) and sp2 C-H (2920 cm−1) peaks hinted the presence of aliphatic structure. Alkyne group (C≡C) was detected at 2226 cm−1. The shifting of alkene (C=C) from 1600 cm−1 to 1569 cm−1 wavelength could be due to conjugation of π electrons [20] by functional groups with high electronegativity like primary amines (1386 cm−1 for C-N coupled with 3233 cm−1 and 3335 cm−1 for N-H2) and alkyl halides (<700 cm−1). Since O-H was absent, C-O group detected at 1097 cm−1 implied of ether group.
No major transformation was detected after 4 months in acidic mineral soil except detection of H bonded O-H group (3394 cm−1) and absence of C-O group. The absence of C-O group indicated loss of O content; complementing the decreasing atomic O/C ratio (Table 2). Besides that, declining intensities of sp2 and sp3 C-H group can be attributed to H loss (Table 2).
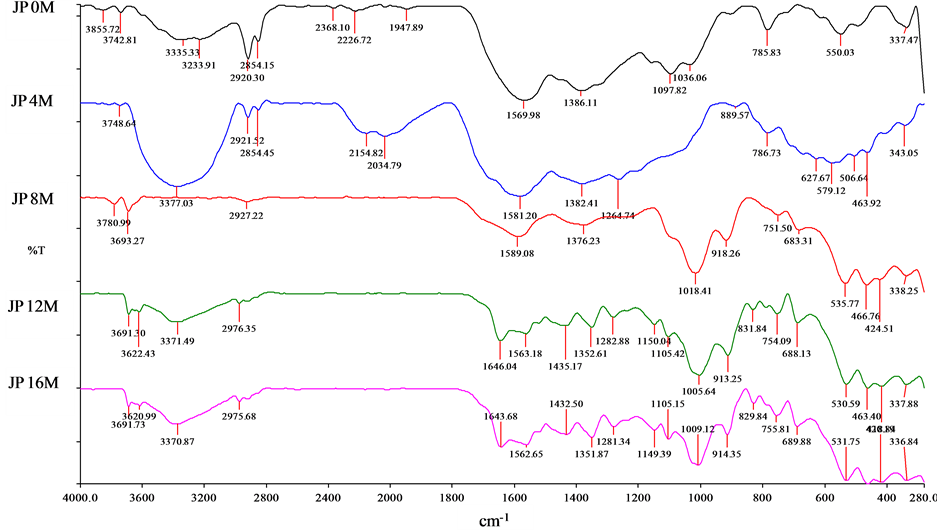
Figure 1. JPB field transformation FTIR spectrum.
After 8 months, the surface functional groups intensities of JP 8 M decreased compared to JP 4 M. The detection of the C-H out of plane at 918 cm−1 and absence of H-bonded O-H also suggested the disorientated structure of JP 8 M.
At 12 months, surface chemistry of JP 12 M underwent a severe alteration due to surface oxidation. Both H bonded O-H and free O-H were detected at 12 months. Besides that, the C=O (1563 cm−1) coupled with free O-H indicated carboxylic acid, showing sign of surface oxidation on JPB. The peak at 1646 cm−1 and 1435 cm−1 suggested aromaticity together with free O-H indicating the presence of phenolic group. This is possibly due to the chemisorptions of foreign dissolved aromatic organic C on the hydrophilic surface of JP 12 M. Thus, JPB became more hydrophilic after 12 months in the field as manifested by the presence of carboxylic, phenolic and hydroxyl groups. The increase in negatively charged surface functional group in biochar was reported previously [3] .
Similar functionalities showed between JP 12 M and JP 16 M are indications that no major alteration occurred after 12 months. This could due to the adsorption of organic matter by the functional group.
3.3. Carbon Structure Alteration
All the 13C NMR chemical shift assignment was based on Lampman et al. [19] . Fresh JPB (JP 0 M) consists of aliphatic and aromatic C structure (Figure 2). The peak at 29.89 ppm matched the aliphatic sp2 CH (R2CH2). The detection of peak at 127.81 ppm confirmed the presence of aryl C or aromaticity.
After 8 months, the C structure experienced massive alterations (Figure 3). The aliphatic sp2 CH (R2CH2) and aromaticity were retained with peaks at 30.54 ppm and 126.11 ppm respectively. Alkyl C and alkene (C=C) were detected at 55.92 ppm and 124.43 ppm respectively. Alkyl C could be attributed to the oxidation process breaking the C structure. The alkene (C=C) could due to reduction of aromatic structure.
The alteration was even more drastic after 16 months for JP 16 M (Figure 4). Peaks at 13.40 ppm and 20.20 ppm were identified as sp3 CH (RCH3) or alkyl C and anhydride (CH3CO-) respectively. The absence of alkene (C=C) on JP 16 M hinted further reduction into alkyl C. Anhydride could be the results of oxidized sp2 CH (R2CH2). The O-alkyl C at 72.67 ppm and 77.94 ppm could be the results of alkyl C oxidation from PS 8 M. Alkyne group was detected at 84.10 ppm. Besides that, aryl C or aromaticity was characterized by 129.40 ppm peak. The peak at 189.09 ppm was significant to carbonyl (C=O). Presence of various C-O structure (anhydride, O-alkyl C and carbonyl) indicated JPB experienced oxidation reaction after 16 months in acidic mineral soil. This process was facilitated with the physical breakdown or fragmentation on the JPB.
3.4. Decomposition Model
In general, JPB decomposition is best-fitted into hyperbolic decay model with 3 parameters (recalcitrant fraction, labile fraction and decay rate) (Figure 5). It passed the normality test with low mean square error (MSE) (Table 3). Although double exponential decay model with 4 parameters exhibited the lowest MSE, it failed the normality test. However, hyperbolic decay model failed the constant variance test. This is due to long period of unchanged dry weight. The decomposition can be divided into 2 different phases; the first phase was a rapid weight loss from JP 0 M to JP 4 M and the second phase was a slow or stagnant weight loss from JP 4 M to JP 16 M. Equation (1) was generated by SigmaPlot version 11.
 (1)
(1)
Wat t = percentage of JPB weight at t (t in months)
Wr = percentage of JPB recalcitrance fraction Wd = percentage of JPB decomposable fraction K = decay constant According to this model, the recalcitrance fraction is 30.71% while the decomposable fraction is at 69.30%. It differs from the double exponential decay model suggested by [8] . This could be attributed to the insensitivity of litterbag study to detect significant short-term dry weight loss. Although this indicated that the decomposition of JPB has stopped but in reality biochar decomposition still continued at a very slow pace. A more extensive study with longer time scale is necessary to estimate biochar stability.

Figure 5. Field decomposition model of JPB.
Table 3. Comparison of 3 different decay models fitted with JPB field decomposition data.
*Unable to compute.
3.5. Transformation of JPB in Acidic Mineral Soil
Short-term decomposition of JPB was a continuum process of abiotic reaction such as redox, fragmentation and adsorption. The decreasing H/C and O/C ratio suggested continuous loss of H and O rich organic C such as carbohydrates. However, significant dry weight loss was only found for the initial 4 months (JP 0 M - JP 4 M). This indicated the labile fractions of JPB such as mineral carbonates on the surface and pores play an important role in the initial rapid dry weight loss.
No significant changes in dry weight were detected after 4 months as JPB decomposition reached the near-inert stage. However, analysis on the spectral and structural properties suggested various physico-chemical reactions on JPB still continued until the 12th month. Phenolic, carboxylic and hydroxyl groups found on the surface of JP 12 M were attributed to surface oxidation. This was complemented by the detection of similar O functionalities in the 13C NMR spectrum. Thus, JPB was transformed from hydrophobic to hydrophilic over the 12 months of incubation.
The irregular pattern of total C content and a sudden drop in BET surface area from JP 8 M to JP 16 M hinted possible adsorption of dissolved organic matter. Iron (Fe) content in JPB increased overtime although dry weight remained and this hinted adsorption of Fe. These interactions between biochar and organic matter or minerals could protect biochar from further degradation. Aged biochar are covered by minerals such as Al and Fe [6] and they are more resilient to degradation [21] .
The significant increase of BET surface area from JP 0 M to JP 8 M could have been due to physical breakdown by rainfall and/or hydrolysis by fungi. The fragmentation of biochar exposed C backbone of JPB to oxidation. Aromatic C (JP 0 M) could have been reduced into alkene (JP 8 M) and further reduction might have converted alkene into alkyl C (JP 16 M).
4. Conclusion
The JPB exhibited hyperbolic decay over 16 months under tropical weather in acidic mineral soil. Biochar field alteration detected was attributed to the chemisorption on JPB as a result of vigorous redox reaction and fragmentation. Short-term litterbag study was unable to determine the true decomposition pattern of biochar in soil. Future field biochar decomposition study should cover longer time scale for better estimation of biochars recalcitrance.
Acknowledgements
This article is based upon work supported by the Fundamental Research Grant Scheme (FRGS) provided Ministry of Higher Education. Additional support was provided by Department of Soil Management, Agricultural Faculty, Universiti Putra Malaysia.
NOTES
*Corresponding author.