Feasible Method to Assess the Performance of a Lung Cancer CT Screening CAD System in Clinical Practice: Dependence on Nodule Size and Density ()
1. Introduction
The National Cancer Institute (USA) has released the results of the National Lung Screening Trial, which has identified that computed tomography (CT) screening can reduce the mortality from lung cancer 20% more than by screening with chest radiography [1] . Meanwhile, research results show that the combination of a radiologist and computer-aided detection (CAD) as a second reader can significantly improve the detection rates of lung nodules, and it has been recommended and proposed to use a CAD system for daily routine work [2] -[5] . Consequently, CAD has become an attractive research interest in medical imaging and diagnostic radiology.
Many studies of performance evaluations of CAD systems have been carried out using clinical image databases [2] -[13] . As the image databases included actual nodules with complicated shapes and heterogeneous density, the CAD performance evaluated with using the database was considered as an overall performance for various size and density of nodules, not for specific size/density. Clinically, the size and density of nodules are primary factors in determining the risk for malignancy [14] ; therefore, not only the previous evaluation of the overall CAD performance but also the evaluation for specific size/density will be necessary. However, because actual nodules are complicated, typically having varied morphologies and heterogeneous densities, the image databases do not lend themselves for classification of nodules by their size and density. For this task, artificial nodules with known size and density included in a lung phantom might be useful [15] , however, more clinical evaluations using lung images obtained from CT screening are essential.
To overcome this problem, a previously proposed unique method of using computer-simulated virtual nodules might be applicable [16] -[18] . The virtual nodules were calculated exactly based on the characteristics of the spatial resolution in a CT system, from object functions that were numerically generated by assuming solitary nodules having spherical shape and uniform density. By inserting the virtual nodules into the clinical lung images and applying them to a computer-aided volumetry analysis, the accuracy of the volumetry was investigated [17] . By using those lung images including virtual nodules, it will be possible to evaluate the CAD performance for specific size/density of nodules; for obtaining such the specific performance, the settings of object functions as uniform spheres are appropriate because of the known size and density. The validity of virtual nodules had been verified by use of artificial spherical objects with uniform density included in a phantom. Actual nodules in the image database would not be suitable for those validation studies, because of the difficulty of the classification by size and density as described above. Therefore, when limited to the study of evaluating the CAD performance for specific size/density, previous validation studies using artificial nodules in a phantom would be satisfactory enough for verifying the reliability of virtual nodules.
Virtual nodules have not been applied for the clinical evaluation of the CAD performance, such as the evaluation with the sensitivity and specificity of nodule detections. The purpose of this study was to apply the virtual nodules to demonstrate the dependence of the CAD performance on nodule size and density with the free-response receiver operating characteristic (FROC) analysis. We used clinical images of ten subjects obtained from a lung cancer screening. The virtual nodules were obtained by various settings of size and density in object functions, inserted into images and applied to the CAD analysis. CAD performance was evaluated for each size and density of nodules, and the size/density dependence was assessed. In discussion section, we clarified the advantages of virtual nodules, compared with other possible methods of evaluating the CAD performance.
2. Materials and Methods
2.1. Theory
Blurring of the CT image can be described by the PSF of a system [19] [20] . The PSF is assumed separable into a two-dimensional (2D) PSF in the x-y scan plane and the SSP in the z-direction perpendicular to the scan plane
[16] [21] -[23] . Then, the three dimensional (3D) CT image I (x, y, z) can be expressed as [16] [20] [22] .
 (1)
(1)
where O(x, y, z) is the object function, PSF(x, y) and SSP(z) are the 2D PSF and slice sensitivity profile, respectively; and ** and * are 2D and 1D convolutions, respectively. Noise and artifact components are neglected in this representation.
2.2. PSF-Based Virtual Nodules
PSF-based virtual nodules are obtained as follows. First, the 2D PSF and SSP were measured in a CT scanner at the screening clinic and were used for calculations as in Equation (1). Then, object functions O(x,y,z) are generated numerically with any shape and density as desired. Substituting the measured 2D PSF and SSP in Equation (1), CT images I(x,y,z) were computed from the object functions, thus generated computer-simulated nodule images were based on the spatial resolution characteristics of the CT scanner at the screening clinic. This procedure can be used to generate different characteristic simulated-nodule images by applying various shapes, dimensions and densities to the object function. These simulated images can be fused on practical images following a desired fusion process. For accuracy, computer simulated images were generated with fine intervals and thus, intervals of simulated images were not similar to that of the practical images. Therefore, before the fusion process resampling should be done to match the discrete-data intervals with those of the practical images. Then, the simulated blurred images were transformed into practical images that can be used in clinical evaluations [17] . Fusing the resampled 3D simulated images on practical screening images, PSF-based virtual nodules can be obtained.
2.3. CAD Performance Assessment
An image database from a lung cancer CT screening clinic belonging to the General Hospital at Nagano, Japan, was used for the study. Institutional board approval was obtained from the same hospital to get ethical clearance for accessing the screening database. In this clinic, applicants have been subjected to lung screening examinations with a multidetector-row CT scanner without contrast enhancement (Asteion, Toshiba Medical Systems, Tokyo, Japan). The imaging parameters were as follows: reconstruction kernel FC50, 120 kV, 30 mA tube current, 8.0 mm slice thickness, 4 detector rows, 0.75 s rotation time and a pitch factor of 1.375.
Setting the reconstruction kernel as FC50, 2D PSF measurement of the scanner was performed using a method that determined the 2D PSF in the scan plane by one scan of a commercial phantom, accompanied by verification [24] [25] . Setting the slice thickness to 8.0 mm, SSP measurement was performed using a commercial phantom (Gold Disk Delta phantom Kyoto Kagaku Co., Ltd., Kyoto, Japan) consisting of a 50-μm-thick gold disk of 1 mm in diameter placed in acrylic.
In this study, object functions O(x,y,z) were generated numerically as ideal spheres with uniform density assuming solitary spherical pulmonary nodules (Figure 1). Densities of the object functions were assigned using the term ∆CT, where ∆CT was defined as the density difference between background and the object function. Substituting the measured 2D PSF and SSP in Equation (1), CT images I(x,y,z) were computed from the object functions O(x,y,z) to which the different sizes and densities were assigned. Then, resampling was performed.
CT images of 10 subjects were randomly selected from the database, and the images of five of them were fused with computer generated simulated nodule images. For this study, we used a simple addition method as the fusion technique. According to nodule size, fused virtual nodules may be included in a number of adjacent slices. To cover the whole lung field, three locations were selected from the upper, middle and lower field areas (Figure 2). Each selected location was fused on 10 nodule images so that there were five virtual nodules in each of the left and right lungs. Thus, altogether 30 virtual nodules per subject were applied in the study. The position of each simulated nodule image was decided avoiding large pulmonary vessels.
Computing was performed using MATLAB software (Mathworks Inc., Natick, MA). In this study prototype lung cancer CT screening CAD system developed by our research team was used [8] [26] .
2.4. Nodule Size Dependency
The aim of the first part of the study was to assess CAD performance dependence on virtual nodule size. Therefore, computer simulated nodule images were generated applying different sizes of 4, 5, 6, 7 and 8 mm while the
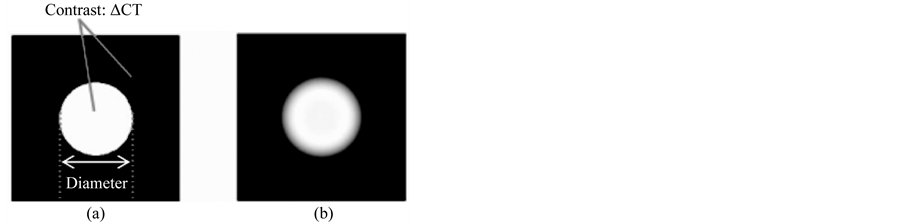
Figure 1. Schematic for image simulation. (a) The object function by assuming an ideal sphere with diameter and contrast (ΔCT) between nodule and background densities. (b) Computed nodule image obtained from the object function by Equation (1).
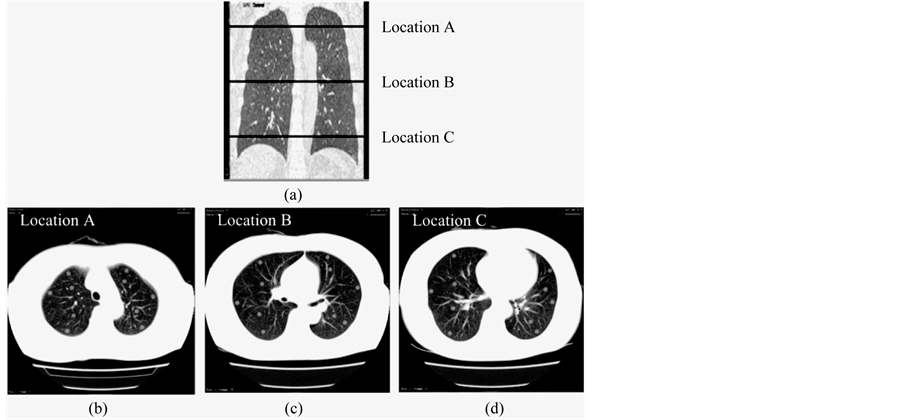
Figure 2. Virtual nodule images fused on three locations of the lung field. (a) Selected locations are shown in a coronal image of the lung field. (b) Location in the upper lung field. (c) Location in the middle lung field. (d) Location in the lower lung field.
∆CT value of the object function was kept unchanged at 300 HU. Subsequently, images were resampled, and were fused on above said five subjects screening images as described earlier so that there were 30 virtual nodules per each subject with one size at a time. Five separate sets of images for the different nodule sizes were prepared. Each set of prepared screening images together with the rest of the five subjects’ images (without virtual nodules) were separately analyzed by the CAD system.
Prototype CAD system used in this study has provided the option of changing its sensitivity. Thus, nodule detection sensitivity of the system was changed, and the number of combinations of true positive fraction (TPF) and false positives per subject (FPS) were taken for different sensitivity levels [12] [13] . These values were used to obtain FROC curves. The jackknife FROC (JAFROC) method was used to estimate the statistical significance of the difference between the curves obtained for different nodule sizes separately [27] .
2.5. Nodule Density Dependency
The second part of the study was focused on CAD performance dependence on virtual nodule density. Thus, the simulated images were generated applying ∆CT value of 200, 300 and 400 HU to the object function. Size was kept unchanged at 6 mm. Resampling and fusion were performed as described earlier and three separate sets of images were prepared for each ∆CT value. Finally, the same procedure was followed for CAD detections, obtaining FROC curves and statistical analysis as in the previous section.
3. Results
Performance dependence of a lung cancer CT screening CAD system has been assessed based on two nodule characteristics of size and density. Figure 3 and Figure 4 show corresponding sample CAD detections for different virtual nodule sizes and densities, respectively. CAD performance dependence on nodule size has shown in Figure 3 where all five virtual nodules having diameter of 8 mm have been detected but only four with diameter of 5 mm; thus one FN appears in Figure 3(a). Therefore, Figure 3 indicates that the CAD system detected larger virtual nodules than small ones. Nodule density also affected on nodule detection by the CAD system (Figure 4). All five high density (∆CT = 400 HU) nodules have been detected while only three from low density (∆CT = 200 HU) nodules. Therefore, there are two false negative (FN)s in Figure 4(a). Furthermore, the figure shows that a larger number of higher-density virtual nodules have been detected than low-density ones. Overall results imply
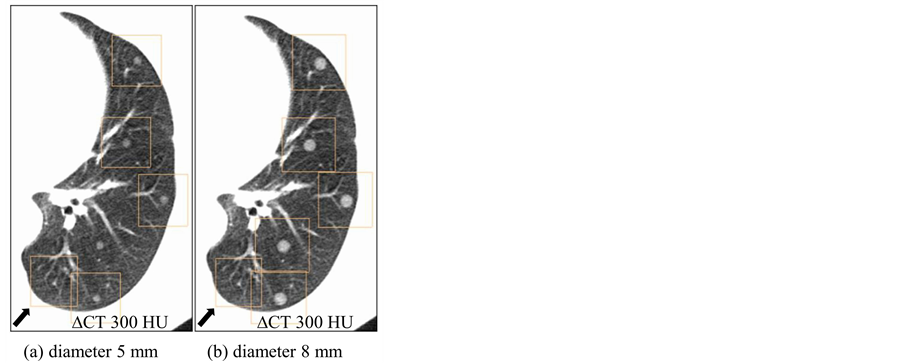
Figure 3. CAD detections of virtual nodules having different sizes and same density (∆CT = 300 HU) on a selected location. Arrow shows false positives on the bottom left of both images. (a) Only four virtual nodules with diameter of 5 mm were detected. (b) When the diameter is 8 mm, all five nodules were detected by CAD on the same location.
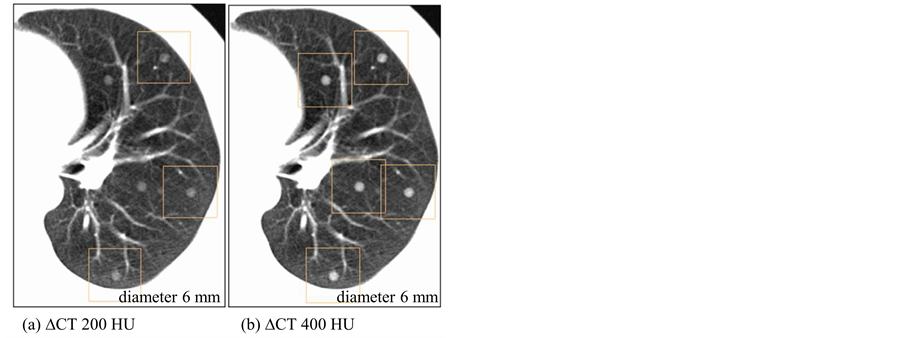
Figure 4. CAD detections of virtual nodules having different densities and same size (diameter 6 mm) on a selected location. (a) Only three virtual nodules with density (∆CT) 200 HU were detected. (b) When the density (∆CT) is 400 HU, all five nodules were detected by CAD on the same location.
that tendency of virtual nodule detection by the CAD system can be seen towards high-density, larger-sized nodules. Detailed results of CAD detection dependence on size and density of a virtual nodule are shown below.
3.1. Nodule Size Dependency
Figure 5 shows FROC curves for CAD detections of different virtual nodule sizes. TPF of CAD detections of smaller-sized virtual nodules are lower than that of larger ones. The TPF for 4 mm virtual nodules is clearly the lowest value while other nodules are considerably high. TPFs increased with the increase of virtual nodule size. However, the gap between curves of consecutive virtual nodule sizes decreases when increasing their size. Results by the JAFROC method (Table 1) show that there are statistically significant differences between FROC curves of all pairs of different virtual nodule sizes (p < 0.05) except between 7 and 8 mm curves (p = 0.131). According to these results, this CAD system was able to detect larger virtual nodules easily.
3.2. Nodule Density Dependency
FROC curves of each density for ∆CT values of 200, 300 and 400 HU were plotted (Figure 6). The curves show that the lowest density (∆CT = 200 HU) virtual nodules have the lowest TPF. The efficiency of CAD detection is shown to have increased with nodule density. Maximum TPFs of the 300 and 400 HU curves are more than 0.9 while the 200 HU curve has a value less than 0.9. However, the gap between FROC curves for a selected
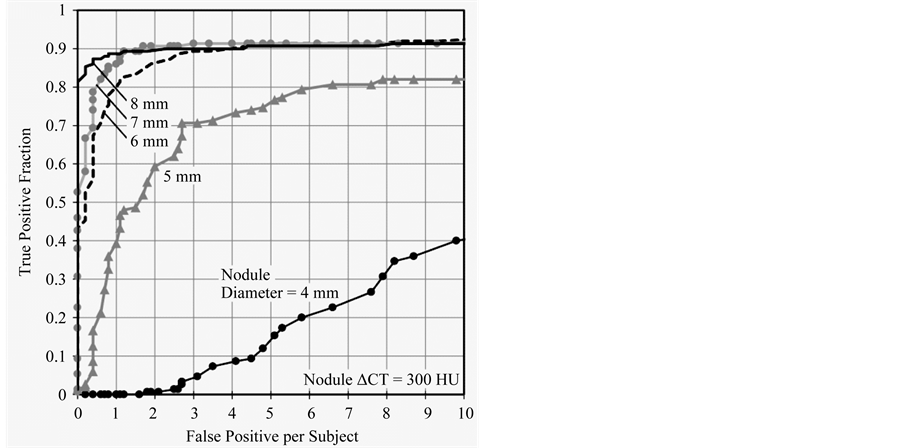
Figure 5. FROCs for different nodule sizes from 4 - 8 mm are shown. TPF of CAD detections increased with nodule size. However, when nodule size increased the gap between consecutive curves decreased.

Table 1. p-values for each pair of different nodule sizes (diameters).
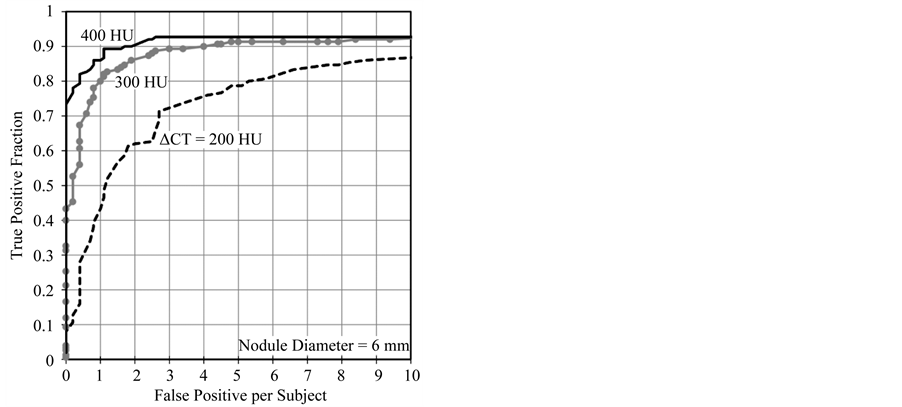
Figure 6. FROCs for ∆CT values of 200, 300 and 400 HU. CAD showed better performance on 400 HU nodules. TPF increased with virtual nodule density. The gap between the 200 and 300 HU curves is higher than that of 300 and 400 HU. Curves have become horizontal when the FP per subject value is about eight.
value of FPS decreased with density. CAD performance dependency on nodule density among the three densities was statistically analyzed by using the jackknife method (Table 2). Results show that a statistically significant difference can be seen between each nodule density (p < 0.01). Results also show that more dense virtual nodules were conveniently detected by the tested CAD system.
4. Discussion
CAD system performance dependence on nodule size and density was demonstrated by the use of virtual nodules. In this approach, virtual nodules were divided into various groups by their size and density; those values of size and density (ΔCT) were true values in the object functions (Figure 1). In order to get clear definition for the size and density, spherical object function with a selected density at a time applied for this preliminary study. However, any irregular shape and density distribution can be applied to the simulation process. The ranges in size and ΔCT were from 4 to 8 mm in 1-mm increments and from 200 to 400 HU in 100-HU increments, respectively. Each group consisted of a sufficiently large number of virtual nodules (150 nodules in 5 subjects). If we use actual nodules in CT images obtained from patients for the same study, such exact and detailed classification of nodules would not be possible because true values of size and density of actual nodules were not known in images. Even if we use values of size and density measured from the images [10] , those values include some error. Furthermore, numerous nodules in a large-scale image database were necessary to perform a detailed classification (increments of 1-mm in diameter and 100-HU density) with a large enough number of nodules per group. Newly archiving such a large-scale image database is laborious. In addition, as actual nodules have heterogeneous density with various complicated shapes, acquiring a clear definition of size and density would be difficult. Because of these practical reasons, we believe that it is not possible to obtain results as shown in Figure 5 and Figure 6 by using actual nodules. Virtual nodules can overcome this limitation, and therefore are effective for the evaluation of CAD performance dependence on nodule size and density. Furthermore, CAD performance evaluation should be performed by using images with the same scan/reconstruction parameters as screenings are done in the clinic where the CAD system is used. Because, CAD performance varies with image quality and therefore it depends on scan/reconstruction parameters [28] -[33] . However, large archived databases, which consist of images from number of screening centers, contain images of limited scan/ reconstruction parameters. Further, such images have different spatial resolution conditions. Because, the PSF and SSP are dependent on the scanner itself and selected scan/reconstruction parameters [34] . Therefore,
Table 2. p-values for each pair of different nodule densities (∆CTs).
PSF-based method which used images of the same scanner [17] [24] is more appropriate to assess the performance dependence on size and density of a lung cancer CT screening CAD system.
Sizes and densities of virtual nodules were selected based on the literature [35] . Clinically, the size and density of lung nodules are primary factors in determining the risk of malignancy. Lung cancer CT screening guidelines indicate that follow up actions are recommended for the subjects having nodules with diameters above 5 mm [14] ; this supports the high clinical importance of Figure 5, which illustrates CAD performance dependency in 1-mm increments of nodule diameter starting from 4 mm. According to Figure 5 tested CAD system has shown better performance on 6 mm or higher nodules (TPF = 0.9 when FPS = 3) and detection of 5 mm was less than that (TPF = 0.7 when FPS = 3). Results shown in Figure 5 has illustrated a quantitative assessment of performance dependence on nodule size. Similarly, Figure 6 shows the quantitative results based on density dependence. According to Figure 5 and Figure 6, tested CAD system has detected nodules with size 6 mm and density (ΔCT) 300 HU and above with higher accuracy. Therefore, obtaining the quantitative performance results of the tested CAD system with the applied scan/reconstruction conditions is possible with our method. These results are useful to the radiologist. As reported in other CAD performances studies, our study also emphasized that CAD performance increased with nodule size and density. Statistical analysis by the JAFROC method also showed the same trend (Table 1 and Table 2).
One important characteristic of this method is generating virtual nodules with quite similar spatial resolution to the images from a selected CT scanner. Therefore, this method can be used to evaluate the CAD system dependence on scan/reconstruction parameters of the images of a selected CT scanner. Moreover, with the aging of a scanner, image quality may change, and thus there is a possibility of changing the CAD performance on the images of a scanner. Therefore, this method may be the better selection to evaluate performance dependence on scan/reconstruction parameters at any stage. Furthermore, unlike phantom studies, any number of virtual nodules with different known densities and sizes can be added at any location of CT slices [18] . In addition, human images are used, and therefore similar to actual clinical practice with the same noise and artifact conditions. Furthermore, lung cancer CT screening CAD systems have been introduced to clinics and their use is widely spreading and becoming popular. However, up to now there is no accredited or standard methodology available to assess the CAD performance dependence on scan/reconstruction parameters. Therefore, the application of PSF-based virtual nodule method might be a possible solution.
Our study had some limitations. Only three levels of the lung were selected to place the nodules. However, larger number of nodules per subject (30 in a subject) was applied to cover the peripheral and inner area of the selected locations. In addition, this preliminary study considered only solitary nodules; therefore, nodule were placed avoiding the large blood vessels. This does not exactly represent the distribution of lung cancer or metastases. Nevertheless, placing the nodule attached to the vessel or lung wall also can be done. Furthermore, when the virtual nodules are used with the different shapes and density distributions, CAD performance dependence is assessed and then the validation with real nodules is needed. However, purpose of this study is to get the CAD performance dependence on nodule size and density. Therefore, validations of virtual nodules with phantom nodules [17] [18] are sufficient. Further studies are needed applying nodules having irregular shapes and heterogeneous density distribution for overall performance assessment of lung cancer CT screening CAD system.
5. Conclusion
This study suggests that PSF-based virtual nodules could be effectively used to quantitatively assess the lung cancer CT screening CAD system performance dependence on nodule size and density.
Acknowledgements
This work was supported by Japan Society for the Promotion of Science KAKENHI Grant Numbers 23602005 and 25461803. This research was also supported by a joint study undertaken between Niigata University and Fujitsu Limited.
NOTES
*Corresponding author.