Poly(Acrylamide-Co-Acrylic Acid)-Zinc Acetate Polymer Electrolytes: Studies Based on Structural and Morphology and Electrical Spectroscopy ()
1. Introduction
The first solvent-free polymer electrolyte complex with ionic salts was reported by Wright [1] . Unfortunately, this solid polymer electrolyte (SPE) is known to result in insufficient performance at ambient temperature, which acts as a barrier to its utility compared to the existing conventional liquid/hybrid electrolytes [2] . Therefore, many research works have been conducted in order to overcome this disadvantage, to enhance its mechanical properties and ambient temperature conductivity through blending various polymers [1] , crosslinking [3] , insertion of ceramic fillers [4] , plasticization [5] , and doping with ionic salts [6] . This information indicates that the utilization of doping salts which form low-temperature eutectics with polymers is a useful approach for obtaining a good flexibility of the polymer chains which are responsible for the ion transport.
Polyacrylamide-co-acrylic acid (PAA) is a polymer consisting of both polyacrylamide and polyacrylic acid as copolymers. Polyacrylamide, a water-soluble polymer, has been investigated by many researchers because of its advantages as binder and filler for conductivity improvement, and moreover its excellent electrical-thermal properties make it suitable for device applications [7] . Polyacrylic acid is a water-soluble polymer which consists of acrylic acid monomer, and it is frequently used as a co-polymer to boost the ionic conductivity in the electrolyte system [8] [9] .
Zinc acetate (ZnA) is the chemical compound with the formula Zn(O2CCH3)2, which commonly occurs as a dihydrate Zn(O2CCH3)2(H2O)2. It is useful as a reagent in the organic synthesis of metal oxide nano-structures [10] [11] . Previous studies have shown that hybrids of polymer-based ZnA possess high ionic conductivity (10−5 to 10−6 Scm−1), making the ZnA hybrid membrane attractive for further investigation [12] [13] .
In this paper we attempt to investigate the morphology and structural and electrical properties of a new type of doped-SPE film (PAA complexed with ZnA). The modification of the structure was investigated through Xray diffraction (XRD) and Fourier transforms infrared (FTIR) spectroscopy. To examine the evolution of the morphology on the surface of doped-SPE, the scanning electron microscopy (SEM) technique was used in high and low magnification configurations. Its electrical properties were determined by electrochemical impedance spectroscopy.
2. Materials and Experimental Methods
2.1. Sample Preparation
Membranes were prepared using a single solvent by the solution casting technique. The details of the compositions of the PAA (Aldrich, molecular weight ~5 × 10⁶) doped with ZnA (Sigma-Aldrich, 99.99%) are listed in Table 1. Briefly, the solutions were obtained by diluting 1g of PAA powder in 100 ml of distilled water. Subsequently, different amounts of ZnA [varied from 0 to 50 (as a weight percentage, wt %)] were added to the solutions. The mixtures were stirred continuously with the magnetic stirrer until homogenous solutions were obtained. Next, the solutions were poured into different plastic petri dishes and were left to form thin films by the evaporation process. The films were then kept in desiccators (with silica gel) for a certain time to reduce their water content. All the experimental steps were carried out at room temperature.
2.2. Characterization
The amorphous or crystal phase of the sample was determined by the XRD technique. A MiniFlex II diffractometer equipped with an X’celerator using CuKα radiation was used to record the XRD pattern in the range of 2θ = 5˚ to 80˚.
The composition and complex formation in the sample were analyzed by a Thermo Nicolet Avatar 380 FT-IR spectrometer. It simultaneously collects spectral data in a wide spectral range from 4000 to 675 cm−1 with a spectral resolution of 4 cm−1. The spectrometer is equipped with an attenuated total reflection (ATR) accessory with a germanium crystal. The sample was put on the germanium crystal, infrared light was passed through the sample, and the graph was sketched.
The surface morphology of the prepared sample was investigated by SEM using a model JEOL JSM-6360LA device. Using this technique, the crystalline or amorphous nature of the sample can be directly observed.
Impedance spectroscopy was measured using a HIOKI 3532-02 LCR Hi-Tester which was interfaced to a computer. It was used to determine the electrolytes’ conductivity over a wide range of frequencies from 50 Hz to 1 MHz. The prepared samples were cut to 2 cm diameter size and placed between two stainless steel electrodes

Table 1. The compositions of PAA and ZnA powders.
on a sample holder which was connected by leads to a computer. The imaginary impedance (Zi) versus the real impedance (Zr) was plotted using the same scale for both vertical and horizontal axes in order to obtain the bulk resistance, Rb. A micrometer-screw gauge was used to measure the sample thickness, which was employed to calculate the conductivity of the sample using equation s = t/RbA, where t = the thickness of the thin film (cm), A = the area of the contact, and Rb = the bulk resistance.
3. Results and Discussion
The results of XRD analysis at room temperature recorded from 2θ = 10˚ to 80˚ for pure PAA, ZnA, and PAA-ZnA complex systems are shown in Figure 1(a). A broad peak from 15˚ to 30˚ was observed in the spectrum for the pure PAA film. Obviously, the film is amorphous phase and is relatively similar to that obtained by Kangwansupamonkon et al. [14] . In contrast, a number of sharp peaks located at 12.8˚, 16.9˚, 19.4˚, 20.4˚, 22.8˚, 23.9˚, 25.8˚, 28.1˚, 28.9˚, 33.8˚, 37.9˚ and 42.9˚ were clearly visible in the ZnA pattern, indicating that it is enriched with crystalline moieties [15] . No peaks can be observed in the complexed samples except in sample F, where the peaks appearing at 12.8˚, 19.9˚ and 33.9˚ reveal the presence of a mixed phase of ZnA. These peaks are typical of zinc acetate [15] . From these results, it can be concluded that the complexed films tend to have certain similarities and subsist in the amorphous rather than the crystalline phase. Additionally, the presence of ZnA does not have much influence on the formation of peaks in the complexed samples.
The FTIR spectra for ZnA, pure PAA, and polymer-ionic dopant complexes are shown in Figure 1(b). The peak intensity decreases as the amount of ZnA used in the PAA increases. The bands at 1442 and 1553 cm−1 have been assigned to symmetric and asymmetric stretches of the carboxylate ion in ZnA [15] . The peaks at 3342 and 1656 cm−1 for the pure PAA represent the N-H groups of polyacrylamide and the carbonyl group, respectively. There are two bonds at 1361 and 1619 cm−1 related to the COO-group in polyacrylate and the peaks at 1449 and 2949 cm−1 are due to C-N and C-H bonding, respectively [16] . As can be seen, there are insignificant changes for all of the prepared samples. The structure of the polymer changed only a little after ZnA was added and dominates a certain position of the PAA. This phenomenon is clearly observed in the sample containing 50 wt % ZnA, where the peak at 1650 cm−1 has disappeared. It can be noted here that all of the spectra of the prepared samples have absorption characteristic of O-H stretching located at 3350 to 3390 cm−1.
All of the prepared samples were transparent films with no separation. Figure 2 shows the scanning electron micrographs of pure PAA and PAA-ZnA complexed films. All the samples were in solid form during their analysis at different magnifications (×300, ×5000, ×6500) and regions were as shown in Figure 2(a) to Figure 2(h). As can be seen in Figure 2(a), the surface morphology of pure PAA film appeared to be uneven and rough, and some cubic shapes of different sizes are visible in a certain area. Figure 2(b) illustrates the SEM image for the highest conductivity sample containing 10 wt % ZnA (sample B). The morphology tends to have some


Figure 1. (a) XRD patterns for different samples of PAA and ZnA; (b) FTIR analysis of different weight percentages of ZnA in PAA.
mixed small and large wrinkles attached together with a few cubic shapes. The surface contour of the sample with 20 wt % ZnA (sample D) changed so that it had more twitches, as depicted in Figure 2(c). These twitches were of large size and presented in one direction orientation. Figure 2(d) demonstrates the SEM image of the prepared sample containing 25 wt % ZnA (sample E). When more than 20 wt % ZnA was present, the morphology contour changed from a large sized twitch or rough surface area to small sized wrinkles with a smooth topology region. Additionally, these small wrinkles were observed to have a multiple direction orientation and in some areas they gathered to present the cubic pattern. The SEM micrographs depicted in Figures 2(e) and Figure 2(f) are images of the sample containing 30 wt % ZnA (sample F) at different magnifications. At low magnification (Figure 2(e)), the morphology of the sample exhibits a very interesting contour with many randomly oriented patterns covering the region. Once the image is enlarged to high magnification (Figure 2(f), taken at a specific area of Figure 2(e)), the surface contour of the sample appears to have the root morphology with a coarse surface region. The dimensions of the root are estimated to be less than 5 mm in width and more than 30 mm in length. Figure 2(g) shows the SEM image of the sample containing 40 wt % ZnA (sample H). The surface contour emerged with a combination of smooth morphology in part of the region and, in another part, grainy or small bubble shapes of numerous sizes which are not uniformly distributed in the whole area. The small bubble patterns in Figure 2(g) are enlarged to bigger bubbles after adding 50 wt % ZnA (sample J) in the PAA as shown in Figure 2(f). These bubbles have average dimensions of 2.5 mm (width) and 2.5 mm (length) respectively.

Figure 2. SEM micrographs of sample: (a) pure; (b) B; (c) D; (d) E; (e) and (f) F; (g) H; (h) J.
The values of bulk resistance, Rb, and the conductivity, σ, of the samples are depicted in Table 2. The bulk resistance of pure PAA in the film form is about 7.0 × 10⁶ Ω with an ionic conductivity of approximately 2.73 ×10⁻⁸ Scm−1. By adding 5 wt % ZnA (sample A) to the polymer, the bulk resistance decreases to 7.94 × 10⁴ Ω and the ionic conductivity increases to 1.6 × 10⁻⁶ Scm−1. The bulk resistance keeps decreasing (7.00 × 10³ Ω) and gives the highest ionic conductivity (1.82 × 10⁻⁵ Scm−1) for the sample B. Additional ZnA in the films experimentally increases the bulk resistance and as a result decreases the ionic conductivity. Figure 3(a) shows the graph of conductivity variation as a function of salt content at room temperature. The increasing trend of ionic conductivity is probably due to an increase in the number of mobile charge carriers as the ZnA concentration increases in the samples. The bulk resistance values start to decrease after further addition of 15 to 50 wt % ZnA and reach the lowest conductivity value of 1.68 × 10⁻⁸ Scm−1 in the sample containing 50 wt % ZnA (sample J). The decreasing pattern here is probably opposite to the increasing trend of the ionic conductivity. There are four main effects of high salt concentrations which led to low ionic conductivity, as follows. They: (i) favor the formation of the salt complex, leaving a film depleted in free polymer; (ii) hinder complete salt dissociation; (iii) facilitate the formation of ionic multiplets, such as triplets (X–M+ X–, M+ X– M+) and quartets (M+ X– M+ X–), which are less mobile than free ions, which decreases their effective concentration; (iv) diminish the number of vacancies available for ionic transport. All of these effects contribute together to the low conductivities observed at higher salt concentration [17] . Figure 3(b) illustrates the temperature dependence of the conductive ity of the sample B. The straight line of the graph has a value of R2 which is equal to 0.97 and suggested to be an
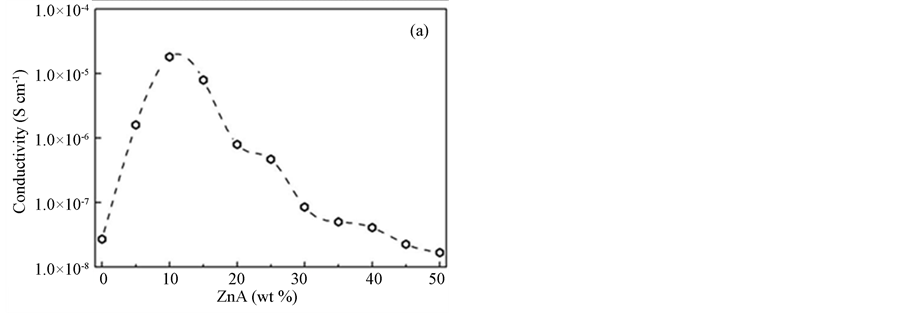

Figure 3. (a) The conductivity variation as a function of salt content at room temperature; (b) the temperature dependence of the conductivity of sample B.
Table 2. Room temperature ionic conductivity of PAA-ZnA.
Arrhenius behavior given by s = so exp (−Ea/kT), where so is pre-exponential factor, Ea is the activation energy and k is the Boltzmann constant. The value of Ea for this sample is 0.12 eV.
Studies of the dielectric behavior of polymer electrolytes help to understand the nature of conductivity. The analysis of complex permittivity gives information on relaxing dipoles in the samples [18] . The equations for the dielectric constant, εr, the dielectric loss, εi, the real electrical modulus, Mr, the imaginary electrical modulus, Mi and the tangent loss, tan d are given by εr = Zi/( ωCo(Zi2 + Zr2)), εi = Zr/(ωCo(Zi2 + Zr2)), Mr = εr/(εr2 + εi2), Mi = εi/(εr2 + εi2), and tan d = εi/εr. Here, Co = εoA/t (εo is the permittivity of free space, A is the electrode–electrode contact area, and t is the thickness of the electrolyte), ω= 2πf (f being the frequency) is the angular frequency of measurement. The real and imaginary parts of complex relative permittivity represent the complimentary processes of energy storage and dissipation respectively [19] .
Figure 4(a) and Figure 4(b) show the dielectric constant and the dielectric loss for sample B, respectively. Long tails can be observed at the higher frequency. The decreases with frequency are due to electrical relaxation or the inability of the dipole to follow the applied field in order to rotate rapidly. In a low frequency region, ion aggregation at the interface leads to a net polarization, which allows the formation of a space charge region at the electrode-electrode interface. Non-Debye dependence can be confirmed from the graph obtained, as both the dielectric constant and loss increase sharply at low frequencies, indicating that electrode polarization and space charge effects occurred [20] .

Figure 4. (a) The dielectric constant (εr); (b) the dielectric loss (εi) versus frequency; (c) frequency dependence of the real part of the electric modulus; (d) frequency dependence of the imaginary part of the electric modulus, and (e) the tangent loss (tan δ) with frequency for sample B.
The variations of the frequency dependence of the real and imaginary parts of an electric modulus for sample B are shown in Figure 4(c) and Figure 4(d), respectively. Unlike in dielectric studies, both Mr and Mi increase sharply at higher frequency. The presence of long tails at low frequency can be attributed to the large capacitance associated with the electrodes, which indicates that relaxation times for the protons are longer at lower temperature than at higher temperature [21] .
Figure 4(e) demonstrates the loss tangent (tan δ) spectra versus the frequency of dissipative loss as a function of frequency for the sample B. The peaks appearing at temperatures of 343, 353, 363, and 373K correspond to the electrode polarization relaxation frequency, fp [22] . The peak frequency is inversely proportional to the relaxation time of the ions for the particular sample. In other words, the longer the relaxation time, the lower the conductivity. Since the relaxation time is given by τ = 1/(2πf), where f is the frequency of the relaxation peak, the relaxation time of the treated sample at the highest temperature is the shortest. As observed in Figure 4(e), all samples have the highest value at high frequency although there are peaks at moderate frequencies. The dielectric loss at low and moderate frequencies characterized by high values of tan d is due to the contribution of both ion jump and conduction or ion migration loss in addition to the polarization loss [23] .
When related to the morphology studies, it can be understood that the highest ionic conductivity occurred in the sample containing 10 wt % ZnA (sample B) with the smoothest surface morphology (the smallest wrinkles) among the complexed samples and this ionic conductivity decreased after further addition of up to 50 wt % ZnA (sample J) to the polymer, where the surface morphology was also observed to return to the original contour.
4. Conclusion
Ion-conducting polymer electrolytes based on PAA-ZnA have been successfully prepared via a solution-casting technique. The XRD patterns revealed that they had a certain similarity, and the samples existed in amorphous rather than crystalline phase. Meanwhile, FTIR analysis indicated that the peak intensities of the complexed samples decreased as the amount of ZnA increased. According to the morphology study, the highest conductivity sample (10 wt % ZnA, 1.82 × 10⁻⁵ Scm−1) tended to have some mixed small and large wrinkles attached together with a few cubic shapes. This shape changed to an irregular surface after the addition of more than 10 wt % ZnA and tended to decrease the ionic conductivity thereafter.
Acknowledgements
Financial support provided by the Ministry of Education (MOE) through an Exploratory Research Grant Support (ERGS-55072) is gratefully.