Curvature, Hybridization and Contamination of Carbon Nanostructures Analysis Using Electron Microscopy and XANES Spectroscopy ()
As a consequence of this specific dimensional particularity, every nanostructure synthesized has to be characterizing for fully mastering its proprieties and by the way, handle its applications [18-22]. Another specificity of nanostructures is their complex and heavy synthesis processes compared to other materials used in different domains of technology and their different methods of synthesizing [23-25]. These methods lead to CNSs with sometimes an important quantity of impurities (Fe or Co) incorporated, encapsulated or adsorbed [26-29] whose amount and types depend on techniques and parameters of synthesis.
2. Experimental Details
2.1. Substrate Preparation
The substrate consisted of a SiO2 layer (thickness 5 nm, DECR plasma process) on a Si(100) sample. SiO2 was evaporated on Si(100) both as a non-wetting substrate for subsequent metallic diffusion and aggregation, and as a protective barrier layer to prevent metal diffusion and silicide formation, but its thickness must be thin enough to allow electron conduction through tunneling for field emission measurements. This substrate (SiO2/Si(100)) was then transferred into a stainless steel ultra high vacuum (UHV) preparation chamber. The transition metal (TM) consisting on Co or Fe or a mixture of them evaporation was performed without air removal. It was evaporated with an OMICRON EFM3 effusive source at a pressure within 7 - 10 × 10−10 mbar on the substrate heated at 925 K ± 20 K during 30 min. The flux rate of TM at 973 K is estimated to 0.05 nm of equivalent layer per minute from an in situ XPS analysis of the Co2p/Si2p signal. In other cases the transition metal is deposited by sputtering.
2.2. CNSs Growth by the dc HF CCVD Process
The CNSs growth method by catalytic chemical vapour deposition (CCVD) process has been fully described elsewhere [25,26]. After the substrate transfer to the UHV CVD vacuum chamber, the gas mixture (100 sccm C2H2/H2/NH3 with a relative volume content of 20: 79: 1), was thermally activated by hot filaments (Pf = 150 W) and kinetic energy-activated by polarization between an anode and a cathode (Vp = 300 ± 10 V). A first discharge of the filaments ensures a high concentration of ionic species and activated radicals. An additional extraction voltage on the sample (Ve = 10 V) created an extraction discharge. The temperature (973 K) was controlled and regulated by an independent infrared heater. The sequences of deposition were the following:
− At first, the precursors was heated under vacuum (10 K/min for 10 min);
− The temperature was increased up to 973 K (10 K/min) in an H2 atmosphere at 15 mbar;
− Acetylene (or other precursors) and ammonia were introduced;
− The extraction current Ie was kept constant.
To stop the CNSs growth, the acetylene feedthrough, the polarization, the filaments and the hydrogen feedthrough were switched off successively. This variant of CVD is called direct current hot filament catalytic chemical vapour deposition (dc HF CCVD).
2.3. XANES Spectroscopy Experiments
The XANES measurements took place at Laboratoire pour l’Utilisation du Rayonnement Electromagnétique (LURE, ORSAY, France). They were carried out on the SACEMOR beam line with high-energy TGM monochromator. The spectra were recorded both in the totalelectron-yield (TEY) and in the partial-electron-yield (PEY). The spectra were normalized to the spectrum of a copper grid freshly coated with gold.
The experiments were carried out in two experimental configurations according to the angle α between the sample and incidence of the light: at normal incidence (α ≈ 0˚) with electric field vector E parallel to the surface of the substrate and at grazing incidence (α ≈ 90 - 10)˚ with E nearly normal to the surface. The energies were calibrated to the carbon ionization potential (IP). Owing to this calibration procedure, the error on the energy at carbon K-edge is expected to be no more than 0.2 eV. The energy step was 0.1 eV. For quantitative information, two nitrogen-containing polymer references are used, namely:
• Poly acrylonytrile (PAN) as a reference for the terminal nitrile configuration, and
• P2VC as a reference for nitrogen in a pirolytic configuration where the lone pair of electrons is outside the aromatic plane.
Lineshape analysis of the individual transitions was carried out using the home-made software (GAXPS). The spectra were deconvoluted by a procedure where each feature was broadened by a variable Voigt function including an overall gaussian broadening accounting for the experimental resolution set to 0.75 eV, a variable Gaussian broadening accounting for electron-phonon interactions, amorphisation effects and the width of the final states distribution, and a lorentzian broadening accounting for the lifetime of the core hole fixed to 0.21 eV for the carbon K edge. Heavyside step functions broadened by the gaussian experimental resolution were added to these individual contributions with an average of 1.5 eV. Then the total resolution of energy is 3 eV.
2.4. Electron Microscopy Experiments
The scanning electron microscopy (SEM) images were performed on a XL30S-FEG PHILIPS working at 3 kV. For transmission electron microscopy (TEM) images, the observation was performed on a TOPCON 002B microscope operating at 200 kV.
3. Results and Discussions
3.1. CNSs Investigations by SEM and TEM
SEM and TEM observations are shown in Figures 1 and 2 respectively. These images illustrate that samples prepared display widely different morphologies. There are four kinds of carbon based nanomaterials obtained: carbon nanotubes (CNTs,) carbon nanofibers (CNFs), Carbon nanoparticles (CNPs) and carbon nanowalls (CNWs). When the plasma power is high and the catalyst concentration low, graphene sheets grow in a normal direction to the substrate surface, forming conical carbon nanostructures with metal particles on top [26]. The size of the catalyst particles has a great impact on the diameter of the obtained CNS. Figure 1 shows synthesized samples with different diameters that might react differently with particles present in the chamber. Table 1 shows the main characteristics of carbon nanostructures production.
A deep analysis of synthesis operation parameters shows that each CNS obtained corresponds on specific values of processing parameters, as illustrated in the following table (Table 1).

Figure 1. SEM images of CNSs obtained on XL30S-FEG PHILIPS working at 3 kV: (a) Forest of CNTs poorly oriented in low magnitude; (b) CNFs poorly oriented; (c) CNFs medium range orientation; (d) CNPs; (e) CNWs; (f) CNTs highly oriented.
3.2. XANES Spectra Analysis
The formation of carbon nanostructures by dc HF CCVD using transition metal catalysts has been yet investigated extensively [23,24]. This formation was found to depend also deeply on initial chemical states of carbon atoms (precursor) and the specific type and size of TM. The use of metallic catalysts gave an improved nanomaterials yield [30-32]. TM catalysts come into close contact with the tube walls and significantly influence the transport

Figure 2. TEM observations of CNSs with catalyst nanoparticles on top obtained on TOPCON 002B microscope operating at 200 kV: (a) CNTs highly oriented; (b) CNTs poorly oriented; (c) CNFs perpendicular oriented on the substrate; (d) CNFs highly oriented on the substrate; (e) CNPs; (f) CNWs.

Table 1. Carbon nanostructures grown on SiO2 (5 nm)/Si(100) substrate and main preparation characteristics. Other conditions are: 100 sccm C2H2: H2: NH3 with relative content 20:79:1, filaments-substrate distance is 5 mm; gas flow: 100 sccm (standard cubic centimetre per minute), Pf (filament power) and Pe (extraction power).
properties of nanostructures. Theoretical investigations revealed that carbon atoms in graphite sheet interact strongly with the TM particles and there is a strong hybridization between carbon 2p and TM d orbitals [32-35]. The charge transfer from carbon to TM effect and the magnetic momentum of the TM atoms were found to depend strongly on the metal-graphite interlayer distance and adsorption site. The curvature of the graphite sheet is also among those factors that were considered to explain the change of the electronic states in CNSs [36]. The carbon K-edge x-ray absorption spectroscopy [21,37,38] and TEM [21,22] revealed that the features of electronic states of the carbon atoms in the carbon nanostructures are very similar to those of graphite. Thus, the CNSs XANES spectra are very similar to those of graphite and almost identical with that of HOPG (High Oriented Pirolytic Graphite) measured at the magic angle (54.7˚), where no polarization dependence of π-type states occurs. Carbon K-edge x-ray absorption spectra of CNSs as observed in Figure 3, can be divided into three regions [18,21,26,37,38].
The first region is located at 285.5 eV with the peak named A. This peak corresponds to the transition towards unoccupied states near Q in the Brillouin zone at 2 eV above the Fermi level. It strongly depends on the incident angle.
The second region within 286.5 - 290.5 eV corresponds to the free electron like interlayer (FELI) states and adsorbed or chemisorbed molecular states. They are strongly dependent on the chemical treatment of the sample before and after an in situ thermal treatment at 500˚C.
The third region above 291.8 eV corresponds to transitions towards empty states of σ* and π* symmetries. Moreover, the angular dependence allows to distinguish σ* symmetry from π* symmetry states.
These main features of each CNS spectrum can be summarized in tables, as XANES spectra of CNTs in Tables 2 and 3 for normal incidence and grazing incidence respectively. There are some non-intrinsic features in XANES spectra, some disappeared or became weak after thermal annealing, among them are P, P’ and P” resulting on potassium contamination [22,26]. This potassium present in samples might come from the beam

Table 2. Main features’ parameters for annealed and potassium-contaminated CNTs XANES spectrum at normal incidence.
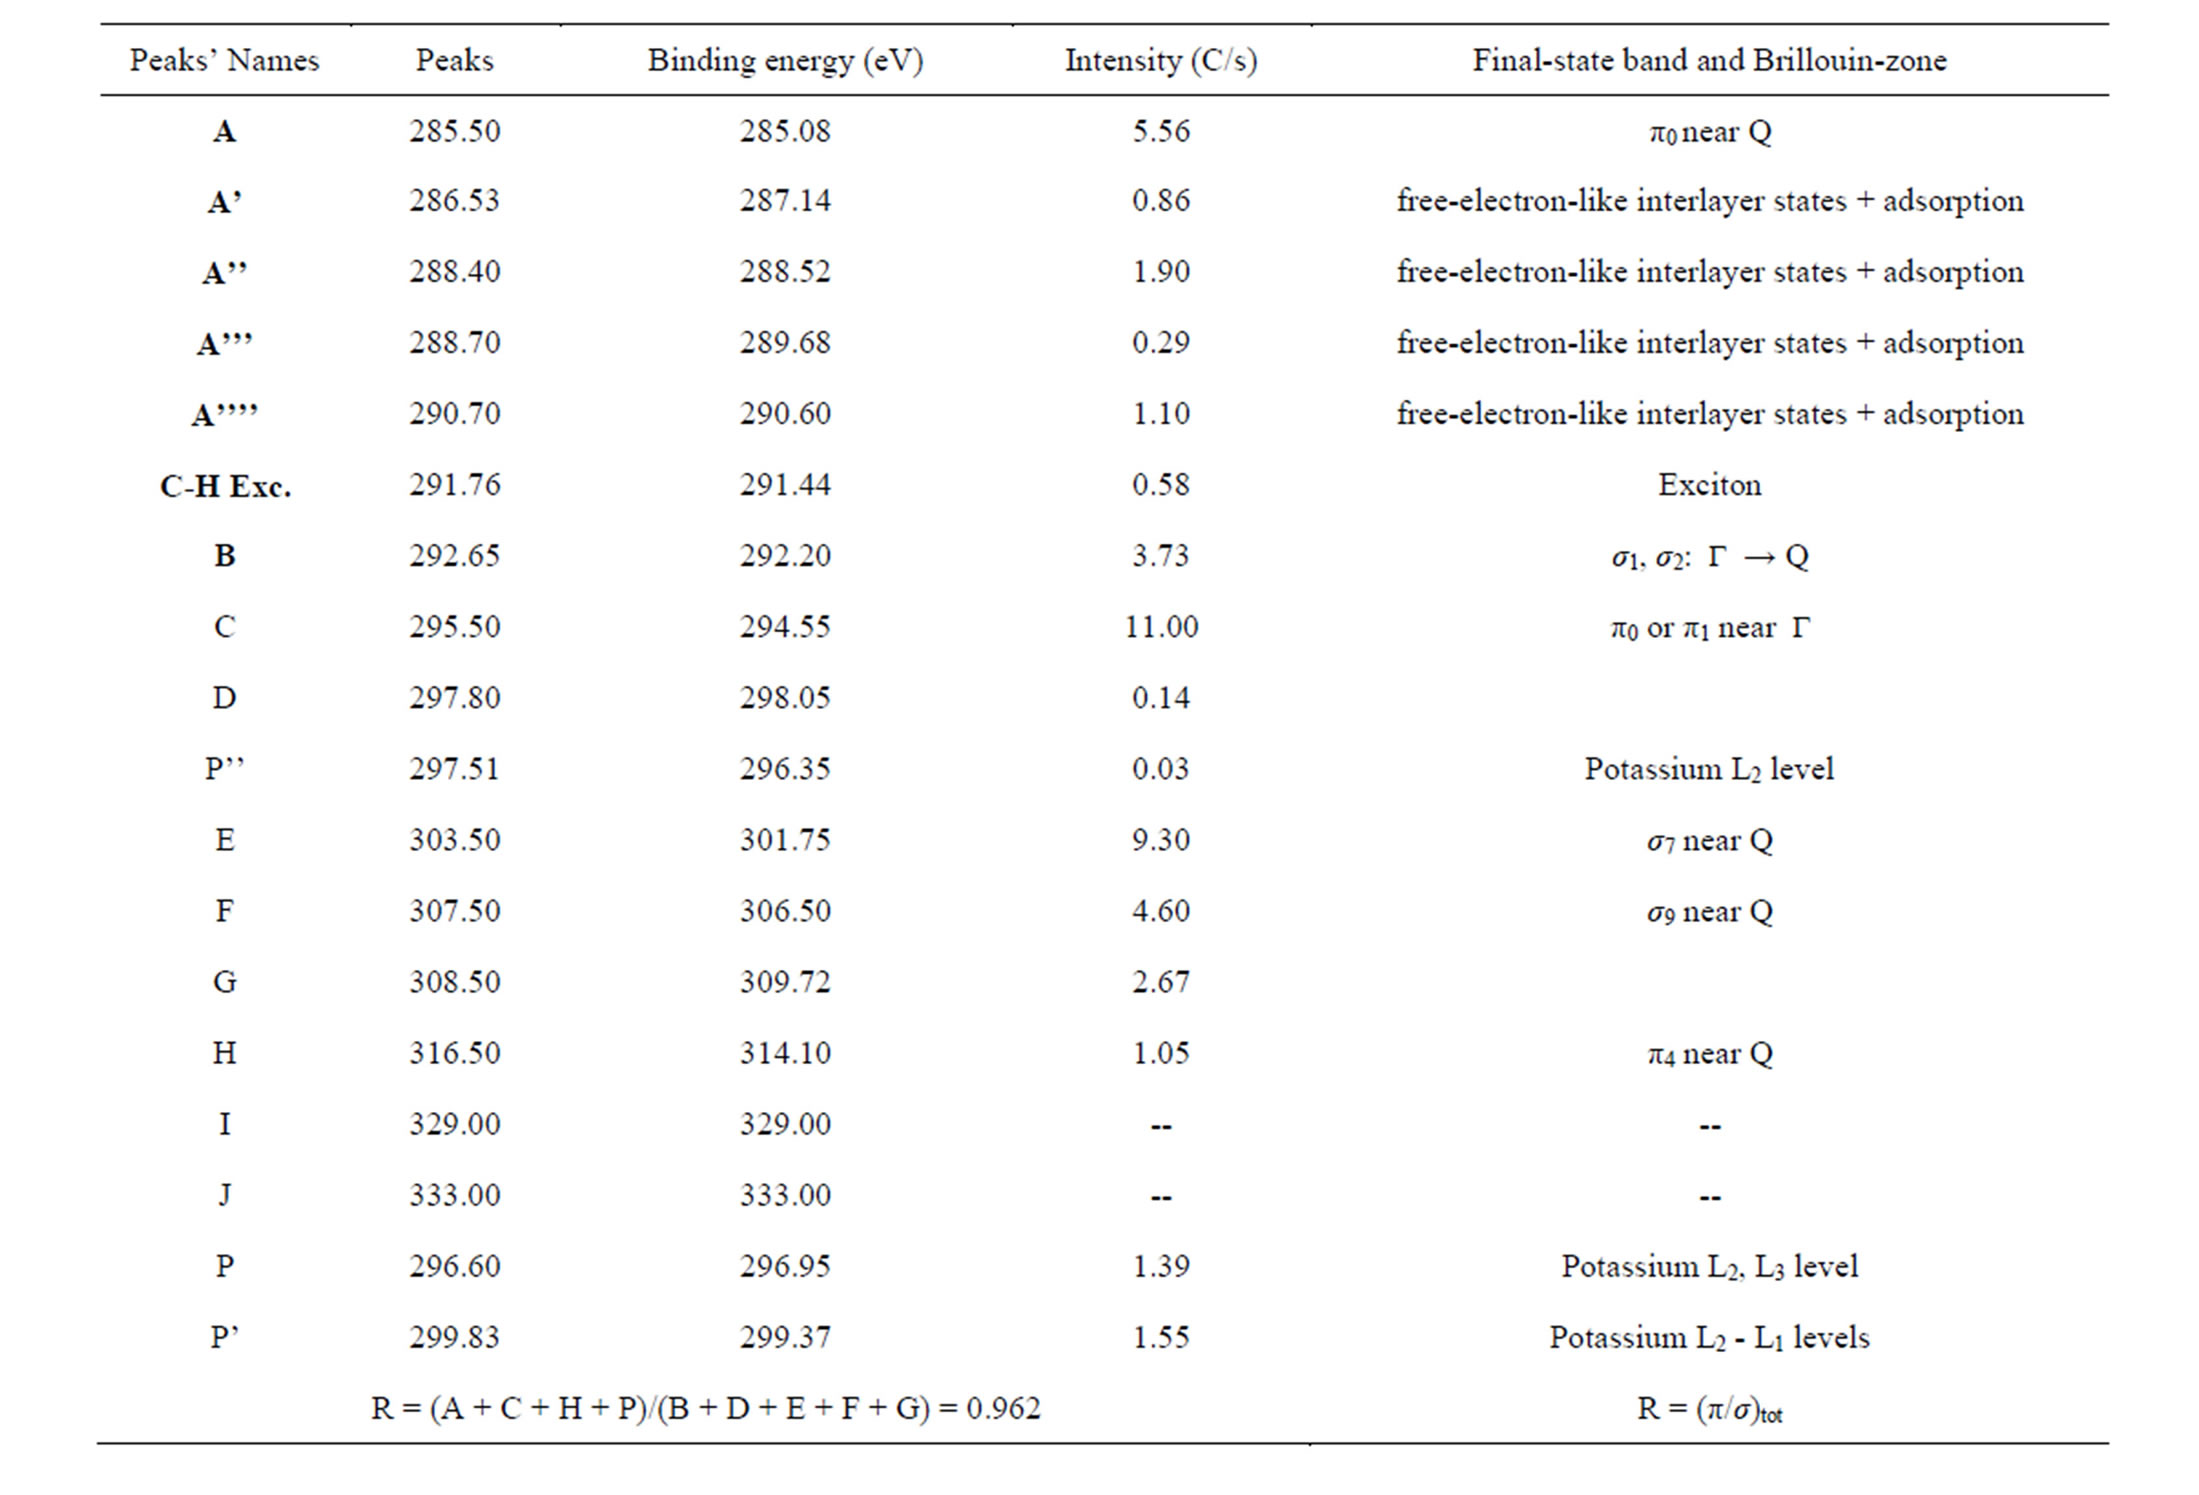
Table 3. Main features’ parameters for annealed and potassium-contaminated CNTs XANES spectrum at grazing incidence.

Table 4. Values of obtained with some samples of R(α) CNSs obtained by dc HF CCVD.
line on the synchrotron station.
The parameter R(α) deduced from the fitting of the carbon K-edge x-ray absorption spectra by the ratio of the total intensity of the main π-type features (A + C + H + P) over the main σ-type features total intensity (B + D + E + F + G), is defined to determine more quantitatively the respective contributions of the σ* and π* transitions at incidence angle α.
 (1)
(1)
 (2)
(2)
This ratio calculated in Tables 2 and 3 for some CNTs samples is indicative of the orientation tendency of the graphite orbitals [22] and as consequence, the graphene layer’s.
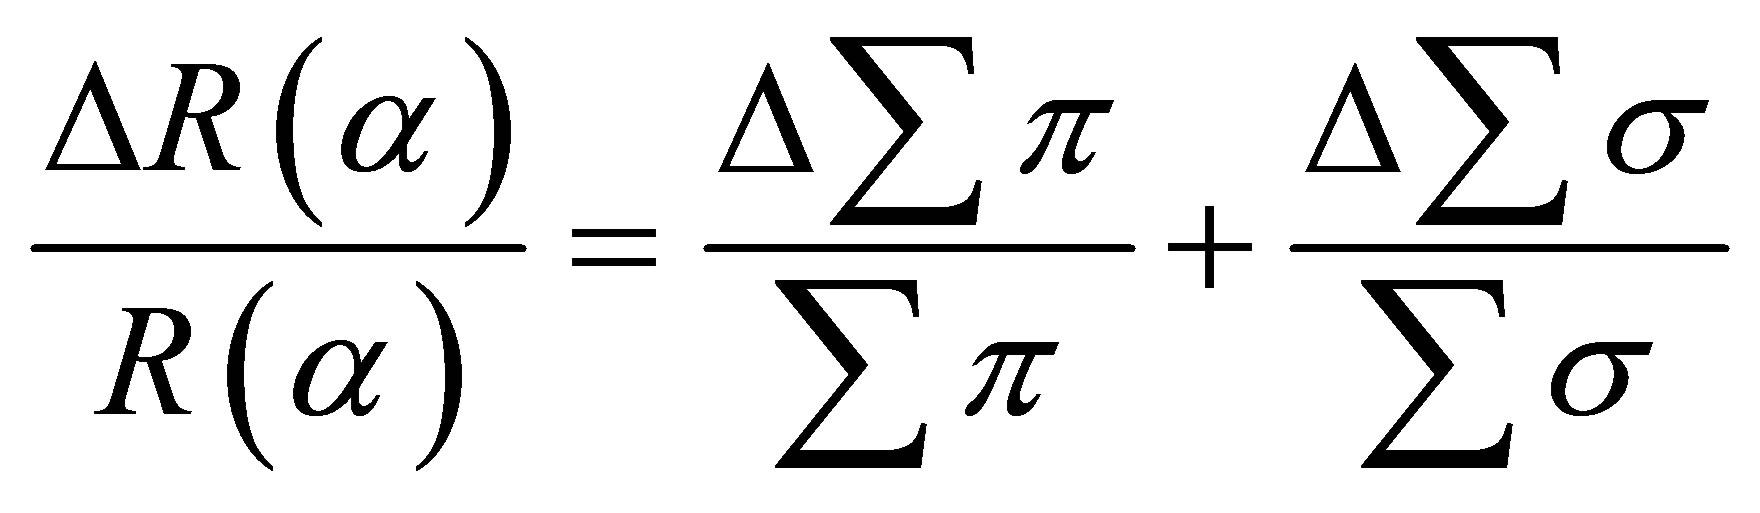
The measuring error in intensity was set equal to 0.1 C/s and the error due on the broadening of peaks 0.1 C/s. The overall error coming from the fitting procedure is then equal 0.2 C/s for each peak. The peak intensity is proportional to the correspondent peak’s area. The error in calculating R(α) parameter is:
for normal incidence,

for grazing incidence,
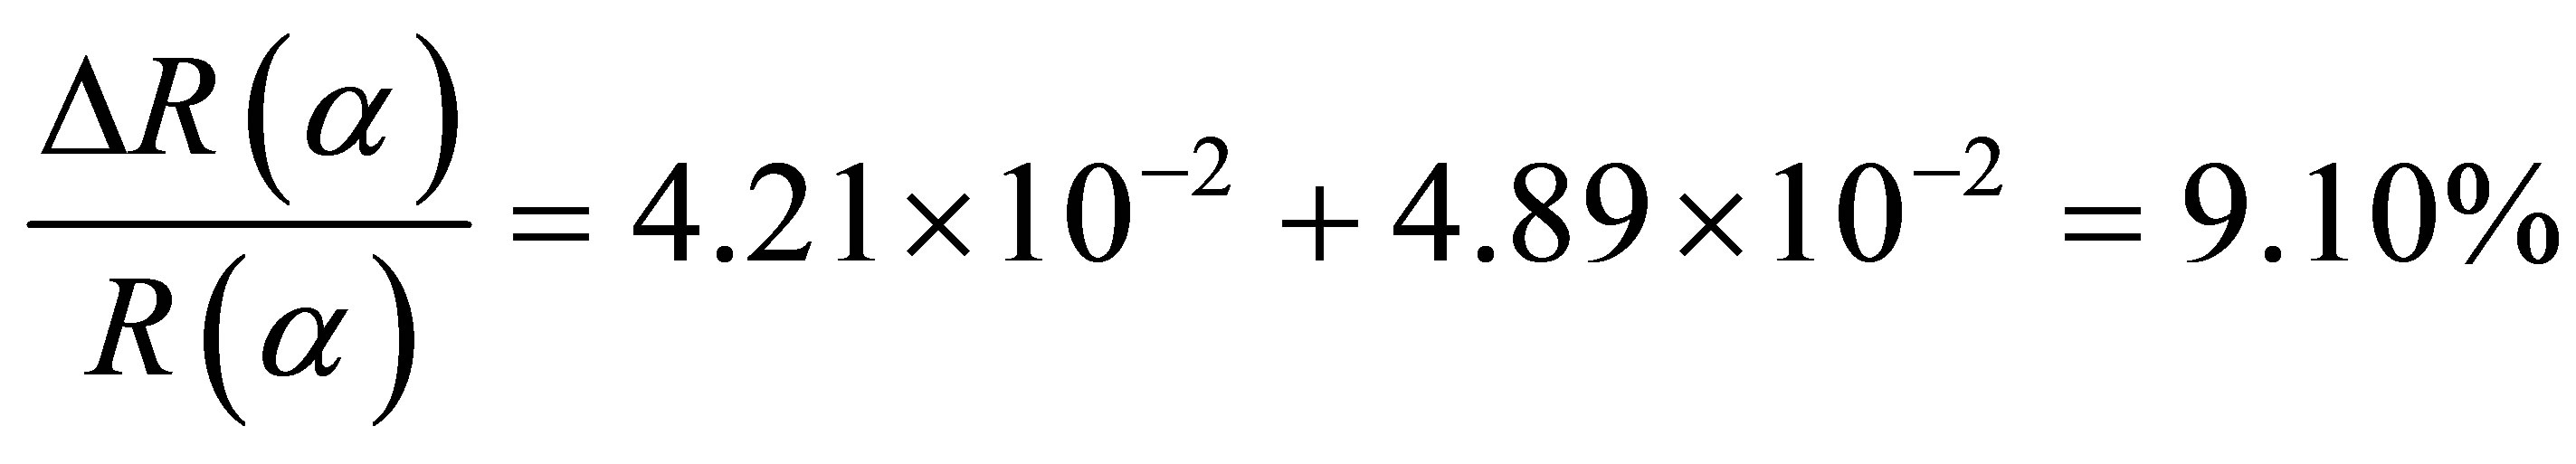
The fitting error on R(α) is around 8.7%. This value remains satisfactory.
The analysis of different values of R(α) (Table 4) allows the same classification such as with electron microscopy images. First of all, there are poorly oriented tubules with an absolute term of ΔR(α) less than 0.100. For this group, the discrepancy between the two values (NI and GI) is small. The second group is formed with samples that R(α) difference absolute term is between 0.100 and 0.200 or in the medium range. The last group has samples with large absolute term of the difference or higher than 0.200. This classification is in fairly agreement with electron microscopy. So the value of ΔR(α) informs quantitatively on the difference of intensity between peaks of σ* and π* symmetries.
The use of R(α) parameter gives information about some CNSs. It can first of all state on CNS orientation relatively to the substrate surface in the case of tubular CNS. Samples with small values are poorly oriented. The CNWs are the poorest oriented of all CNSs and correspond to the smallest value of ΔR(α) (=0.011). It can also inform about the contamination of CNSs, the parameter value is proportional of contamination or of chemical reactivity. As direct result, the prominence of peaks of π* symmetry amplifies R(α). XANES spectra show at the same time, that thermal or chemical annealing helps to drop away contaminants for CNSs with a small curvature as MWCNTs. They are characterized by carbon atoms with hybridization state close to plan graphene layer’s atoms. For CNSs that contaminants are not sent away by these treatments or just partially, they are characterized by great curvature, their hybridization state is close to sp3.
As summary, R(α) parameter expresses quantitative properties of CNSs. It can be related to curvature, hybridization state and contamination of each CNS. This last property is fairly related to chemical inertness. Then the ability for functionalization, can be determine by R(α). It can be assessed more generally, that XANES spectroscopy parameter R(α) characterize quantitatively different carbon nanostructures. As a general trend, the R(α) values at normal incidence are greater than those at grazing incidence. It is in opposition to its obtained values for the HOPG.
In the related case, R(α) equals 0.926 in grazing incidence and 0.076 in normal incidence for HOPG. In fairly agreement with the literature, it is expected to be maximum and minimum when graphite (HOPG) XANES spectra are recorded at grazing and at normal incidence respectively [37].
4. Conclusions
In this paper, complementary analysis of CNSs using Electron Microscopies and XANES spectroscopy shows that dc HF CCVD is a versatile technique to produce various kinds of CNSs. The nanostructures obtained depend largely on experimental processing parameters. It can give CNTs, CNFs, CNPs and CNWs. If defects related to graphene sheet such as Stone-Wales defects (carbon rings other than hexagonal), rehybridization defects (sp3 bonds instead of sp2), vacancy defects (missing atoms) and topological defects induce slight changes of peaks intensity and can be neglected. The principal distinctions between spectra are therefore related to the presence of contaminants. Although the literature is poor on that subject, we have investigated and stated the presence of strong bonds between CNS and contaminants, generating prominent peaks of π-symmetry in XANES spectra, providing information about CNSs. The strong and weak bonds can be quantized with XANES spectroscopy parameter R(α). According to the characteristic XANES parameter, it appears that CNSs with a great curvature have a considerable chemical reactivity and are appropriate for applications such as functionalization. Consequently, SWCNTs and other carbon nanostructures with great curvature might be well treated chemically or thermally (up to 1000˚C) because contaminants are well tied on their sidewall after the synthesis process. On the same time, functionalization with CNSs that have relative small curvature should be complex because of chemical inertness. XANES spectroscopy gives a relationship between the curvature, the carbon atoms’ hybridization and the sidewall adsorption of contaminants on carbon nanostructures. The extraction of catalyst particles is among difficulties that till have to be overcome.
The knowledge of XANES parameter allows a detailed analysis on hybridization character, contamination, curvature and chemical inertness of carbon nanostructures.
NOTES