Characterization and Evaluation of Natural Resources for Land Use Diversification Planning: A Case Study in a Block of Meghalaya Using RS & GIS Technique ()
Soil characterization is basically an inference process based on Jenny’s model [4]. According to this model climate, parent material, relief or topography, vegetation and time are the soil forming factors that influence on soil characteristics. The climate acting over parent material for pedogenic time on different physiographic unit is the most dominant factor responsible for development of different types of soil to support different vegetation. Vegetation types are also one active factor which greatly influences soil formation by adding organic matter, providing pores for translocation and accumulation of minerals and clay. During soil development many morphological, physical, chemical, biochemical and, macro and microbiological reactions and processes occur simultaneously as also interactively in soils. These reaction and processes that affect the properties of soils and its development are in turn influenced by several natural factors viz., climate, organism, parent material and modified to a great extend by the relief features. The surface configuration is the chief factor in soil development and close relation exists between soils and their morphological setting [5]. Since the productive potential of the soils is limited by intrinsic characteristics, understanding of the soils as influenced by landscape features is of great significance. The spatial information technologies viz. Remote sensing (RS), Geographic Information System (GIS) and Global Positioning System (GPS) have made it possible to characterize the soil forming factors and infer soil boundaries based on field survey, soil sample analysis image characteristics. The application of satellite remote sensing data products for small and medium scale soil mapping is widely accepted, but they have not been used for large scale soil mapping due to coarse resolution of satellite data [6]. With advances in terms of spatial, spectral and radiometric resolutions of the sensors, studies have been initiated to characterize soils at large scale through physiography-land use-soil relationship [6- 11].
The land use planning involves making knowledgeable decisions about land use and the environment. Soil information is a vital component in the planning process, reflecting directly upon land-use suitability. The land evaluation system of FAO (1983) was based on land qualities as related to individual crops that was used to develop the crop requirements based on experiences in tropical areas [12]. This land evaluation system for land use was earlier adopted to derive land suitability map in Seoni district, Madhya Pradesh [13]. Computer program, which includes decision support systems (models) and Geographic Information Systems (GIS) has contributed to the speed and efficiency of overall planning process. Quick and efficient access to large amount of information was enabled by GIS, exhibiting relationships, patterns, and trends that are useful in combining soil survey information to monitor land use changes [14]. Soil survey database could be used to estimate soil characteristics based on known relationship to other soil physical and chemical properties and also to improve fertilizer recommendations on the basis of soil test values [15]. Of late, advanced land evaluation techniques have been found useful in addressing soil fertility constraints and management problems in the areas of low productivity [16]. In some of such areas that are inhabited by tribal farming communities crop failures were experienced frequently due to traditional agricultural practices. These areas should be given priorities for improved crop planning and agricultural development. The land resources can be better managed through systematic soil characterization and evaluating their potentials and limitations with appropriate interventions. Keeping in view above, an attempt has been made to characterize and evaluate the land resources of Mawryngkneng Community and Rural Development Block of East Khasi hills district of Meghalaya using Resourcesat-I data and GIS.
2. Materials and Methods
2.1. Study Area
Mawryngkneng Community and Rural Development Block is one of the oldest block lies in the East Khasi Hills District of Meghalaya between 25˚32'05''N to 25˚38'20''N latitude and 91˚50'00''E to 92˚10'00''E logitude. The total study area is approximately 310.6 sq·km. The area is covered by Survey of India Toposheet 78 O/14 and 83 C/2 on 1:50,000 scale (Figure 1). The geology of the study area comprises mostly of 1) Shillong Group of rocks-quartzite, phyllite, conglomerate 2) Arehan gneiss complex 3) Granite rocks and tertiary sediments consisting mainly of sandstone, limestone, silts
stone, shale and pebbles, clays, conglomerates. These sedimentary rocks are in complex form. Physiographically, the area is mostly characterized by Structural Hills, Denudational Hills and Valley associated with nearly level to moderately steeply sloping lands. The study area is sparsely populated with a total population of 50,035. The habitation is restricted mostly to village settlements and very few homesteads. Out of the total household of 8751 families, the male population is 47% and the female account for 52.8%. The manpower resource is derived from the age group of 14 to 50 years of both male and female gender. The average size of the family is 8 out of which 49.66% of the population is literate. Agriculture is the main occupation of the people. The general standard of living of the people is poor to medium. There are several educational institutions within the area from Primary to High School standard. There are several registered growers of potato and retailers of chemical fertilizers. The National Highway 44 runs through a part of the study area, and hence the farmers can easily market their products. 70% of the villages are connected with kutcha motorable roads.
The study area represents the typical sub-tropical northeastern region. Mild summer and cold winter characterize it. The mean summer temperature is 22˚C and mean winter temperature is 3˚C. The average annual rainfall of the area is 2087 mm with more than 80% occur during the period from April to October and qualify for thermic and udic soil temperature and soil moisture regimes, respectively. The study area entirely covered by natural vegetation comprises Pine (Pinus khasiana) in the higher elevation and tree species such as Schima vallichi, Phyllanthus emblica, etc. are in the lower elevation, scrubs interspersed with grasses and rock out crops. Cultivation is done on the valley fields as well as on the upland. Bun Cultivation is unique system of cultivation followed here where the gentle slope up to 15 percent are used for cultivation of crops like potatoes, cabbage, cauliflower and tomatoes in ridges along the slopes. The cultivation sites on the hill slopes are permanent. In bun cultivation farmers covers the branches of trees and grasses with soil and then burn them inside the ridges made along the slope [17]. Farmyard Manure and chemical fertilizers are then added to it. Agriculture is the main source of livelihood of the people in the study area. The main crops grown are Lowland/Wet Paddy, Upland paddy, tomatoes, potatoes (twice in a year) peas, maize, cabbage, cauliflower, carrot, radish, sweet potato, ginger and tea plantations in few pockets are also found. The cropping season of the major crops are as given in Table 1.
2.2. Satellite and Ancillary Data
Digital data of IRS -P6 (Resourcesat-1) LISS III sensor of October, 2011 (Spatial resolution of 23.5 m) and LISS-IV sensor (Spatial resolution of 5.8 m) of February, 2012 was used to prepare physiography, lithology and land use land cover map. Digital Elevation Model generated from Cartosat-I image was used to derive slope information.
2.3. Methodology
The methodology followed for extraction of information from satellite data is essentially of standard visual interpretation based on tone, texture, shape and size [18]. The slope map was derived from Digital Elevation Model generated under SISDIP project for Meghalaya at North
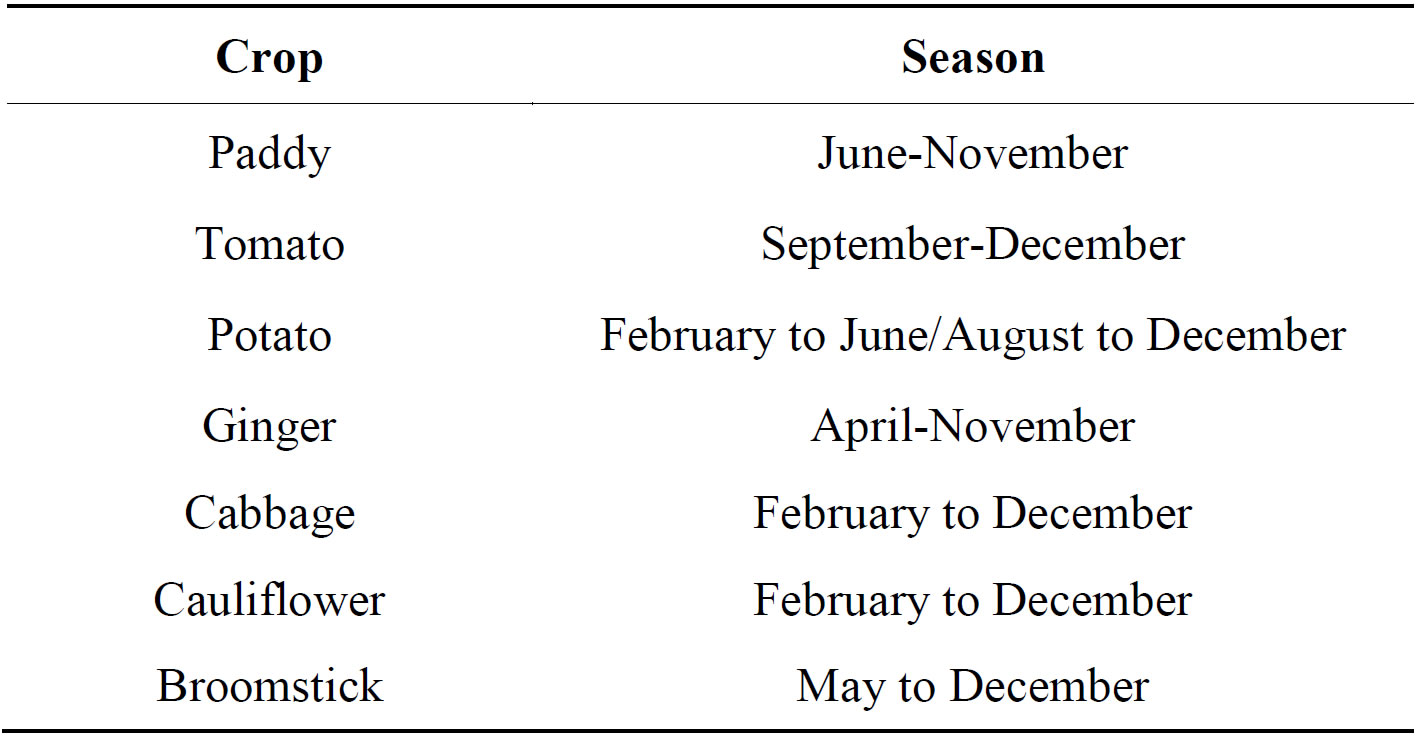
Table 1.Major crops grown and the season of cultivation.