Monitoring Landslide-Induced Displacements with TerraSAR-X Persistent Scatterer Interferometry (PSI): Gimigliano Case Study in Calabria Region (Italy) ()
1. Introduction
Many densely populated and urban settlements are located over unstable areas that are affected by landslide phenomena, threatening human lives and structures. In these urbanized areas, the potential socio-economical losses and damages are stronger because of the higher value of the element at risk exposure. The impact of these natural disasters in highly settled and susceptible areas can be reduced or even be prevented by performing proper identification and mapping of such ground movements, in order to support an appropriate land use planning and to facilitate the risk mitigation design.
Mapping and monitoring of active landslides and vulnerable slopes can greatly benefit from remote sensing data, thanks to their great cost-benefits ratio, non-invasiveness and high precision.
Persistent Scatterers Interferometry (PSI) is an advanced multi-temporal interferometric technique, which represents a powerful tool for identifying ground surface movements and for reconstructing the temporal evolution of the investigated events [1-3].
PSI data are very useful particularly in built-up and urbanized areas, where many radar reflectors, corresponding to man-made structures (buildings, roads, pylons etc.), are retrieved.
The launch of new SAR sensors, i.e. TerraSAR-X, which operate at 3 cm wavelength in X-band with higher spatial resolution and reduced revisiting time (11 days) with respect to C-band satellites (ERS, ENVISAT, RADARSAT), has enhanced PSI capability for landslides mapping and monitoring of more recent and faster ground movements over small areas with improved precision [4,5].
The aim of this work is to perform a detailed detection and characterization of landslide-induced displacements at local scale on Gimigliano site in Calabria Region (Italy) by means of PSI analysis exploiting X-band data from TerraSAR-X satellite. In order to assess any temporal patterns of deformation, the present TerraSAR-X PS data were analyzed and compared with historical radar measurements acquired by ESA missions archives (i.e. ERS and ENVISAT satellites) in C-band. The measured ground motion rates from SAR datasets were integrated with available geo-information such as geological and geomorphological evidences resulting from existing auxiliary data (e.g. landslide databases, thematic maps and aerial orthophotos). The analysis permitted us to obtain an accurate deformational scenario within the site-specific investigation, and to finally achieve a detailed overview of the spatial distribution and temporal evolution of ground movement phenomena in Gimigliano area.
2. Study Area: Gimigliano (Calabria Region)
2.1. Geographical and Geological Setting
The area of interest is located in Gimigliano municipality (Catanzaro province, CZ) in Calabria Region (Italy) and has an extension of about 15 km2 (Figure 1a).
Calabria Region is extremely vulnerable to ground mass movements because of its geological setting and climatic conditions. Landsliding and slope instability are produced by soft rocks, rapid tectonic uplift, seasonally heavy rainfall, and constitute a major hydro-geological hazard [6].
The choice of the study area was driven by previous works on landslide hotspots mapping in Calabria Region that evidenced the priority landslide-prone areas characterized by the higher hydrogeological hazard [7,8].
We focused on two sites: Gimigliano town, within the main urban centre, and a periferic district, Cavorà (Figure 1b). The old medieval village is divided into two built-up areas (Gimigliano Superiore and Gimigliano Inferiore), which are placed almost on the same axis NNE oriented, but at different altitudes: “Gimigliano Inferiore is at an altitude of about 510 m a.s.l., while Gimigliano Superiore, is sited at 620 m a.s.l.. Both areas are located on sloping ridges of Gimigliano Mountain. The new modern Gimigliano town is built-up on the eastern lower part of the urbanized area. Cavorà is a district located in the southern-eastern part of the Gimigliano municipality.
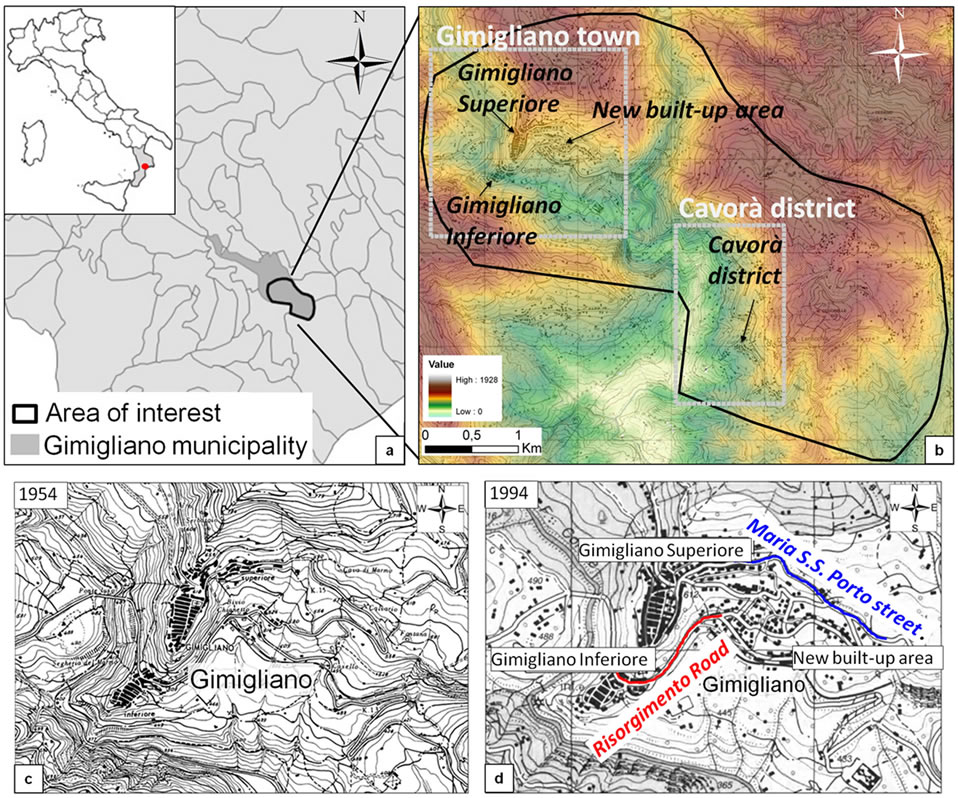
Figure 1. Geographical location of the study area.
The overlap of recent and past cartographic maps evidences that areas already affected by hydrogeological hazard and catastrophic events in 1950s have been nevertheless modified and built-up throughout recent urban planning and unauthorized private enterprises [9] (Figures 1c and d).
Gimigliano area lies on Liguride and Calabride Complexes [10], including an important “tectonic window” made of Mesozoic ophiolite rocks. The main lithotypes that outcrop in the area are metamorphic basic units (Ophiloite Unit) such as metabasites, serpentinites, and fillads (Liguride complex), tectonically overlapped by metamorphic and crystalline acid rocks (Calabrian Complex) such as ortoand para-gneisses.
From a tectonic point of view, the metamorphic nappes show tectonic contacts marked by pre-Neogene subhorizontal striking NE-SW thrusts, dislocated by the Neogene-Quaternary regional NW-SE transpressive system faults [10]. In particular, the Gimigliano ophiolite outcrops are placed in the transpressional sector, developed between the regional Amantea-Gimigliano Fault (AGF) and a couple of minor Neogene-Quaternary leftlateral strike-slip NW-SE faults, extending from Gimigliano Inferiore village to Cavorà (Figure 2).
Gimigliano village is located on a “flower structure” within a push-up system. The transpressional mechanism also dragged up deep-seated units towards SE Gimigliano site, where ancient thrusts separate the “Ophiolite”, the “Slate and Metapelite” and the “Orthogneiss” units [10]. The well-structured fault system generates many wide cataclastic zones characterized by weathered and intensively fractured rocks. The outcropping rocks show a stone behavior, even if schistosity and jointing lead to the formation of deep granular layers that turn out to be geotechnically soft and highly erodible.
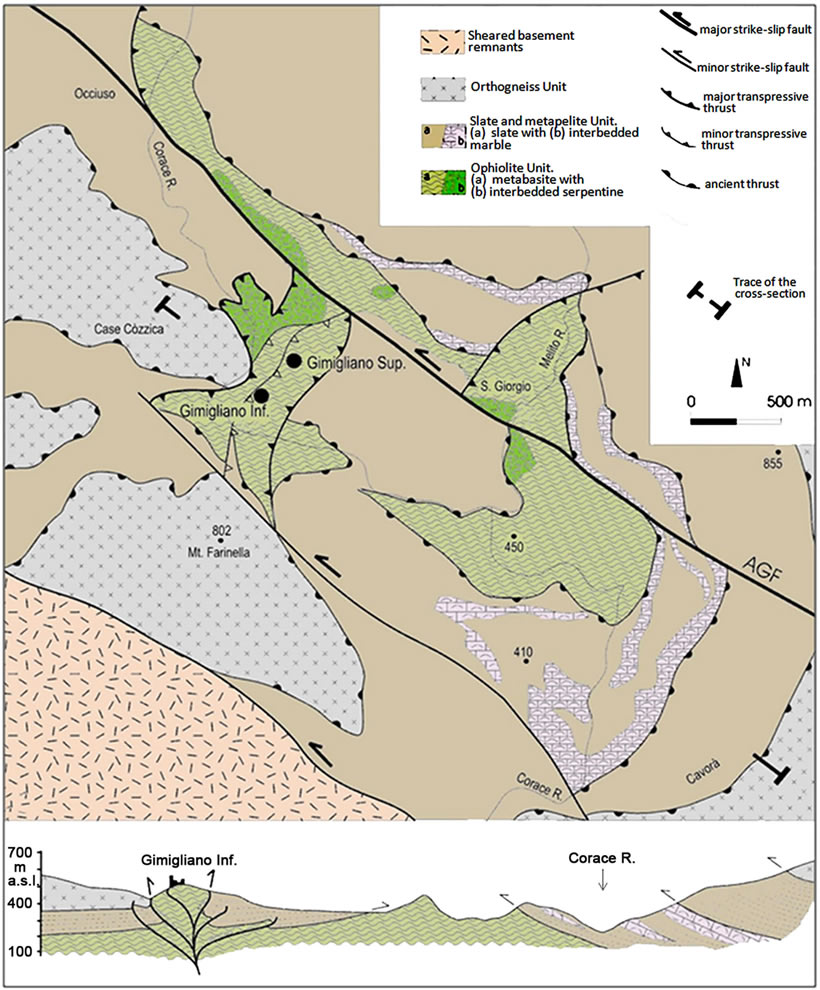
Figure 2. Geological-structural setting of Gimigliano area.
2.2. Case History: Landslide Events Occurrence
Landslide phenomena are widespread across time up to nowadays, all over Gimigliano area. The mass movements are mainly triggered by intense precipitation that usually occurs in single daily rainfall events, causing a strong impact on rocks weathering and degradation.
In winter 2010 severe precipitation triggered more than 180 landslides in Calabria: catastrophic landslide events occurred in Gimigliano area, as recorded in local chronicles and documents (Figure 3).
In January-March 2010, several rainfall-induced landslides affected Gimigliano town, and caused damages to structures, infrastructures and roads. More in detail, in January 2010 an earth slide occurred on the slope along Corace River, reactivating a dormant deep-seated landslide: the pre-existing displacement scarp surface enlarged, damaging Corace bridge pylons and threatening its stability (Figure 3). The provincial road across the bridge was blocked and this made impossible to reach the western town districts, the near municipalities and the national road for several months. A similar event happened on 13th February 2010, when a landslide occurred on the metamorphic rock escarpment, threatening the buildings stability of the upper Gimigliano Superiore village, as well as the safety of the Risorgimento road below (Figures 1d and 3). On 10th March 2010, rainfall storm with intensity climax in 1 - 2 hours, triggered a complex landslide on the already unstable rock slope of Mt. Gimigliano southern mountainside: the mass movement evolved with soil erosion processes and from slides to flows, caused by springs formation in the landslide crown zone, producing saturation of pelitic terrains derived by weathered fillads in some parts of the landslide body. The surface flows also caused rock falls on the unstable bedrock and reached Maria S.S. Porto street below (Figures 1d and 3).
At the end of January 2011, in Cavorà district, sever precipitation triggered a deep-seated landslide, reactivating a suspended phenomenon occurred on 28th January 2010 and causing huge damages to the road network (Figure 3).
3. Data and Methodology
The approach of this work aims at exploiting PSI analysis of new X-band SAR data for ground displacement studies over Gimigliano, focusing on the landslides spatial distribution and temporal evolution, in support of further evaluation and management of their consequences.
Starting from the ground movements scenario in winter 2010, when many landslides occurred in Gimigliano area, the PS data acquired before and after these events are analyzed, as well as all the available ancillary data for the study area, such as landslide databases and thematic maps (e.g. aerial orthophotos) (Figure 4).
The methodology performed is based on the integration of the recent X-band PS data with historical motion rates derived from past SAR archives of ERS1/2 and ENVISAT satellites in C-band, in order to assess any spatial and temporal evolution patterns of deformation. The photoand radar-interpretation procedures have been recently exploited and validated by several scientific applications [8,11-16]. Following these procedures, the radar data acquired from different datasets are combined with geological and geomorphological evidences resulting from the auxiliary data such as aerial orthophotos referred to different dates and existing landslide databases. i.e. PAI and IFFI inventories, referred respectively to 2001 and 2007 [17,18].
All the data are implemented in a Geographic Information System (GIS) environment, which enables to properly overlap and combine their layers.
The information coming from PSI, inventories, topography and aerial imagery analysis is finally validated with recent field checks and in situ observations.
The operative procedure finally led to the detailed temporal and spatial mapping and characterization of ground movement phenomena in Gimigliano area (Figure 4).
In order to evaluate any deformation patterns, prior and after known landslides that occurred in 2010 in Gimigliano area, input data referred to different dates were collected, combined and analyzed.
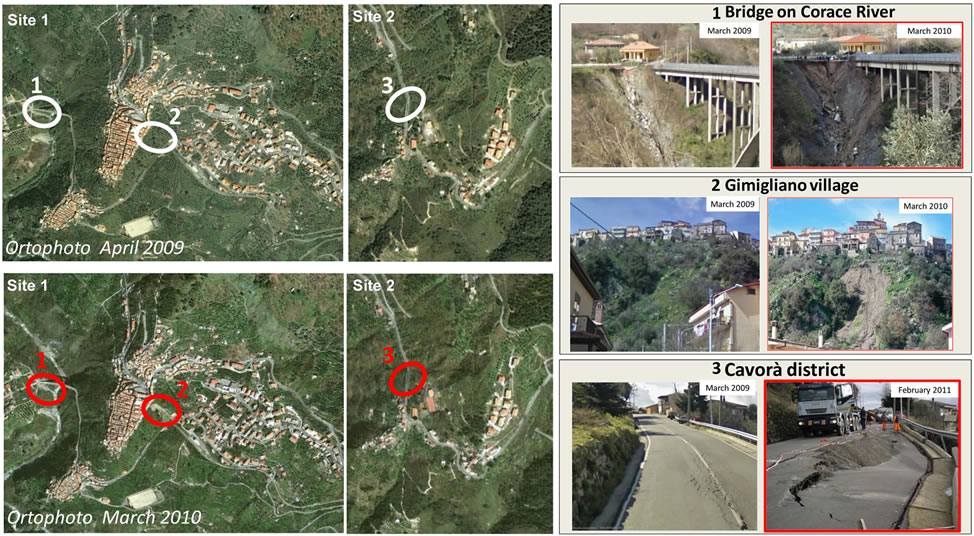
Figure 3. Location and date of recent landslide occurrences in Gimigliano area (1) landslide on the scarp along Corace river, damaging Corace bridge pylons; (2) landslide on metamorphic rocks slope, threatening Gimigliano Superiore buildings; (3) landslide in Cavorà district.
ERS PS data acquired in the spanning time 1993-2001 were exploited and overlapped on PAI landslide inventory map referred to 2001 and on orthophotos from Volo Italia 2000; ENVISAT data cover the time period 2003- 2009 and were overlapped on IFFI landslide inventory dated 2007 and on orthophotos referred to 2006. TerraSAR-X data, acquired in 2010-2011, were exploited superimposing them on recent aerial photos taken in 2010-2011.
3.1. Aerial Imagery
A geomorphological analysis of the land morphology temporal evolution was performed through a set of aerial photographs, referred to the period from 1994 to 2011. In particular, orthophotos in monoscopic configuration were available for 7 different reference dates (1994, 2000, 2004, 2006, 2009, 2010, 2011). Orthophotos analysis is exploited to identify geomorphologic evidences, soil erosion indications, anomalies or differences in vegetation coverage, allowing the possible identification and mapping of ground instabilities and land movements.
Monoscopic photo-interpretation of optical aerial and satellite images is a traditional tool for geomorphological studies [19]; its combination with topographic maps or DEM layers and its integration with PSI radar-interpretation facilitates the recognition of counterslope variations as landslide indicators and the delimitation of the geometry of unstable areas [3,8,15].
3.2. Landslide Inventories
The available official landslide inventory maps (PAI and IFFI) derive from local information, aerial photographs and field surveys. These maps reveal detailed information about location, typology, state of activity and areal extension for each phenomenon. IFFI database is published in 2007 [18] and updates PAI (referred to 2001) [17], basically tying with it: the spatial geometries of all the landslides mapped in PAI database within Gimigliano area are not modified in IFFI. The state of activity is changed for only one phenomenon (from stabilized to dormant, GIM11), while the typology is changed for some phenomena, due to a different nomenclature. According to the landslide type classification of [20] and [21], the shallow-seated landslides zones (SSL) and the deep-seated landslide zones (DSL) distinguished in PAI inventory are defined respectively as areas of the slope characterized by distributed and spatially limited landslides and areas characterized by landslide phenomena not singularly detectable affecting wide slope portions. In IFFI inventory, SSL phenomena are distinguished in falls/ topples-affected areas and shallow landslides-affected areas, depending on the observed movements, while DSL are denominated as complex phenomena.
Referring to the IFFI database in the study area, a total of 32 landslides have been mapped until year 2007, which are predominantly roto-translational slides and complex landslides, respectively 18 and 14 phenomena; according to [21] classification, 17 mapped mass movements are classified as “active” (including active, reactivated and suspended) and 15 as “dormant” (potentially reactivated). Many areas affected by active landslides have been classified as high and very high risk areas, according to the Italian Decree Law no. 180/98.
3.3. PS Dataset: TerraSAR-X Data
The German satellite TerraSAR-X is the first high resolution radar system carrying X-band SAR sensor, mostly to facilitate the research and application of land surface phenomena with high precision and short revisiting time [22]. TerraSAR-X has significantly improved the level of detail of the analysis and extends the applicability of space-borne SAR interferometry technique to more recent and faster ground movements, due to high ground resolution, (up to 1 meter) and short repeat cycle of only 11days.
TerraSAR-X radar data are particularly suited for local detection of earth surface processes at small scales, since high resolution and density of PS point targets in X-band permit to better understand and accurately describe deformation phenomena, entering at the level of the ground motions site-specific investigation.
The use of TerraSAR-X imagery facilitates the investigation of landslide phenomena, thanks to the higher precision of the estimated motions compared with the on-going medium resolution SAR sensors, such as ERS1/2 and ENVISAT. These advantages allow studying highly localized displacements and their dynamic evolution patterns. Although temporal decorrelation is more problematic at X-band compared to longer wavelengths as Cband, the high-bandwidth data enable more coherent targets to be identified and faster phenomena to be detected.
In this work, a set of 27 TerraSAR-X SAR images have been acquired over an area with an extension of 116.9 Km2 to perform the PSI analysis. All these scenes have been acquired from the satellite TerraSAR-X in Spotlight mode, along descending orbits, with a look angle of 34˚. These data cover the period from 27th November 2010 to 1st October 2011, with time intervals between subsequent images of 11 or 22 days. Given the revisit time and the wavelength, the maximum detectable movement between two consecutive acquisitions is about 0.75 cm in 11 days, corresponding to 25 cm/yr.
The available scenes were processed by e-GEOS by means of Persistent Scatterers Pairs approach (PSP-IFSAR analysis) [23], providing 50,173 PS, with a resulting radar benchmarks density of 3279.3 PS/km2 (Figure 5).
Figure 5 shows the perpendicular baselines (Bn^), expressed as a fraction of the critical baseline, which is 5600 m, and the measured mean velocity, in descending modes, along the satellite LOS. For each PS point, the following data were extracted:
- Position: geographic coordinates (latitude, longitude) and elevation, with meter precision;
- Annual average velocity along the LOS for the acquisition spanning time with a precision of about 1 mm/ yr (depending on the distance of each PS from the reference point);
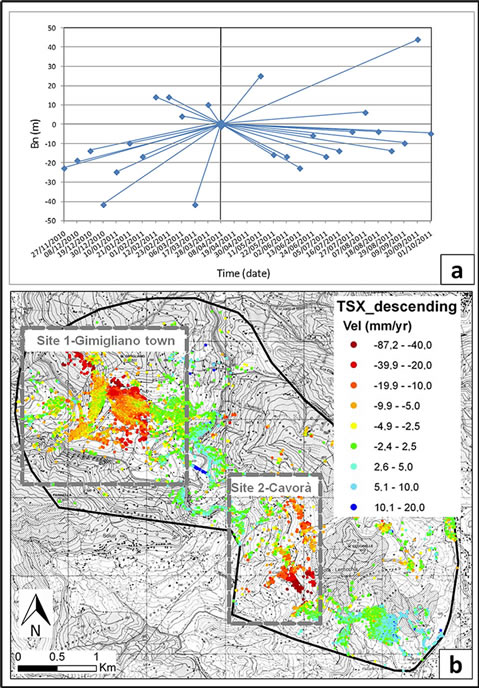
Figure 5. TerraSAr-X data: (a) Perpendicular baselines plot; (b) PS LOS velocity values distribution.
- PS displacement time series LOS displacement at each acquisition date, with millimeter precision.
The LOS displacement rates range from −90 to +20 mm/year, relative to the reference point in the spanning 11 months acquisition time. Within the PS velocity, a threshold range of ±2.5 mm/yr (away or toward the satellite direction) was fixed on the basis of landslide types and of InSAR data statistical characteristics and precision, for classifying PS rates and for distinguishing moving from not moving area. This range is displayed in a green color and it is thought to identify stable movements. The increasing negative sign corresponds to a downward motion, moving away from the sensor direction, while the positive sign stands for a movement towards the satellite.
4. Monitoring Landslide-Induced Phenomena in Gimigliano Area
Ground motions within Gimigliano area were analyzed by means of PS data and their interpretation. Radar-interpretation can be very useful for mapping ground displacements especially in artificial and urbanized areas where many PS benchmarks (e.g. buildings, roads and other reflective structures) are identified. Throughout radar-interpretation, combined with photo-interpretation which is on the contrary very suitable in natural and vegetable areas, we can get complete information on slope instability and therefore map landslides at local scale.
4.1. Historical Scenario
In order to spatially and temporally evaluate historical deformation rates and patterns, the area of interest was firstly investigated throughout PS data from ESA C-band satellites, ERS and ENVISAT, referred to two temporal periods before 2010. ERS data were available in both ascending and descending geometries in the spanning time 1993-2000 and ENVISAT only in ascending orbit, covering the acquisition time 2003-2009.
Analyzing separately the two PS datasets, each one overlapped on aerial photos taken in an around corresponding time period, an accurate detection of the areal extension and boundaries of landslides was performed, as well as an analysis of their spatial and temporal kinematical characteristics, focusing on the two chosen sites, Gimigliano town and Cavorà district. Landslides have been recorded by a code depending on the site location (GIM or CAV, standing for Gimigliano town and Cavorà district, respectively) (Tables 1 and 2). For each PS, the
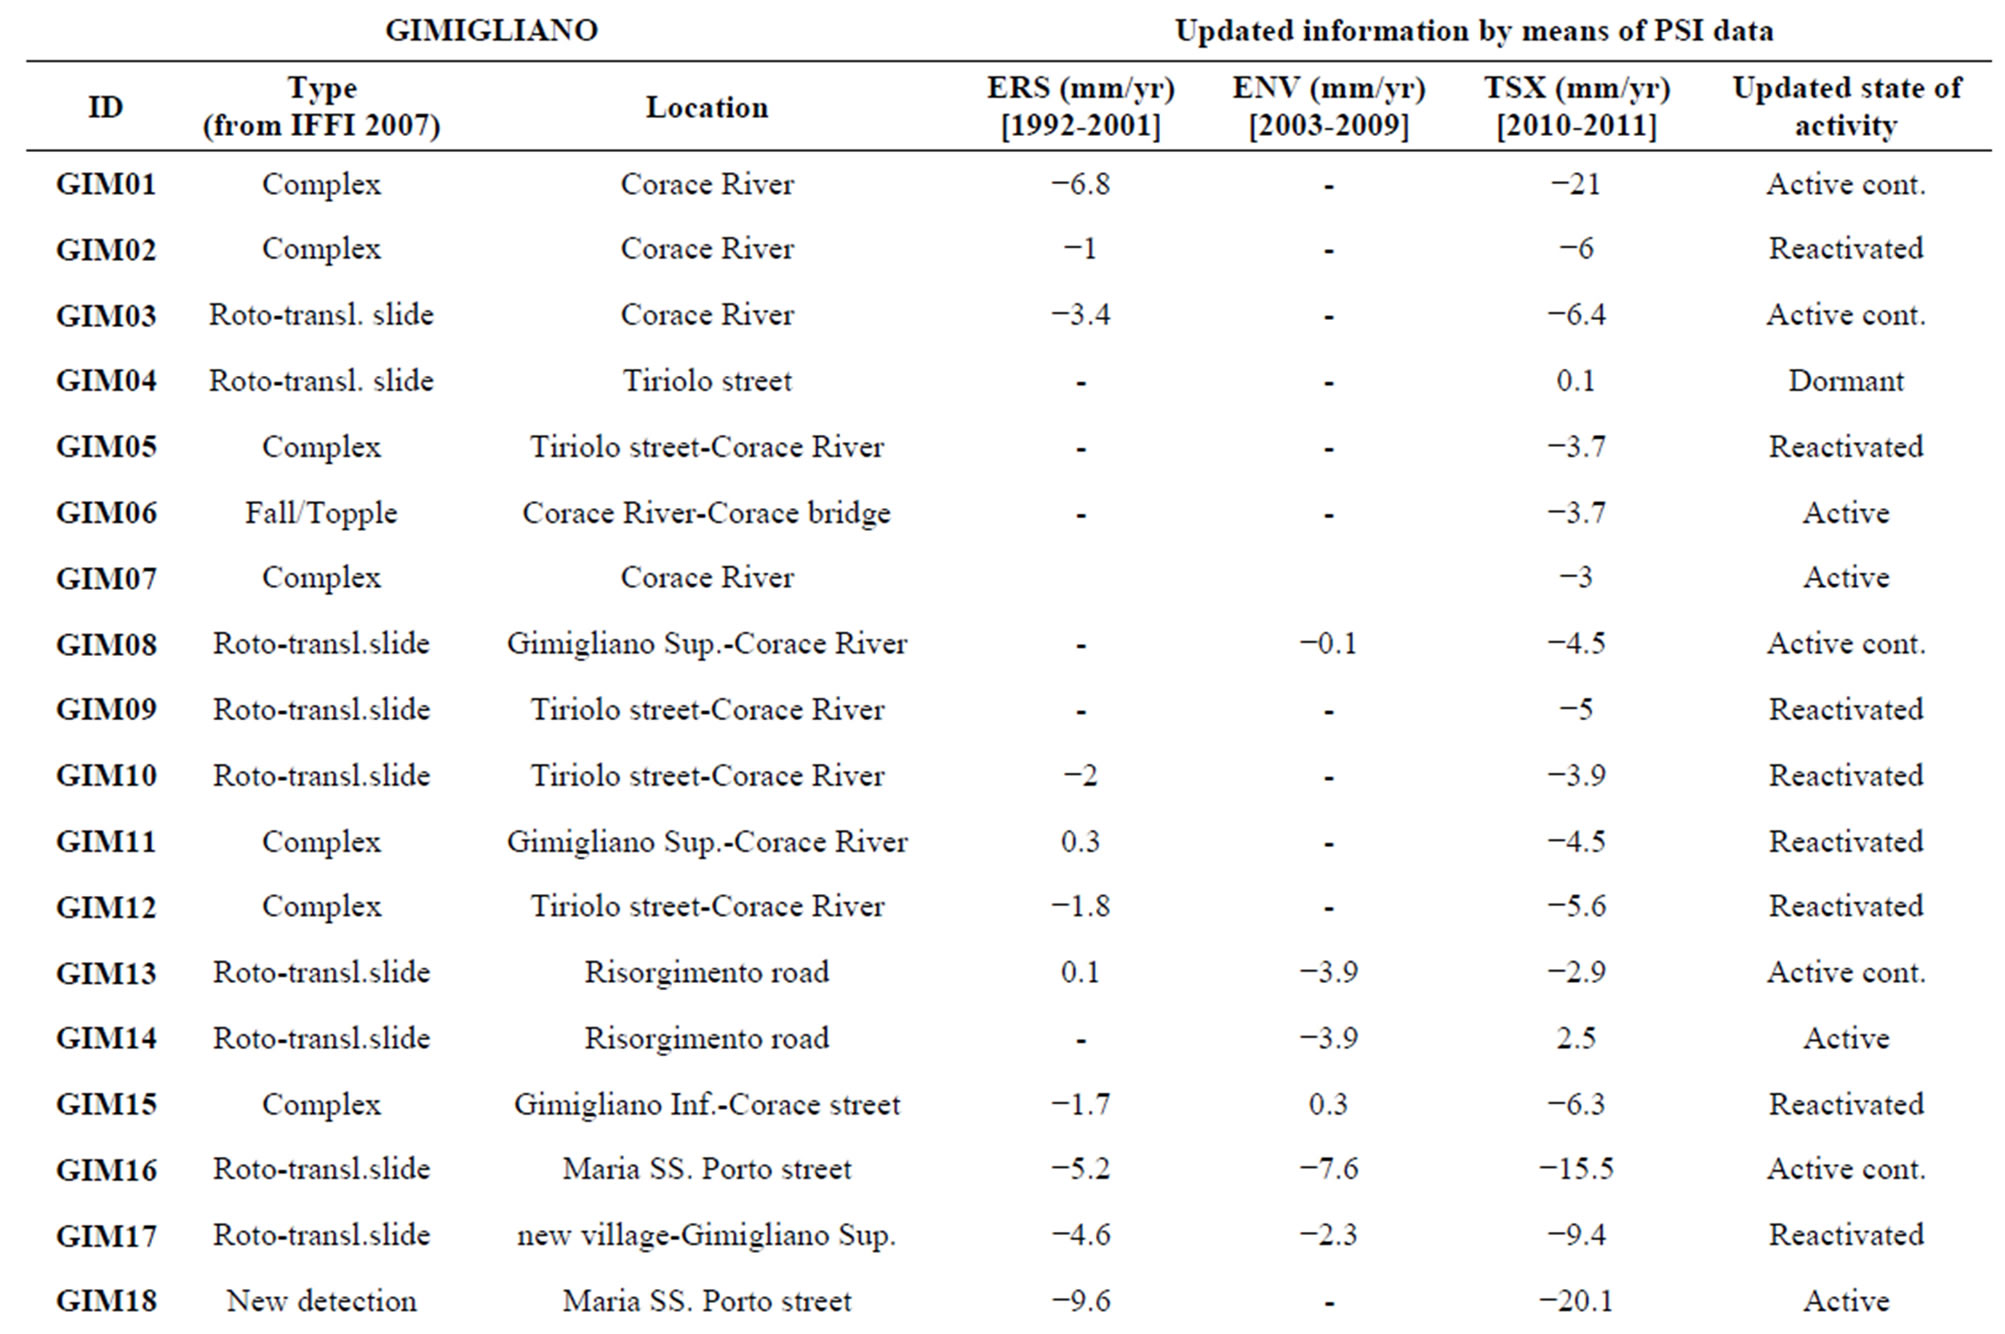
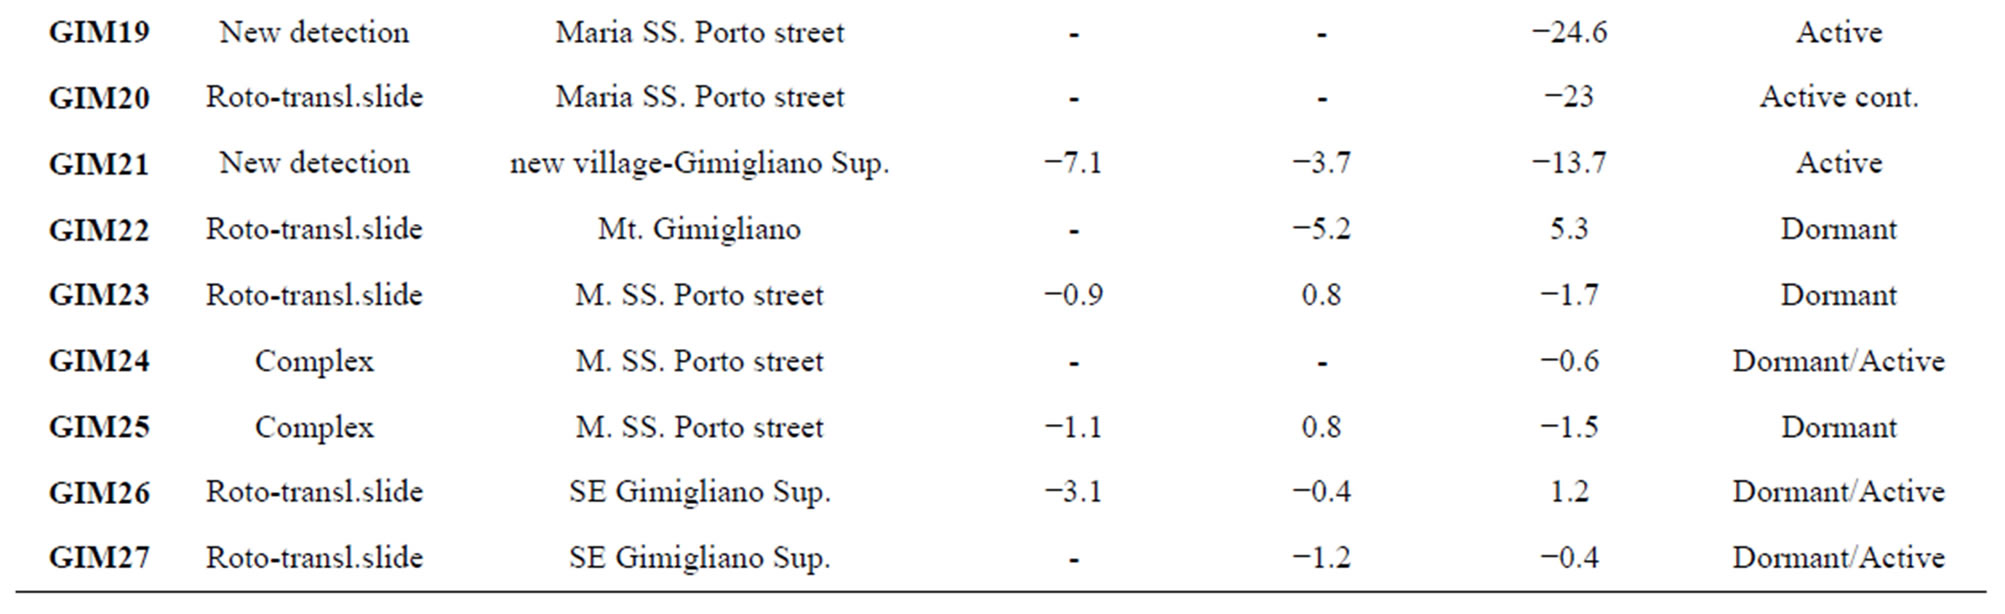
Table 1. Landslide database for Gimigliano site (Site 1).
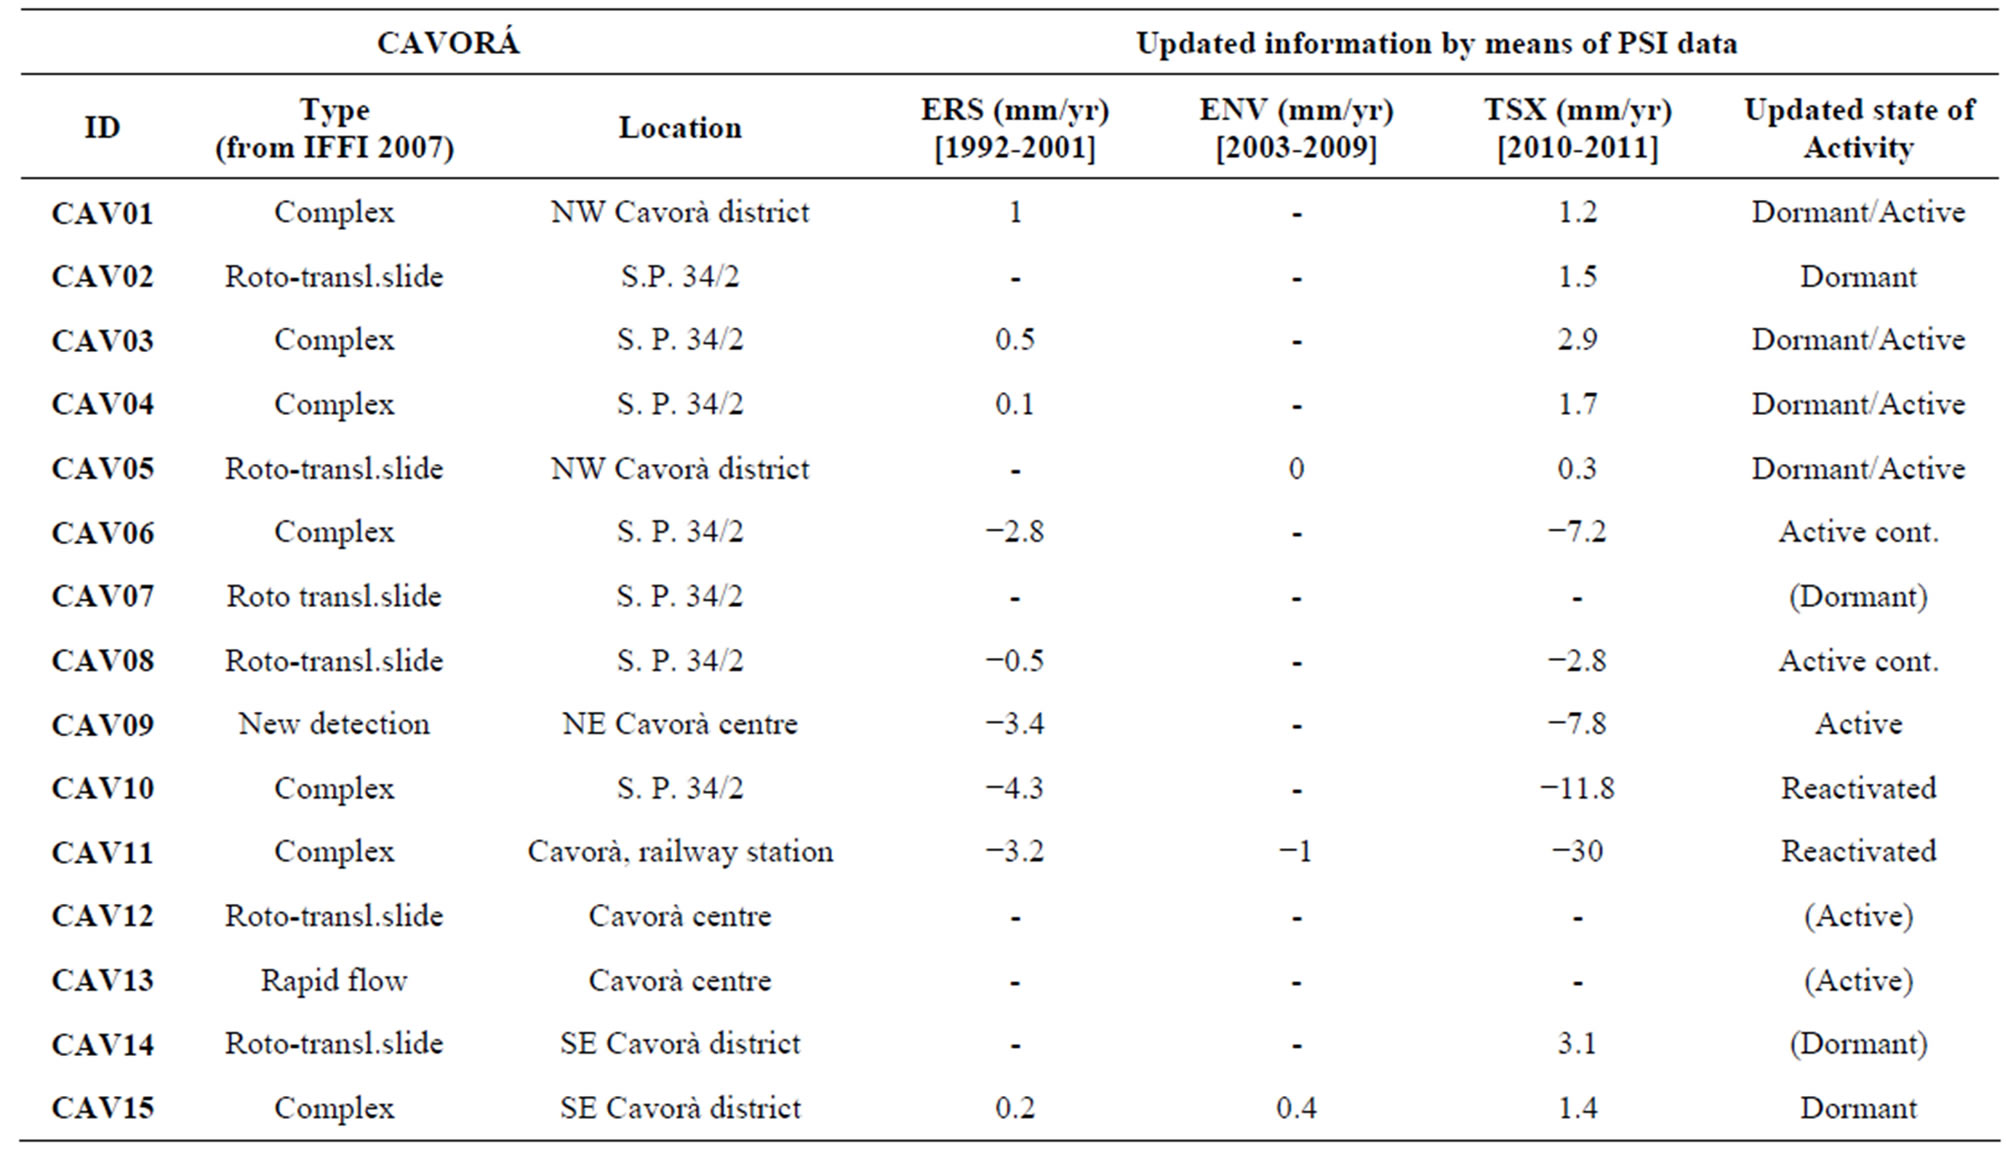
Table 2. Landslide database for Cavorà site (Site 2).
average displacement rate in mm/yr over the acquisition period was analyzed and, for selected points of higher interest, displacement time series were generated to be able to check and look into the evolution of deformational phenomena.
On the basis of PAI and IFFI landslide inventories, for each phenomenon, the determination of a representative ground velocity was performed, by calculating the mean annual velocity of all the PS identified within its boundaries.
Within Gimigliano town (Site 1), the PS analysis carried out on ERS data highlights that the modern downhill built-up area was affected by surface ground deformation since 1993 (Figure 6).
Moreover, PS ERS analysis also reveals the instability of the eastern part of old Gimigliano Superiore, confirming the presence of the active landslide (GIM16) already mapped in PAI database with a LOS deformation velocity of about −4.5 mm/yr, while the old urbanized centers of Gimigliano Superiore and Inferiore turn out to be stable.
Within Cavorà district (Site 2), the historical PS analysis evidences a ground deformation in 1993-2000, covering an area wider than the pre-mapped geometries, with average motion rate of about −6 mm/yr; most of the time series of selected point targets, located on the crowns of the mapped landslides, show linear motions in the direction away from the satellite sensor, with high velocity values up to −30 mm/yr (Figure 6).
Regarding the next period 2003-2009, landslide surface deformation was studied and back-monitored throughout PS analysis performed on ENVISAT data (Figure 7).
Within Gimigliano town (Site 1), the PS velocity map overlapped on orthophotos referred to 2006 and the related historical time series were analyzed; some PS of highest interest were selected within the main landslide phenomena. Active landslide (GIM16) affecting the eastern part of Gimigliano Superiore is confirmed to be moving, with average LOS velocities of about −7 mm/yr and downward motion temporal pattern up to −50 mm/yr since the first satellite acquisition on 4th May 2003.
The wide dormant landslide (GIM17) affecting the younger part of Gimigliano Superiore downhill also shows some portions affected by ground deformation in 2003- 2009.
The head of the landslide is characterized by mean rates of displacement ranging between −3 and −6 mm/yr; the main body involving the town appears to be almost stable with slight tendency to move. A cluster of some moving PS can be noticed in the south-eastern part of the built-up area, located on a steeper slope and characterized by higher velocity values of about −6 mm/yr. The old village of Gimigliano Inferiore exhibits green point targets with average velocities ranging ±1.50 mm/yr, hence it appears to be stable (Figure 7). Absence of PS data can be observed on the old village of Gimigliano Superiore; no PS benchmarks were neither retrieved
Figure 6. Historical scenario (1993-2000) within Gimigliano and Cavorà sites: PS ERS data and time series of some selected targets, overlapped on orthophoto Volo Italia (2000) and PAI landslide inventory (2001).
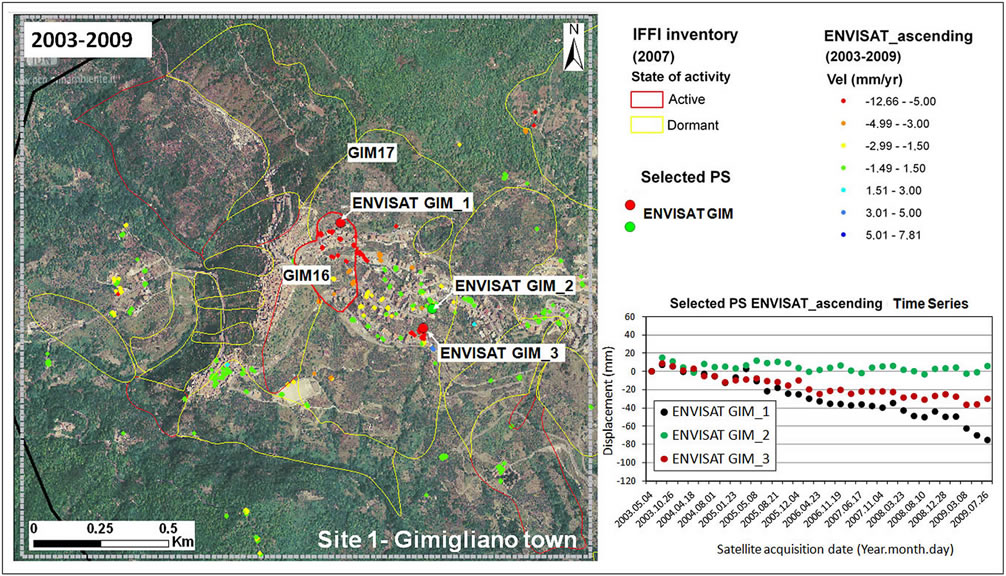
Figure 7. Historical scenario (2003-2009) within the Gimigliano site: PS ENVISAT data and time series of some selected targets, overlapped on orthophoto extracted from PST (2006) and IFFI landslide inventory (2007).
within landslides boundaries facing SW towards Corace river, avoiding the slope instability analysis of the zone in the years 2003-2009.
Unfortunately, no ENVISAT PS were detected in any of the mapped landslides in Cavorà district, because of the W-facing aspect of the slopes that are not properly visible by an ascending orbit sensor, preventing a backmonitoring in 2003-2009 time period of this site.
4.2. Updated Scenario
The present PS TerraSAR-X data and in situ observations permitted to accurately update the ground movements in the two selected sites. PSI analysis allowed a spatial and temporal detection of the landslides phenomena, leading to an updated scenario and new landslides inventory mapping up to 2011 (Figure 8).
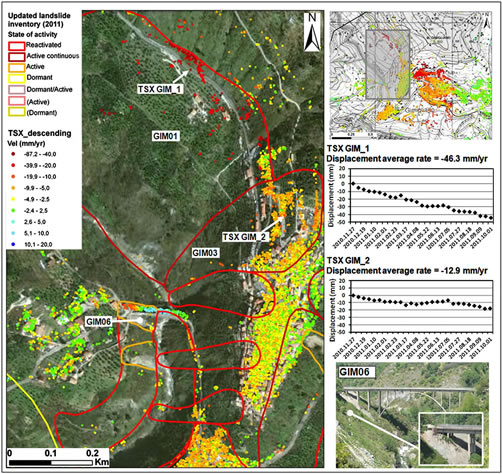
Figure 8. Updated scenario within Gimigliano town: landslide detection and mapping, sector NW, through TerraSAR-X PS data (2010-2011) and related time series.
Regarding the spatial detection, landslide boundaries of IFFI inventory were confirmed or modified (usually enlarged), throughout PS data and orthophotos analysis, that permitted to better trace the geometries of the unstable areas. Some not previously mapped phenomena were also detected. Among the total amount of the phenomena in the study area (42 landslides), 10 pre-mapped landslides were enlarged within their boundaries and 6 landslides were newly mapped (Tables 1 and 2).
Regarding the temporal detection, the PS annual average velocities and the PS deformation time series were in-depth studied and allowed defining a state of activity for each phenomenon, based on the information coming from the pre-existing landslide inventories (PAI and IFFI) and on recent and historical available radar ground displacement data.
In particular, once mapped the landslide spatial distribution, the state of activity assessment was performed through the determination of a representative ground velocity for each phenomenon. Representative velocity values were computed for each landslide by calculating the average annual velocity of all the PS identified within its boundaries, analyzing separately TerraSAR-X, ERS and ENVISAT data. Representative velocities are defined in terms of LOS deformation velocity (mm/yr) and referred to the different satellites temporal coverages.
Then, the representative velocities of each landslide were compared with a deformation threshold, which was chosen as 2.5 mm/yr for distinguishing moving from not moving areas. The resulting classification of the updated state of activity was based on the classification of the Multilingual Glossary for Landslides [24] and 7 classes were identified:
- Reactivated: within a pre-mapped dormant landslide, its “representative velocity value” based on PS TerraSAR-X data is higher than 2.5 mm/yr. It means that the landslide is now moving after being not moving.
- Active continuous: within a pre-mapped active landslide, its “representative velocity value” based on present PS TerraSAR-X data is higher than 2.5 mm/yr. It means that the landslide is still moving after being moving.
- Active: within a not previously mapped landslide, without any past information, its “representative velocity value” based on present PS TerraSAR-X data is higher than 2.5 mm/yr. It means that the landslide is moving.
- Dormant: within a pre-mapped dormant landslide or within a not previously mapped landslide, its “representative velocity value” based on present PS TerraSAR-X data is lower than 2.5 mm/yr. It means that the landslide is now not moving (but potentially moving) after being not moving, or without any past information.
- Dormant/active: within a pre-mapped active landslide, its “representative velocity value” based on present PS TerraSAR-X data is lower than 2.5 mm/yr. It means that PSI data registered slow or no movement,. Thus, the state of activity recorded in the pre-existing inventory should be lowered from active to dormant, but, following a cautelative statement, the double classification is temporarily preserved.
- (Dormant): within a pre-mapped dormant landslide, no sufficient PS data (insufficient number or complete absence of PS) are retrieved inside its boundaries, so the activity information of the pre-existing inventory is not changed.
- (Active): within a pre-mapped active landslide, no sufficient PS data (insufficient number or complete absence of PS) are retrieved inside its boundaries, so the activity information of the pre-existing inventory is not changed.
Within Site 1, the PS data distribution evidences that the maximum deformation velocities are recorded in the southwestern Mt. Gimigliano mountainside towards Corace river and in the southern side on old eastern built-up area of “Gimigliano Superiore” (Figures 8 and 9).
It can be observed that Gimigliano Inferiore village includes moving PS and appears to be slightly affected by ground movements that were not recorded in the previous time periods. The great majority of PS radar targets that fall in the old central part of Gimigliano Superiore village results to be almost stable, especially eastwards (Figure 8).
The whole Mt. Gimigliano southern mountainside, including the eastern uphill part of the old town along Maria SS Porto street and the new modern downhill part of Gimigliano Superiore, is extensively affected by high rates of ground motion; this area was already subjected to landsliding in the past, as recorded in the historical datasets and databases, and it is still characterized by increasing deformation up to nowadays.
Most of the mapped landslides show a tendency to move in 2010-2011 period and PS analysis allows reassessing their state of activity. In particular, the hill slope towards Corace River shows high yearly average LOS velocities of about −21 mm/yr within landslide GIM01 (Figure 9 and Table 1), with maximum deformation rates up to −40 mm from the first acquisition on 27th November 2010; the negative sign stands for an increasing distance with time from the TSX sensor and, given the descending LOS geometry and the general SW facing hill orientation, it evidences high downward movements along the slope and reveals the state of activity of the landslide which is still active (active continuous) (Figure 8). Two new movements (GIM06 and GIM07) occurred in winter 2010 and were mapped throughout photoand radar-interpretation within the complex failure on the slope on the western side of Corace River (Figure 8).
The eastern part of old Gimigliano Superiore uphill, along Maria SS Porto street, is affected by several landslide movements that show highest displacement rates up to −20 - 30 mm/yr (Figure 9). PS analysis, combined with survey and orthophoto observations, permitted to trace some new mass movements (GIM18 and GIM19) involving weathered greenschistes, fillads and clays derived from fillads weathering. The geometry of a previously mapped translational slide was extended (GIM20). The head and the accumulation zone of GIM16 landslide show displacement rates higher than −20 mm/year, especially in the latest acquisition months (September and October 2011), while the main body corresponding to the modern built-up village located in a gentle gradient, shows moving PS but with velocity lower than −20 mm/year. A shallow flow (GIM21) was detected, overlying the main landslide body, with a mean PS velocity of about −14 mm/year (Figure 9). The roto-translational landslide (GIM14) occurred in February 2010 on the E-facing rock escarpment, involving weathered serpentinites and greenschistes, above Risorgimento road below was mapped in the updated inventory, superimposed on the pre-existing active complex failure (GIM13) (Figure 9).
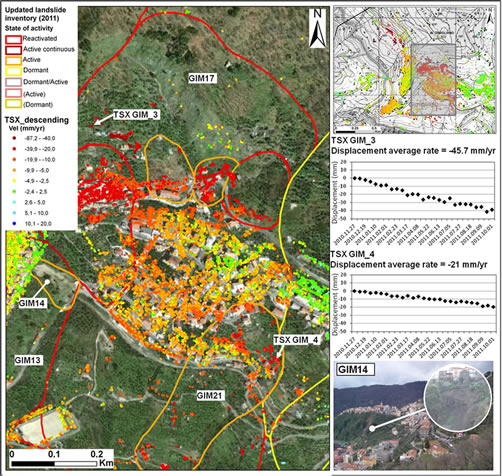
Figure 9. Updated scenario within Gimigliano town: landslide detection and mapping, sector NE, through TerraSAR-X PS data (2010-2011) and related time series.
Active slope movement along Mt. Gimigliano southern mountainside was identified: the wide landslide phenomenon (GIM17) affecting this area and including the whole new modern part of Gimigliano showed an average PS velocity value of −9 mm/yr and was re-evaluated from inactive to active phenomenon (reactivated).
Within Site 2, the distribution of PS deformation velocities shows that the hillslopes in the northern-western part of the selected area, appear to be quite stable. The W-facing mountainside towards the railway and the main road (S.P. 34/2) shows significant ground displacement with PS motion rates up to −30 mm/yr. PS data allow enlarging the pre-existing instability zone (CAV06) and also mapping a new unstable area (CAV09) (Table 2 and Figure 10). Relevant downslope displacements were observed through field checks and PS analysis, permitting to assess some landslide phenomena recorded in IFFI inventory in this area, modifying their boundaries and changing their state of activity from dormant to reactivated (CAV10 and CAV11). These landslide phenomena significantly involve the whole slope with mean velocity ranging −12 to −30 mm/yr. In particular, maximum deformation rates were recorded within the built-up area nearby the railway station and the S.P. 34/2. Focusing on this urbanized area, ground motion values were accurately studied.
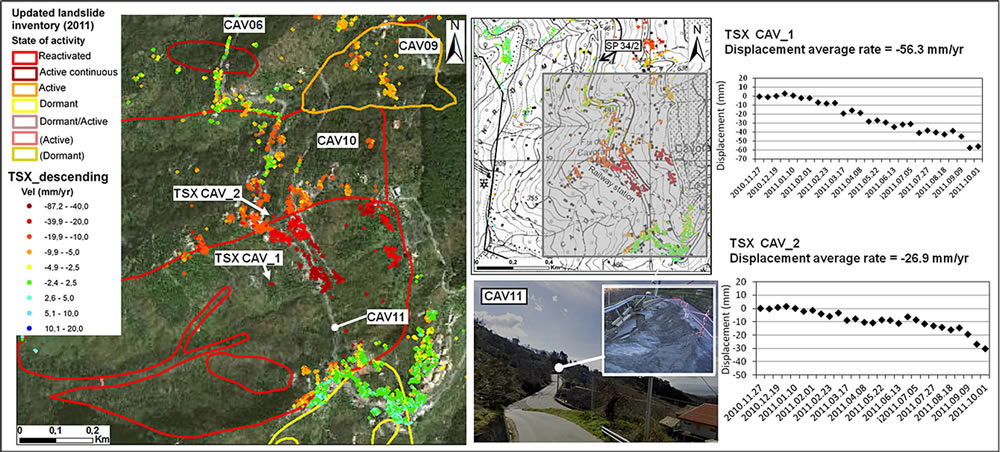
Figure 10. Updated scenario within Gimigliano town: landslide detection and mapping, sector NE, through TerraSAR-X PS data (2010-2011) and related time series.
Local slope failures are documented in the last years in the vicinity of the moving PS targets until March 2011. PS deformation time series in this area were studied and revealed a clear and progressive linear ground movement, starting just in February 2011, when the most recent landslide event occurred. PS LOS rates are −30 mm/yr up to −70 mm/yr over the radar coverage period and progressively raise from February 2011 until the last acquisition (October 2011), hence the landslide (CAV11) was evaluated as reactivated (Figure 10).
5. Discussion
PS data allowed mapping and carefully measuring present and historical ground in the two selected sites motions until today, and therefore obtaining a spatial and temporal evolution of the investigated landslide phenomena.
Within Site 1, PS data highlight that the maximum deformation velocities are recorded in the southernwestern Mt. Gimigliano mountainside towards Corace River, with LOS rates up to −40 mm/yr, and in the eastern part of Gimigliano Superiore old village, with mean displacement velocity reaching up values of −30 mm/yr in the radar coverage period (Figure 11). A high instability phenomenon was also detected in the modern built-up sector of Gimigliano Superiore, where a wide landslide affecting the whole area turned out to be reactivated, with average velocity of about −9 mm/yr. Thus, ground deformations in this downhill new urban area were already observed in the historical scenario since 1993 to 2000 by means of ERS data, while they were thought to be almost stable in the period 2003-2009 throughout ENVISAT data. A significant and higher land motion in the Gimigliano modern area is furthermore revealed in the present scenario 2010-2011 through TerraSAR-X data.
This increase could be determined by the rock weathering of the outcropping sedimentary and metamorphic litotypes across time; alternatively, it could be even caused by the expanding load, sediment compaction and erosion due to urban construction that can result in an increase of runoff weight volumes and durations, as well as in a change of overall groundwater balance. However, this work is not accomplished to determine how amount of the detected ground motion can be attributed to the loading sediment and hydro-modification impacts due to urbanization or to other deformation triggering factors. Moreover, it is worth to highlight that X-band recent data are more accurate than past C-band ones to detect a greater and localized number of ground motions thanks to higher targets density and higher resolution and temporal sampling, hence present deformation are better identified.
Within Site 2, the area characterized by the highest PS velocities is close to the built-up area around the railway station where local slope movements occurred in the past latest years, wreaking the road network with extensive road cracks (Figure 11).
The mean yearly PS velocities range from −30 to −60 mm/yr over the satellite coverage period and progressively increases until October 2011, demonstrating that the landslide phenomenon is still active and the ground movement is dangerously raising with deformation rates up to −70 mm/yr.
The application of the PSI analysis in the Gimigliano
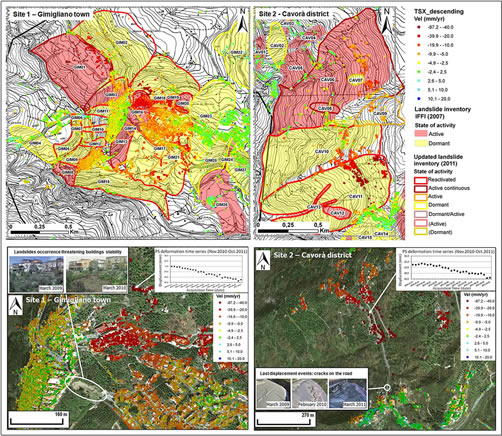
Figure 11. Final outcomes: updated landslide scenario in Site 1(left) and in Site 2 (right).
area confirms its high capability for detecting and mapping ground deformations at local scale, in synergy with conventional geo-morphological analysis and in situ surveys. PS data enable a detailed study of the spatial and temporal evolution of ground movements in the study area up to nowadays.
A great amount of TerraSAR-X PS was identified in the Gimigliano area, corresponding to a very high spatial density of measurements. Significant differences can be observed when comparing the number and the density of detected Cand X-band PS datasets.
The PS number and spatial density obtained from TerraSAR-X dataset are significantly higher than the ones of ERS and ENVISAT datasets. It can also been observed that TerraSAR-X results show higher deformation rates than those of ERS and ENVISAT: X-band PS targets with deformation greater than ±2.5 mm/year are 68% of the total, while 10% - 30% for the C-band PS. This is due to the shorter TerraSAR-X monitoring period (only 10 months) and to the shorter temporal sampling (11 days in respect to 35 days), enabling the detection of more coherent pixels that show displacements; the same pixels would not be detected over a longer monitoring period because the coherence would be lost.
PSI application to landslide studies shows intrinsically some constraints. In this work, the two main disadvantages were a spatial facet related to the combination of the local slope characteristics with the satellite acquisition parameters, and a temporal constraint related to the signal decorrelation problems.
Regarding the spatial feature, vegetation and topography introduce a limitation in the number and reliability of detected scattering points and consequently for carrying out PSI analysis; vegetation prevents many radar benchmarks to be retrieved. Moreover, slope orientation and inclination with respect to the LOS direction mainly control the performance of PSI analysis since the slope visibility depends on the availability of the satellite orbit.
For instance, ENVISAT images were available only in ascending mode, so no PS were retrieved on unstable slopes in Cavorà district, because of their W-facing aspect that is not suitably detectable by an ascending pass. TerraSAR-X data were acquired in descending passes that are well suitable for W-facing slopes, but no PS were identified on some E-oriented slopes, i.e. the slope above Risorgimento road, which would have been interesting and necessary to monitor since a catastrophic landslide event occurred in March 2010.
Regarding the temporal feature, the potential of TerraSAR-X data for deformation measurements benefits from high resolution, which allows detecting higher deformation gradients compared to the other satellite sensors that operate in C-band. However, the shorter revisiting time of 11 days only partially compensates the higher temporal decorrelation in vegetated areas and the atmospheric delay features take a greater portion of the X-band. Thus, decorrelation noises from vegetation and atmospheric effects are of greater importance in X-band, because of the shorter signal wavelength and shorter repeat cycle.
Moreover, due to the phase ambiguity of SAR data processing and satellite acquisition parameters in both Cand X-band, the PSI analysis of landslides is limited to phenomena ranging from “extremely slow” (velocity < 16 mm/yr) to “very slow” (16 mm/yr < velocity < 1.6 m/yr), according to the velocity classification of [21].
Another key point of ground displacement detection throughout PSI analysis is the choice of the range of PS rates in respect to mass movement identification. Within the PS velocity, a stable threshold range of ±2.5 mm/yr (away or toward the satellite direction) was fixed for classifying PS rates and for distinguishing moving from not moving areas. On one hand, the boundaries of the velocity color classes were fixed not to be excessively large compared to the distribution of velocity values, in order to prevent most radar targets to fall into the stable class; on the other hand, the range intervals must be chosen to be not too narrow because the width of velocity classes can be reduced to facilitate the identification of more detailed spatial variations of the landslide phenomena, but it cannot fall below the resolution of the technique. Therefore, the movement threshold of ±2.5 mm/yr is assumed as a good conservative rate of the average deformation [25]; the choice of this velocity threshold strictly depends on the typology of detected phenomena, which are slow-moving, mainly roto-translational and complex landslides, and on the PSI technique precision, taking into account the acquisition in X-band and in a short time interval.
6. Conclusions
The approach of this paper aims at exploiting PSI analysis of X-band SAR data for landslide detecting and monitoring over a small area across time.
The outcomes of this work represent a valuable example of landslide multi-temporal detection and characterization by PSI analysis at local scale. In particular, using and integrating different interferometric and geo-morphological data referred to different time intervals, it was possible to reconstruct the dynamic of the area of interest and to provide estimates of the mean yearly velocities since 1992 up to nowadays.
PSI analysis in Gimigliano area was focused on two sites, Gimigliano town and Cavorà district, which showed the highest displacement rates within the present TerraSAR-X PS datastack.
PS interpretation allowed us detecting and monitoring landslide-induced phenomena and providing an updated scenario up to 2011 within the two selected sites.
The applied approach demonstrated to have a successful operative usefulness to support landslide hazard and risk assessment, since PSI technique has the potential to work in synergy with conventional geo-morphological tools and to improve the quality and the temporal reference of pre-existing landslide inventories.
7. Acknowledgements
This work was carried out within the SAFER (Services and Applications For Emergency Response) project, funded by the EC-GMES-FP7 initiative (grant agreement n˚218802). TerraSAR-X images, as well as ERS and ENVISAT PSI products, were processed and provided by e-GEOS. Field information was partly derived from the report required by the Task Force of UNICAL (University of Calabria)-Landslides Emergency within Gimigliano Municipality.
NOTES