An Electromyography-Based System for Measuring the Flavor Detection Time in Healthy Adults ()
1. Introduction
The initial stage of food ingestion is likely to be critical for flavor detection (taste, odor, and their combination) due to the following two factors: 1) adaptation of the sensory receptors involved and 2) habituation of the detection mechanisms in the central nervous mechanisms [1, 2]. Previous studies used fluids and vapors to measure simple taste and olfactory reaction times, respectively, and these studies very precisely examined the detection time for tastes and odors (or flavor) [1]: e.g., in healthy adults, the simple reaction time in response to the taste stimuli from fluids ranges from 400 to 800 ms [3] and that for odor stimuli from vapors ranges from 1.36 to 1.74 s [1]. However, these measuring systems are not applicable to solid and semi-solid foods. Another study used time-intensity (T-I) analysis not only for fluids and vapors but also for solid and semi-solid foods to understand the entire temporal process of changes in the perceived intensities of taste, odor, and/or flavor of foods from the start to the end of ingestion (e.g., [4]). In contrast to the studies on simple reaction time, the T-I analysis does not generally consider the detection time for food flavors. The present study aimed to develop a measuring system that connects the measurements of the two conventional systems to detect flavor in solid and semi-solid foods. The present measuring system uses an electromyogram (EMG) of the masticatory muscles as an indicator of the start of chewing.
2. Materials and Methods
2.1. Participants
Twelve healthy young adults (seven males and five females, 21.7 ± 1.27 years old) participated in this study after providing informed consent. The Ethics Committee of The University of Niigata Rehabilitation Graduate School approved the experiments.
2.2. Test Foods
Three gummy candies (GC; Meiji Co., Ltd, Tokyo, Japan) with different fruit flavors (apple, grape, and pineapple) served as the test foods in the present study. The shape and size, including the dimensions, of the candies were basically similar: their approximate height, width, and thickness were 9.5 mm × 23.6 mm × 15.0 mm, respectively. Each test food was wrapped with a wafer paper (Kokko oblaat Co., Ltd, Shizuoka, Japan) to prevent direct contact between the food and the oral tissues before the start of chewing.
2.3. Procedures
All 12 participants except one were right-handed. Two of the participants used the left side as their habitual working side during chewing. Each participant was asked to rinse his/her mouth with water and to sit comfortably on a chair.
Surface electromyograms (EMGs) were recorded from the masseter (Mass) muscles on both sides with two pairs of adhesive electrodes (Ambu Inc., Blue Sensor, Maryland, USA), which were attached to the skin just above the Mass. The Mass EMG signals were amplified, filtered (bandwidth, 15 Hz-3 kHz), fully rectified, and stored on a digital recorder (Kyowa Electronic Instruments Co. Ltd., Tokyo, Japan, EDS-450A). Two pressing buttons, one in each hand, were held by each participant, and the buttons were connected to the recorder through a battery. After the test food was delivered, the participant activated one button for flavor detection and the other for flavor recognition; only the signal for flavor detection was analyzed in the present study.
One of the three GCs was delivered as a test food to each participant in a random order. Prior to the delivery, no information about the test foods, including their taste, odor, and flavor, was provided to the participants. Each participant was asked to ingest the wrapped test foods and to hold it between the molars on his/her habitual chewing side until the delivery of a command for the start of chewing. The participant was also asked press the button with the hand instructed by the experimenter as soon as possible when he/she detected any flavor of the delivered test food. Each experimental session consisted of three trials with at least 4 min between the trials.
2.4. Data and Statistical Analyses
As depicted in Figure 1, an interval was measured from the start of burst in the Mass EMG (i.e., the start of chewing) on the habitual working side to the rise of the detection signal. This interval should correspond to the time for to detect the flavor of the delivered test food.
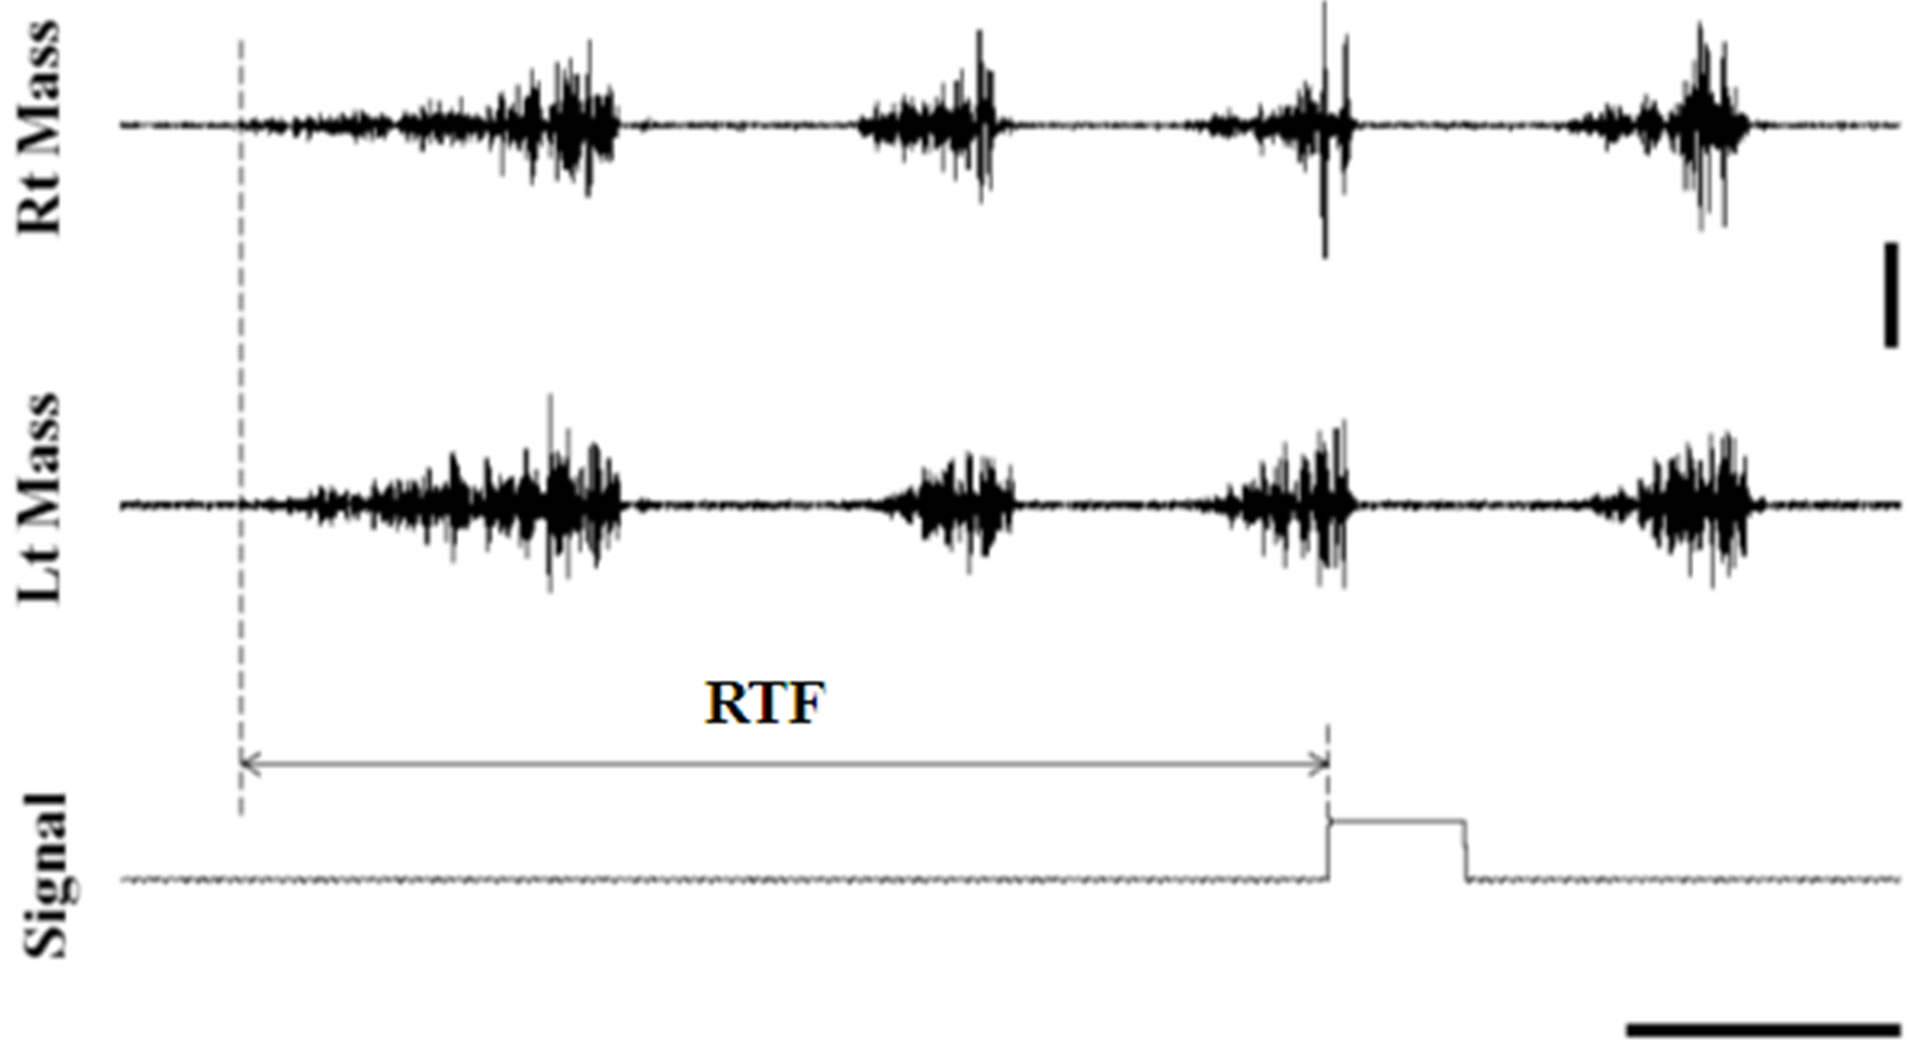
Figure 1. Sample data for explanation of the reaction time measurement. The two upper traces depict the sequences of masseter activities during the chewing of a pineapple-flavored gummy candy in a male participant, while the two lower traces depict the electrical signals, indicating the time at detection. Rt Mass and Lt Mass: surface electromyograms recorded from the masseter muscles on the right (Rt) and left (Lt) sides of the participant, respectively. The vertical and horizontal lines on the right side show 1.0 mV and 0.5 s, respectively. See the text for details.
Two-way analysis of variance (ANOVA) followed by the Tukey-Kramer test were used for statistical examination, and P < 0.05 was considered significant.
3. Results
Figure 1 depicts a sample record from the start of chewing to the signal for flavor detection with the pineappleflavored GC. The Mass EMGs of both sides burst almost simultaneously after the command signal was given to start chewing. The interval between the start of the burst and the detection signal was considered the “reaction time to flavor (RTF)”. Figure 2 shows the average RTF for the three tested GCs and for both sexes. The average RTF for the lemon-flavored GC was the shortest for both sexes, while the RTFs for the grape-flavored and pineapple-flavored GCs were the longest in male and female participants, respectively. However, two-way ANOVA found no significant differences in the average RTF between the three GCs or between the sexes.