Effect of Y on the Properties of Sm-Doped Ceria for IT-SOFC Applications ()
1. Introduction
Solid oxide fuel cells (SOFCs) convert chemical energy directly into electrical energy with high efficiency, environmental friendliness, and great flexibility in the choice of fuel [1-3]. Electrolytes used for SOFCs are usually the main components determining the performance of the fuel cell. Yttria stabilized zirconia (YSZ) is the well-established electrolyte, which can be used in commercial SOFCs. A typical high-temperature of SOFC uses 8 mole% YSZ as the electrolyte, usually operated at temperatures as high as 800˚C - 1000˚C to obtain the required level of ionic conductivity. However, such high operating temperatures result in expensive fabrication costs and accelerate the degradation of fuel cell systems. Therefore, strong motivation to search for new, improved oxide-ion electrolytes at intermediate temperatures (400˚C - 700˚C) persists. Lowering the operating temperature to an intermediate temperature (400˚C - 700˚C) significantly enhances the long-term performance stability, lessens sealing problem, widens the material selection, and allows the use of low-cost metallic interconnects, thereby accelerating the commercialization of SOFC technology [2]. Doped ceria has been acknowledged as a potential electrolyte material for IT-SOFCs because of their high ionic conductivity and good compatibility with electrodes [4- 6].
The ionic conductivities of ceria-based electrolytes doped with various dopants (e.g., Sm3+, Gd3+, Y3+, Pr3+, Ca2+, Sr2+) at different dopant concentrations have been extensively investigated [7-13]. Sm3+ is considered as one of the best dopants for ceria-based solid electrolytes currently available [14-16]. The co-doping technique has been the effective method for improving the conductivity and leads to thermal expansion match between the electrodes and electrolyte in ceria-based electrolytes for the IT-SOFCs [6].
In the present work, we have selected Sm3+ and Y3+ as co-dopants as general composition formula Ce0.8-xYxSm0.2O2-δ (x = 0, 0.02, 0.04, 0.06). In order to develop intermediate temperature, electrolyte materials for SOFC are prepared and characterized. In the view of the above, the effect on the thermal and electrical properties of Y co-doped ceria in comparison with samariumdoped ceria (Ce0.8Sm0.2O2-δ) is to be studied.
2. Experimental
The samples with the general formula Ce0.8-xYxSm0.2O2-δ (0 ≤ x ≤ 0.06) were synthesized by sol-gel method. The resultant powder was ground to get a fine homogeneous powder and the powder was calcined at 600˚C for 2 hours. The calcined powers were pressed into pellets and finally sintered in air at 1300˚C for 4 hours. Phase identification and lattice parameters of the samples were obtained from the X-ray data by using PANalytical X’Pert Pro X-ray diffractometer (XRD) with Cu Kα radiation (λ = 1.54056 Å, operated at 40 kV and 30 mA) at room temperature in the range 20˚ ≤ 2θ ≤ 80˚. The Thermal expansion measurements were carried out with Netzsch DIL 402 PC dilatometer. Thermal expansion coefficient (TEC) of the sintered pellets were measured using a constant heating rate of 3˚C/min in the temperature range 30˚C - 1000˚C. The impedance measurements were done by AUTOLAB PGSTAT 30 Frequency Response Analyzer (FRA) in the frequency range 100 Hz to 106 Hz and in the temperature range 30˚C - 450˚C.
3. Results and Discussion
3.1. X-Ray Diffraction
The X-ray diffraction patterns of the prepared system Ce0.8-xYxSm0.2O2-δ (0 ≤ x ≤ 0.06) are shown in Figure 1. Yttrium as co-dopant into samarium doped ceria (SDC) ceramics show cubic fluorite structure with space group . The lattice parameters agree with the reported values (JCPDS powder diffraction File no. 34-394). The crystallite sizes of the as prepared samples are calculated using Scherrer formula and are in the range 34 - 49 nm. The introduction of Y3+ into Ce4+ can cause a small shift in the ceria peaks. This shift is indicative of a change in the lattice parameter. The lattice parameter is increased with an increase of Y content due to the difference in ionic radii of Ce4+ (0.96 Å) and Y3+ (1.02 Å) in solid solution [17]. As yttrium content increases, the lattice parameter increases and this indicates that Y has been dissolved into Ce site in Ce0.8-xYxSm0.2O2-δ and single phase structure is formed.
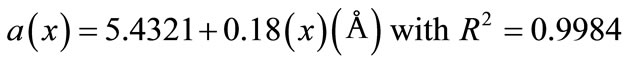
Figure 2 shows the dependence of a lattice parameter as function of dopant concentration of Y3+ ions. As the Y content increases, the following expression gives a linear relation between “a” and “x” for Ce0.8-xYxSm0.2O2-δ (0 ≤ x ≤ 0.06) system.
 (1)
(1)
This linear variation indicates the validity of the Vegard’s law for investigated system.
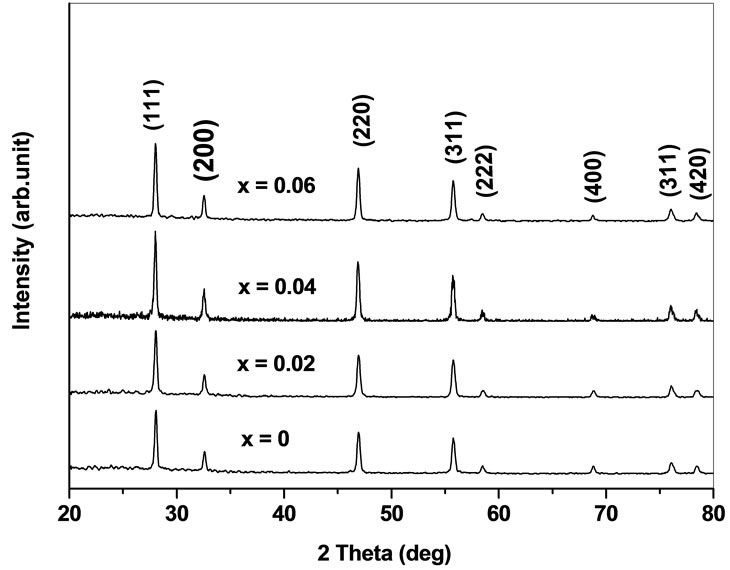
Figure 1. XRD patterns of Ce0.8-xYxSm0.2O2-δ (x = 0, 0.02, 0.04, 0.06).

Figure 2. Lattice parameter of Ce0.8-xYxSm0.2O2-δ as a function of dopant x.
3.2. Thermal Expansion
Figure 3 shows the thermal expansion curves of Ce0.8-xYxSm0.2O2-δ (0 ≤ x ≤ 0.06) obtained in the temperature range from room temperature to1000˚C.
A linear variation of dl/l is observed and there are two slopes in the expansion curves. The temperature at which change slope occurs is called onset temperature. For the present system of samples the onset temperature is located approximately in between 375˚C to 475˚C. The slope of the curves tends to decrease with increasing Yttrium doping as expected in case of oxide materials. The thermal expansion coefficients (TEC) are calculated from the expansion curves.
3.3. Impedance Analysis
The impedance data are obtained for all the samples in the range from room temperature to 450˚C and in the frequency range 100 Hz - 106 Hz. In the present study,

Figure 3. Temperature variation of thermal expansion of Ce0.8-xYxSm0.2O2-δ (0 ≤ x ≤ 0.06).
the impedance data of Ce0.8-xYxSm0.2O2-δ analyzed using Cole-Cole plots of real (Z') and imaginary (Z'') parts of impedance (Figure 4) [18].
The inverse of peak frequency as a function of temperature where peak is observed in frequency explicit plots is shown as logτ versus 1000/T in Figure 5" target="_self"> Figure 5. The straight-line behaviour of this graph indicates the thermally active dipoles which are responsible for observed peaks in Frequency vs. Z″ plots (not shown here). The relaxation time of dipoles decreases with increase in temperature. The calculated activation energies for relaxation are in the range 1.19 - 1.28 eV (Table 1). The small activation energy for relaxation indicates the presence of relatively simple mobile charged defects [19].
The complex impedance plots of present system (Figure 4) do not show semicircles up to 250˚C but as the temperature increases the curves attain greater curvature and become perfect semicircles at and above 300˚C. All these plots terminate at the origin indicating the presence of very small series resistance in the equivalent circuit model of the sample. All the semicircles start on the real impedance axis at the lowest frequency and radius of the circle is found to decrease with increase in the temperature. This behavior of Cole-Cole plots is characteristic of the conducting nature of the samples and hence it may be concluded that there is no series capacitance in the equivalent circuit representation of the sample. The relaxation time of the relaxing species was decreased with increase of temperature as borne out by frequency explicit plots.
Low-frequency intercepts of the semicircle of ColeCole plots (Figure 4) on real axis give the resistance of the sample at the temperature of the plots. The conductivity of all the samples are calculated from these intercepts and plotted as a function of inverse of temperature on semi log scale (Figure 6). The activation energies of

Table 1. Activation energy of Ce0.8-xYxSm0.2O2-δ (0 ≤ x ≤ 0.06).

Figure 5. Relaxation time versus inverse of temperature for Ce0.8-xYxSm0.2O2-δ (x = 0, 0.02, 0.04, 0.06).
conductivity from these plots are in the range 1.05 - 1.21 eV. This is observed to be very close to the activation energy of relaxation in the range 1.19 - 1.28 eV (Table 1). It is indicates that the presence of attractive interaction between dopant cations and oxygen vacancies. The decrease in activation energy indicates that some defect association taking place, inhibiting the ability of oxygen vacancies to migrate to enhance the conductivity [5,20].
The conductivity σ, is calculated from low frequency intercepts of the semicircle of Cole-Cole plots (Equation (2)). The activation energy for conduction is obtained by plotting the conductivity data in the Arrhenius relation (Equation (3)) for thermally activated conduction.
 (2)
(2)
 (3)
(3)
The number of oxygen vacancies increases with increasing dopant concentration (x = 2 to 6 mole%) resulting in decrease of the activation energy of conduction and increase of the ionic conductivity of the co-doped ceria [21-23].
Figure 7 shows constant phase element (CPE) equivalent circuit is used to fit impedance data of Ce0.74Y0.06Sm0.2O2-δ at 450˚C. Complete semi-circle clearly seen, high frequency depressed arc corresponds to grain resistance (Rb). Grain resistance arc is well-resolved at 450˚C. The equivalent circuit (Figure 7) is

Figure 6. Conductivity plots versus inverse temperature for Ce0.8-xYxSm0.2O2-δ (x = 0, 0.02, 0.04, 0.06).

Figure 7. Equivalent circuit fit for impedance data of Ce0.74Y0.06Sm0.2O2-δ at 450˚C.
used to fit the impedance data and to calculate grain resistance (Rb) [24,25].
4. Conclusion
The co-doped ceria-based materials were prepared through sol-gel method. It was found that the doped ceria powders are in single phase with fluorite structure. The unit cell parameter is increased with increasing yttrium content. The slope of the thermal expansion curves is decreased with increasing the yttrium content at high temperatures. Impedance measurements indicate presence of thermally active unassociated defects which show non-Debye type ralaxations. The activation energy decreases with increasing the Y content into Sm-doped ceria. The lower activation energy for 6 mole% of Y implies an increase in the mobility of oxygen vacancies. It can be caused by the enhancing of the ionic conductivity. This composition is thus a possible candidate for use the electrolyte in intermediate temperature solid oxide fuel cells (ITSOFC).
NOTES