Comparative analysis of bed density, total phenol content and protein expression pattern in Posidonia oceanica (L.) Delile ()
1. INTRODUCTION
Posidonia oceanica (L.) Delile seagrass forms meadows which are widely recognized as key ecosystems in coastal habitats of the Mediterranean Sea [1]. Many authors have reported a regression of P. oceanica meadows, primarily due to human-induced disturbances [2-7]; as a consequence, several traditional, biochemical and molecular descriptors have been developed and applied to obtaining an integrated picture of their response to disturbances [8-14].
Plants under stressed conditions usually activate a series of physiological responses to minimize damage [15]. The numerous compounds that plants produce during their adaptive responses may be used as biomarkers. The relationship between phenol content and disturbance has been previously observed in several Posidonia meadows exposed to different environmental pressures, e.g., turbidity and pollution [12,13,16], ocean acidification [17, 18], competition with invasive seaweed [19], and metal contamination [20].
Plant stress response and acclimation to stress are dynamic processes, mediated by profound changes in plant metabolism which are also mirrored at the proteomic level [21]. The proteomic approach, based on two dimensional electrophoresis (2-DE), permits the comparative analysis of quantitative and qualitative changes in protein expression patterns. The comparison of proteomic maps has been applied to several marine organisms to assess changes in protein profiles in response to different environmental conditions [22-27]. Differential protein expression analysis is commonly used to point out differences between proteomes of non-stressed (control) plants and those of stressed plants [21]. We previously observed a relationship between phenol content and protein expression patterns in P. oceanica rhizomes under different stress conditions [16].
Here, we present a comparative analysis of bed density, total phenol content and protein expression pattern to assess the conservation status of Posidonia meadows.
2. MATERIAL AND METHODS
2.1. Study Site and Sampling
The study was conducted on the Santa Marinella (Rome, Italy) P. oceanica meadow, a Site of Community Importance (according to Habitat Directive 92/43/EEC). The main features and conservation status of the meadow and impacts along the sea stretch have been previously described [12]. The meadow was surveyed from 2005 to 2009.
For this study, P. oceanica plants were sampled by SCUBA divers at 20 stations in 2008 and 2009. The coordinates, depth and substratum of each sampling station are reported in Table 1.
A random sampling design was used; at least 3 orthotropic shoots were collected from each station. Immediately after sampling, plants were washed with distilled water and rhizomes cleaned with a blade to remove sheets and cortical tissues. Clean rhizomes were frozen

Table 1. Coordinates, depth and substratum (M = matte; S = sand) of each sampling station in the P. oceanica meadow of Santa Marinella (Rome, Italy).
in liquid nitrogen and then stored at −80˚C until processing.
2.2. Bed Density
During the five-year survey (2005-2009), bed density was evaluated in situ by counting the number of shoots using 40 × 40 cm standard quadrats and recording five measurements at each station. The values obtained are reported as number of shoots/square meter (m2).
2.3. Total Phenol Content
Total phenols were quantified in rhizomes from the three orthotropic shoots sampled at each site, according to Migliore et al. [16]. Two extractions were done for each sample, and all the extracts were read in duplicate. Final results were expressed as milligrams of phenolic compounds per gram of rhizome fresh weight, and they are the arithmetic means of four measurements. Based on their phenol concentration and total protein content (determined by the Bradford assay), four shoots from each sampling year (2008 and 2009) were chosen for protein expression pattern analysis. The selected shoots were those with the highest (2 shoots) and the lowest (2 shoots) phenol content in the basal portion of the rhizome. Only shoots yielding comparable amounts of total proteins were selected.
Statistical Analysis
For density and total phenol content, the differences among years were analysed through ANOVA. Levene’s test was used for testing the homogeneity of group variances and post-hoc comparisons of means were performed through Tukey’s test. Kruskall-Wallis ANOVA multiple comparison test and Mann-Whitney U test were used when data did not satisfy the homoscedasticity assumptions (Levene’s test).
2.4. Protein Analysis by 2-DE
For each annual batch, 250 mg of the basal rhizome section from the four selected shoots were used for protein extraction. Total proteins were extracted according to Wang et al. [28], as modified for P. oceanica rhizomes [16], and protein concentration was determined by the Bradford assay (Biorad). Protein samples (12 μg) were applied in 155 μl of 2-DE rehydration solution (8 M Urea, 2 M Thiourea, 2% CHAPS, 50 mM DTT, 0.2% Anfoline (Bio-Lyte BIORAD), protease and phosphatase inhibitors (SIGMA) to 7 cm Readystrip IPG (Immobilized pH Gradient, pH 3-10NL, Bio-Rad Laboratories), by incubating overnight. Isoelectrofocusing (IEF) was performed at room temperature using the ZOOM IPG Runner™ Mini-cell (Invitrogen), applying 175 V for 15 min, 175 - 2000 V for 45 min and 2000 V for 30 min. Focused strips were equilibrated using DTT and iodoacetamide solutions and subjected to protein separation by second dimension electrophoresis.
Electrophoresis was performed using Precast Gradient Gels (NuPAGE 4% - 12% acrylamide, Life Technologies) at 80 V in running Buffer MOPS-SDS 1X, according to standard procedures. Proteome isoelectric point (pI) markers were from SERVA Electrophoresis (Heidelberg), and molecular weight (MW) markers were from New England Biolabs. Each protein sample was subjected to at least 2 parallel runs of isolectrofocusing and second dimension electrophoretic separation to assess proteomic pattern reproducibility. Protein spots were visualized by acidic silver staining.
Image Processing and Data Analysis
Gel scan images were acquired, generating 6.2 Mb Tiff format images, then imported into the PDQuest 2-D Analysis Software (Biorad, version 8.0.1).
Spots were automatically detected on the basis of prechosen spot parameters, such as the faintest, the smallest and the largest spot. Other parameters (such as sensitivity, minimal peak value, size scale) were adjusted and background noise subtracted to selectively identify true spots. To attribute pI and relative molecular weight (MW), a mixture of five proteins of known identity was used as an internal standard.
In order to detect proteins selectively expressed in high-phenol and low-phenol plants, a comparative analysis was performed using PDQuest Analysis Software: two low-phenol and two high-phenol gel scans per year were matched. Only well-resolved spots were taken into account, discarding streaked and edge areas. Only the spots present in the gels of one set but absent from the other were taken into account and regarded as specific. All spots were considered and double-checked for accuracy.
3. RESULTS
3.1. Bed Density
The bed density in the S. Marinella meadow from 2005 to 2009 is reported in Figure 1 as a box plot; mean values (±S.D.) varied between 367.1 ± 110.3 (2005) and 281.6 ± 76.6 and 283.8 ± 105.2 shoots/m2 (2007 and 2009, respectively). The Kruskall-Wallis test for independent variables did not highlight differences among years (not significant, n.s.). Nevertheless, the box plots show 1) a clear increase of the interquartile range (IQR, i.e., the difference between the upper and lower quartiles), except in 2007, and 2) a reduction of the maximum bed density in the meadow (Q4, i.e., the highest density value registered each year among all the sam-

Figure 1. Bed density in the S. Marinella P. oceanica meadow from 2005 to 2009, represented as box-plots. The box plot contains 50% data (the extremes of the box are the Q1 and Q3, 1st and 3rd quartiles), the internal horizontal segments represent the median of the distributions (Q2 value, 2nd quartile), “whiskers” range from the lowest to the highest value; the interquartile range value is reported (IQR = Q3 − Q1) on the top of each box-plot.
pling stations).
3.2. Total Phenol Content
The mean total phenol content in the P. oceanica rhizomes collected in 2008 and 2009 was 27.6 ± 5.4 mg/g and 28.4 ± 4.6 mg/g, respectively. The mean phenol content in each rhizome section is reported in Table 2. The differences between the two years and among rhizome sections were not statistically significant (two-way ANOVA, n.s.).
3.3. Protein Analysis by 2-D Electrophoresis
The expression pattern of P. oceanica rhizomes from the 2008 and 2009 samples was obtained by 2-D electrophoresis. Two representative 2-D gels from low and high phenols are shown in Figure 2. Protein maps showed a similar spatial arrangement of protein spots and a comparable total number of spots (495 in 2008 and 472 in 2009). Furthermore, computer-assisted analysis of the 2-D gel profile confirmed the presence of protein spots which were exclusively expressed in the plants with the higher or lower phenol contents. A total of nine specific spots were found in the high phenol plants in both 2008 and 2009; four and six specific spots were found in the low phenol plants in 2008 and 2009, respectively (Table 3).
4. DISCUSSION
In the present study, the bed density, total phenol content and protein expression pattern were evaluated in P. oceanica plants from the S. Marinella meadow. The role and interaction of the different descriptors are discussed below.
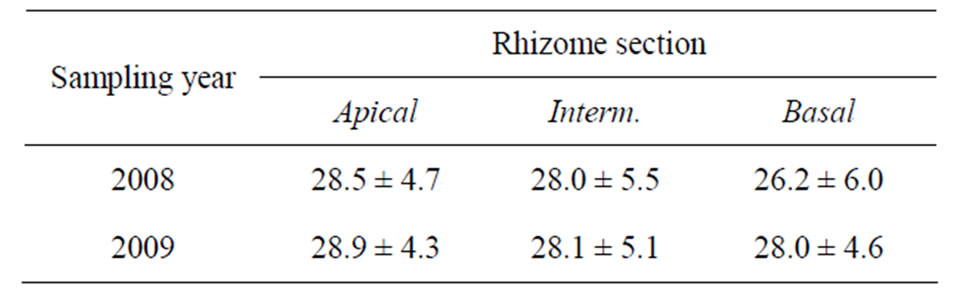
Table 2. Mean (±S.D.) phenol content in P. oceanica rhizome sections of plants collected in 2008 and 2009. Phenol content is expressed as mg/g fresh weight (f.w.).


Table 3. Specific protein spots identified in the 2-DE maps of lowand high-phenol P. oceanica rhizomes, collected in 2008 and 2009. The experimental values of isoelectric point (pI) and molecular weight (MW) were calculated using the PDQuest 2-D Analysis Software.
4.1. Bed Density and Total Phenol Content
During the five-year survey, the mean bed density fluctuated between “sparse bed” and “very sparse bed”, according to Giraud [29] as modified by Pergent et al. [30]. Due to the high variability of density values in both time and space, no significant regressive trend can be inferred. However, the increase of the spatial variability and the gradual decrease in maximum bed density during the 2005-2009 period are indications of the regressive process. In fact, an increasing patchiness of the meadow is a common feature of the regressive process in Posidonia meadows [31]. This reflects the frequency and magnitude of disturbances which are factors preventing seagrasses from reaching their maximum potential abundance [32].
The total phenol content in P. oceanica rhizomes did not show significant variations between the two years. Values are far higher than those previously found in the S. Marinella meadows since 2004 [12,16]. Putting together these total phenol content data, an increasing trend over time (2005-2009) can be highlighted. When the mean total phenol content is plotted against the maximum bed density from 2005 to 2009, an inverse relationship between these two descriptors is clearly found (Figure 3).
The relationship between phenol content and stressful conditions has been previously shown in seagrasses [12, 13,16,18-20,33]. Thus, the inverse relationship between total phenol content and maximum bed density in the S. Marinella meadow strongly supports the hypothesis of the ongoing regressive process in this meadow. The meadow regression can be partially related to the increasing environmental pressure on this stretch of sea which has occurred in recent years [34].
4.2. Protein Analysis by 2-DE and Total Phenol Content
The expression pattern of P. oceanica rhizomes from the 2008 and 2009 samples is comparable in terms of total spot number and the number of spots exclusively expressed in plants with higher or lower phenol contents. When compared to 2006 samples [16], the 2008-2009 protein maps show similar total spot number and spatial arrangement. However, there is an evident difference between the 2006 and 2008-2009 protein expression profiles: the number of differentially expressed proteins is dramatically reduced in the 2008-2009 samples (Table 4).
As the increase in phenol content marks the stressful condition and the reduction of the conservation status of the S. Marinella meadow [12], the lower variability observed in protein expression could be related to plant stress response.
Thus, the differentially expressed proteins can be po-

Figure 2. Representative 2-DE gels from P. oceanica plants with low (A) or high (B) total phenol content (2009 samples). Each specific protein spot exclusively expressed in the low or high phenol samples is highlighted with green or red ellipses and labeled (L# or H# according to Table 2).

Figure 3. Relationship between total phenol content and maximum shoot density in S. Marinella P. oceanica meadow from 2005 to 2009 (error bars indicate standard deviation). The significant correlation appears linear (r = −0.99, p (uncorr) < 0.01).

Table 4. Comparison of protein expression pattern analyses performed on 2006, 2008 and 2009 P. oceanica rhizomes (basal section). For each year, the number of total and differentially expressed spots and maximum and minimum phenol content recorded in rhizomes are reported.
tential protein biomarkers of stress and/or health conditions of P. oceanica meadows. Further investigations can significantly contribute to their identification and characterization.
In conclusion, this study contributes towards the setting up of a multidisciplinary approach for seagrass monitoring. The punctual response of total phenol to stress conditions supports its feasibility as an early warning indicator. Furthermore, the study of plant response to stress at the protein level can significantly improve our understanding of the physiological mechanisms underlying plant stress response and/or tolerance.
The set up of novel (possibly early-warning) indicators of seagrass health is necessary to prevent further seagrass loss. The proteomic approach could help to identify potential protein biomarkers of stress and/or healthy conditions in P. oceanica meadows.
To date, the ecological status of P. oceanica has usually been assessed by quantifying shoot densities, biomass or growth rates; however, these descriptors cannot fully describe the plant physiology and/or predict the persistence of seagrass meadows. The use of biochemical/protein markers may improve meadow monitoring and reduce costly and time consuming field activities.
5. ACKNOWLEDGEMENTS
Special thanks are due to Patrizia Rubino for her excellent technical assistance and to Flora Carannante for her support in the sampling activities. The authors are also grateful to Richard Burket and Astrid Mejia, who kindly revised and edited the manuscript.
This work was supported by the Consiglio Nazionale delle Ricerche/Ministero dell’Università e Ricerca (National Research Council/Ministry of University and Research). This work was also supported by an RFO (Ricerca Fondamentale Orientata) grant from the University of Tor Vergata to LM.