Reaction in situ found in the synthesis of a series of lanthanide sulfate complexes and investigation on their structure, spectra and catalytic activity ()
1. INTRODUCTION
Metal-organic frameworks (MOFs) [1], as a relatively new class of crystalline coordination polymers, have in the past decades become one of the fastest growing fields in chemistry, which is due to the significance both in academia and industry not only for their structural varieties but also for their fascinating potential applications as functional crystalline materials, including gas storage, carbon dioxide capture and renewable catalysts [2-10]. Compared with transition metal, lanthanide-organic frameworks (LMOFs) possess more unique advantages because of the better optics and magnetism characters from the lanthanide themselves and more coordination numbers which is due to the larger radii of the lanthanide atoms [11-16]. In addition, the selection and accommodation of ligands play a key role for the construction of LMOFs, and therefore, mixed organic ligands, particularly in rigid-flexible ligands, have been proven to be effective and useful to enrich the varieties of lanthanide-organic frameworks because of their specific features: 1) Rigid ligands play important roles in constructing a stable framework and enhance the fluorescence emissions of complexes; 2) The rotation of the flexible ligands increases the variety of configurations of the coordination polymers [17-33].
As we know, a great number of examples about lanthanide-organic framework with rigid aromatic multicarboxylate have been reported, such as benzoic acid [34,35], 1,2-benzene dicarboxylic acid (o-H2BDC) [36], 1,3-benzene dicarboxylic acid (m-H2BDC) [37,38], 1,4- benzene dicarboxylic acid (p-H2BDC) [39,40], benzene-1,3,5-tricarboxylic acid (H3BTC) [41], and 1,2,4,5- benzenetetracarboxylic acid (H4BTEC) [42,43]. However, ligands with the interesting functional sulfonic group to construct lanthanide complexes have been rarely explored and only the complexes [Eu(p-Tos) (H2O)7][p-Tos]2 (H2O)2 (p-Tos = Toluene-4-sulfonate) [44]; [Ln2(ad)2.5 (BSA)(H2O)2]n (Ln = Sm, Nd; H2ad = adipic acid; BAS = benzenesulfonate) [45]; [Eu(BSA)(glu)(H2O)2]·H2O (Ln = Eu, Sm, Ce, Pr, Nd; H2glu = glutaric acid, HBSA = benzene sulfonic acid); Ln(SSA)(H2O)2 (SSA = 5-sulfosalicylic acid, Ln = Ce, Pr, Nd and Dy) [46]; and [Ln(SSA)(H2O)2]n·nH2O (SSA = 5-sulfosalicylic acid, Ln = Gd, Sm, Nd, Tb, Eu, Yb and Dy) [47] appear in the present literatures. 5-sulfosalicylic acid, possessing three potential coordinating groups, -COOH, -SO3H and -OH, can act as the preferential ligand of the lanthanide complexes [48-51]. In addition, although a number of the lanthanide complexes with flexible linkers have been reported, complexes with aliphatic diacid with more than ten carbon atoms have never been reported [52].
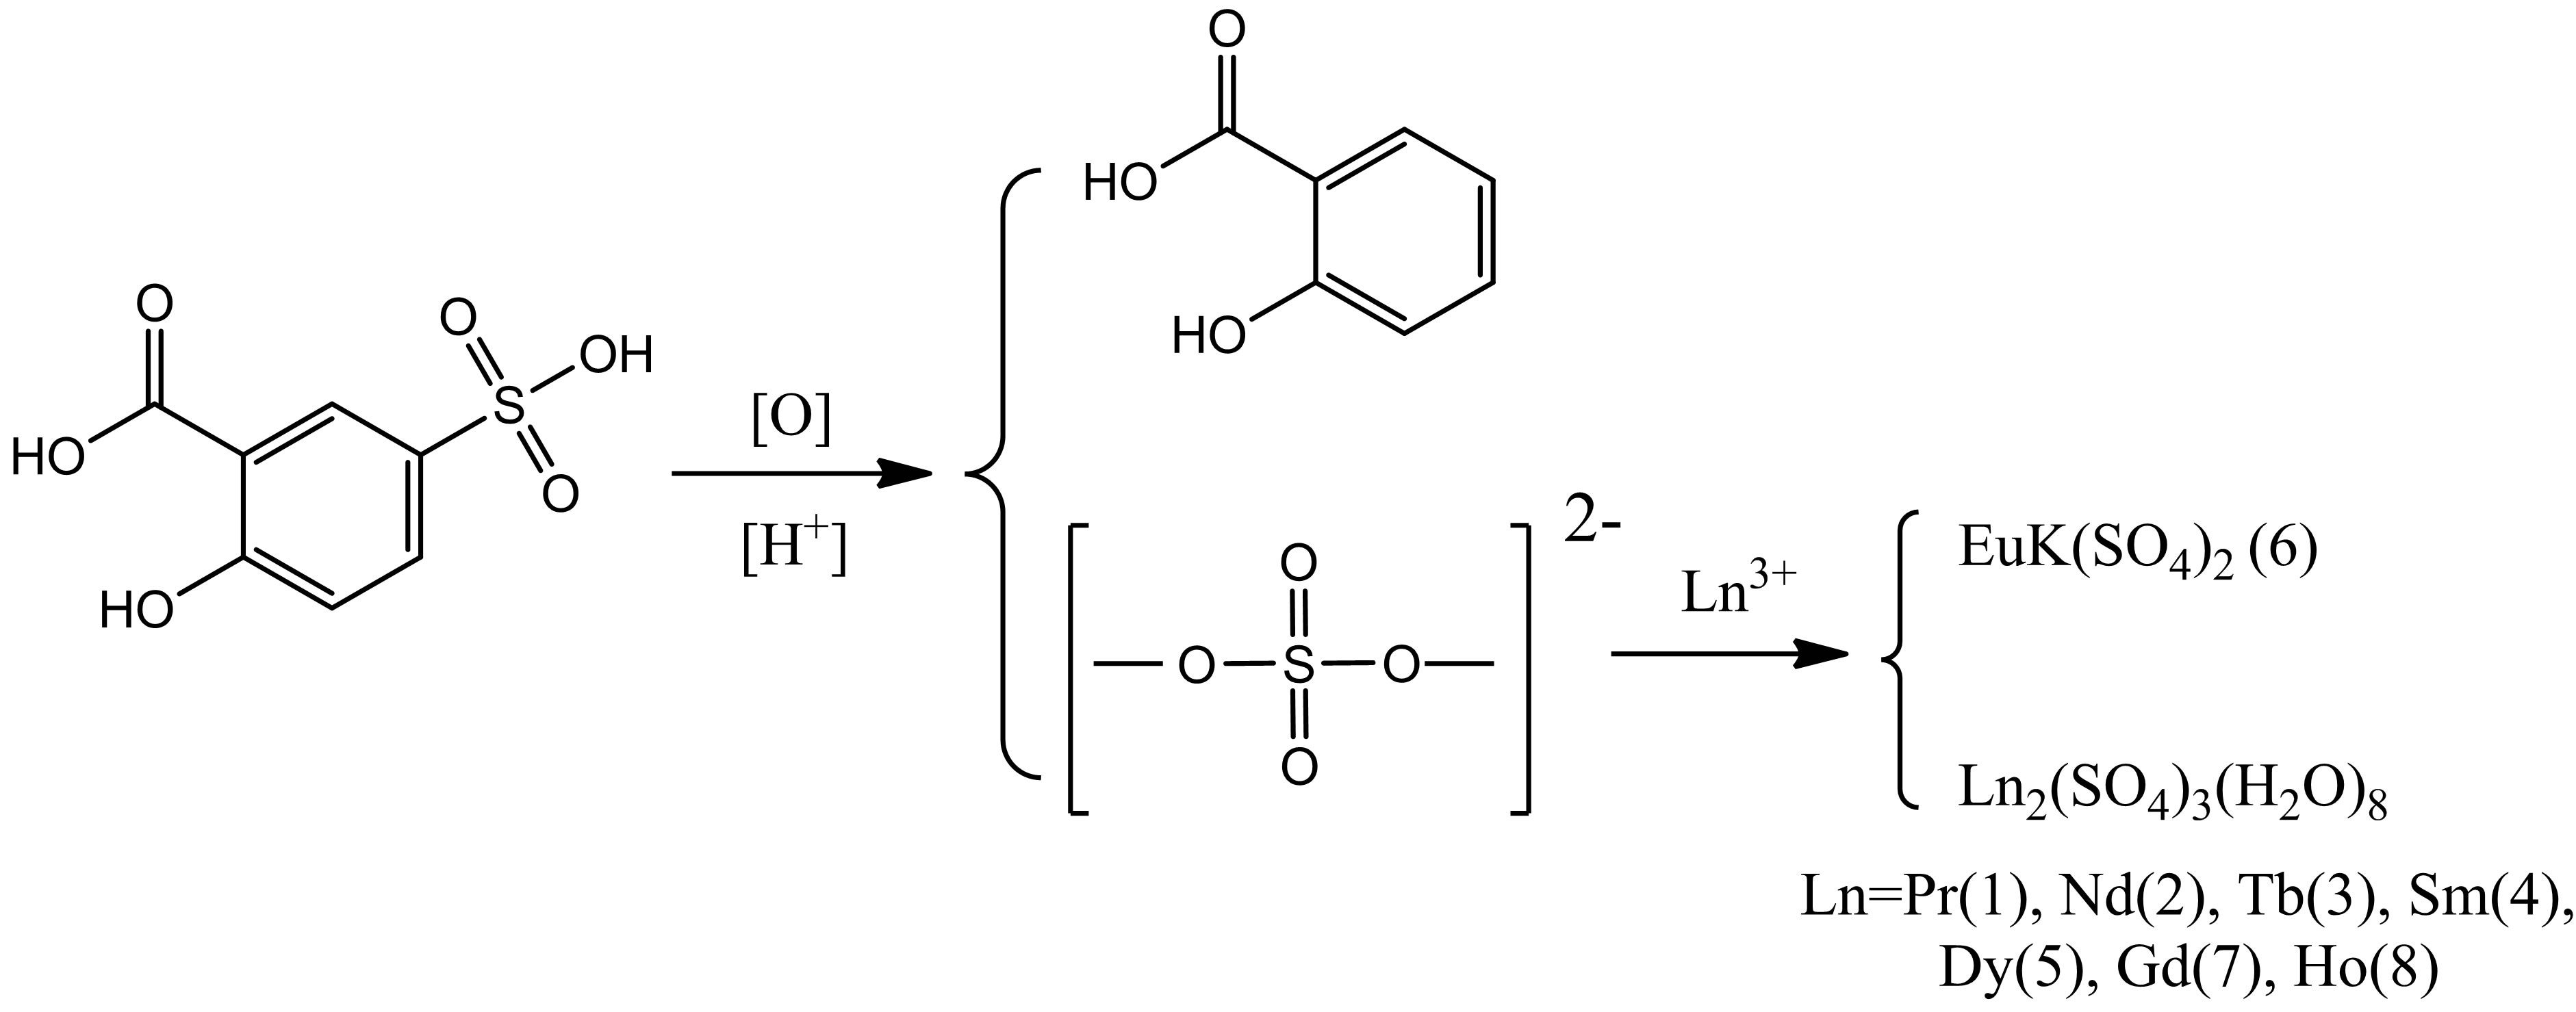
Therefore, in our previous work, we selected 5-sulfosalicylic acid and at the same time chose dodecanedioic acid in synthesizing the rigid-flexible lanthanide coordination polymers. Nevertheless, it is not predictable at all to receive the established products, but surprising that there exist two kinds of 2-D or 3-D lanthanide sulfates after the hydrothermal reaction when these two different acids and lanthanide chloride were dissolved in water/ethanol system, and the resultant reaction has never before been reported. Although there are a great number of reports on organic amine template complexes of the lanthanide sulfates, they generally used lanthanide sulfates as the starting material and employed a special organic amine as the structure-directing agent (SDA) or the pH-adjusting agent [53-56]. Hence, one recognizes that organic amine was directly inserted into the structure of the product, and inevitably, as a result, it is hard to produce some single sulfato lanthanide complexes. Moreover, reports on a series of complexes of lanthanide sulfates are very few. Recently, we used a reaction in situ to synthesize a series of the sulfato lanthanide complexes, Ln2(SO4)3(H2O)8 (Ln=Pr(1), Nd(2), Tb(3), Sm(4), Dy(5), Gd(7), Ho(8)), EuK(SO4)2 (6) (shown in Scheme 1).
2. EXPERIMENTAL SECTION
2.1. Materials and Methods
All chemicals purchased were of reagent grade or better and were used without further purification. Lanthanide chloride salts were prepared via dissolving 10 g praseodymium oxides with 100 ml 12 M HCl and then evaporating at 100˚C until the crystal film formed. The infrared spectra were recorded on a JASCO FT/IR-480 PLUS Fourier Transform spectrometer with pressed KBr pellets in the range 400 - 4000 cm−1. The luminescence spectra were reported on F-7000 FL Spectrophotometer (200 - 800 nm). The elemental analyses were carried out on a Perkin Elmer 240C automatic analyzer. Lanthanide con-

Scheme 1 . Synthesis method of complexes 1 - 8.
tents were analyzed on a Plasma-Spec(I)-AES model ICP spectrometer. X-ray powder diffraction (XRD) data were collected on a Bruker Advance-D8 with Cu-Ka radiation, in the range 5˚ < 2q < 60˚, with a step size of 0.02˚ (2q) and an acquisition time of 2 s per step.
2.2. Synthesis of the Complexes
[Pr2(SO4)3(H2O)8] (1). Complexes 1 were prepared by hydrothermal reaction. In a typical synthesis, solution I was prepared by dissolving PrCl3·6H2O (0.107 g, 0.3 mmol) and 5-sulfosalicylic acid (0.076 g, 0.30 mmol) into 5.0 ml ethanol under stirring for 1 - 2 h, dodecanedioic acid (0.069 g, 0.3 mmol) was added to 5.0 ml ethanol to make solutionⅡ. 5.0 ml deionized water was added after solutionⅠwas mixed with solution II under stirring for a minimum of 1-2 h. Then, one drop of saturated KOH (aq) was added into the mixture solution under stirring. The final mixture was transferred to a 25 ml Teflon-lined stainless steel vessel under autogenous pressure and heated at 160˚C for 3 days. Colorless single crystals of 1 for X-ray diffraction analysis were obtained in ca. 74% yield based on Pr(III) after two weeks. Elemental analysis for H16O20S3Pr2 (Mr = 714.16), calcd: Pr, 39.46; H, 2.26%. Found: Pr, 39.41; H, 2.50%. IR data (KBr pellet, n[cm–1]): 3450.51 (s), 2923.64 (w), 2855.35 (w), 1637.26 (s), 1123.90 (s), 980.17 (w), 651.43 (m), 597.03 (m).
[Nd2(SO4)3(H2O)8] (2). This complex was synthesized by a procedure similar to that used for 1 but changing the PrCl3×6H2O to NdCl3×6H2O (0.108 g, 0.30 mmol), purple crystals of 2 were obtained in ca. 69% yield based on Nd (III). Elemental analysis for H16O20S3Nd2 (Mr = 720.82): Nd: 40.02; H, 2.24%. Found: Nd: 40.00; H, 2.36%. IR data (KBr pellet, n [cm−1]): 3423.01(s), 1642.38 (s), 1130.83 (s), 998.28 (w), 658.03 (m), 599.73 (m).
[Tb2(SO4)3(H2O)8] (3). This complex was synthesized by a procedure similar to that used for 1 but changing the PrCl3×6H2O to TbCl3×6H2O (0.112 g, 0.30 mmol), colorless crystals of 3 were obtained in ca. 78% yield based on Tb(III). Elemental Anal. Calc. for H16O20S3Tb2 (Mr = 750.20): Tb, 42.37; H, 2.15%. Found: Tb, 42.31; H, 2.42%. IR data (KBr pellet, m[cm−1]): 3487.70 (s), 3371.48 (s), 1642.38 (s), 1143.62 (s), 1092.09 (s), 1001.07 (m), 806.98 (w), 606.12 (s), 489.52 (s), 424.82 (w).
[Sm2(SO4)3(H2O)8] (4). This complex was synthesized by a procedure similar to that used for 1 but changing the PrCl3×6H2O to SmCl3×6H2O (0.109 g, 0.30 mmol), primrose yellow crystals of 4 were obtained in ca. 76% yield based on Sm (III). Elemental analysis for H16O20S3Sm2 (Mr = 733.06): Sm, 41.02; H, 2.20%. Found: Sm, 39.96; H, 2.51%. IR data (KBr pellet, n [cm−1]): 3448.96 (s), 1642.38 (s), 1124.44 (s), 1007.84 (w), 651.64 (w), 599.73 (s), 489.52 (w).
[Dy2(SO4)3(H2O)8] (5). This complex was synthesized by a procedure similar to that used for 1 but changing the PrCl3×6H2O to DyCl3×6H2O (0.113 g, 0.30 mmol), colorless crystals of 5 were obtained in ca. 71% yield based on Dy (III). Elemental analysis for H16O20S3Dy2 (Mr = 757.34): Dy, 42.91; H, 2.13%. Found: Dy, 42.83; H, 2.16%. IR data (KBr pellet, n [cm−1]): 3481.31 (s), 3371.48 (s), 3235.32 (m), 1642.38 (s), 1150.02 (w), 1198.49 (s) , 1001.07 (s), 813.37 (m), 748.68 (m), 690.38 (w), 651.64 (w), 606.12 (s), 489.52 (m), 431.22 (m).
EuK(SO4)2 (6). This complex was synthesized by a procedure similar to that used for 1 but changing the PrCl3×6H2O to EuCl3×6H2O (0.110 g, 0.30 mmol), primrose yellow crystals of 6 were obtained in ca. 67% yield based on Eu (III). Elemental analysis for EuK(SO4)2 (Mr = 383.21): Eu, 39.66; K, 10.20%. Found: Eu, 39.61; K, 10.12%. IR data (KBr pellet, n [cm−1]): 3432.24 (w), 2926.42 (w), 2857.74 (w), 1743.66 (w), 1265.24 (w), 1121.91 (s) , 636.34 (s), 602.19 (s), 451.72 (w).
[Gd2(SO4)3(H2O)8] (7). This complex was synthesized by a procedure similar to that used for 1 but changing the PrCl3×6H2O to GdCl3×6H2O (0.111g, 0.30 mmol), colorless crystals of 7 were obtained in ca. 66% yield based on Gd (III). Elemental analysis for H16O20S3Gd2 (Mr = 746.84): Gd, 42.11%; H, 2.16%. Found: Gd, 42.06; H, 2.25%. IR data (KBr pellet, n [cm−1]): 3481.31 (s), 3371.48 (s), 3235.32 (m), 1648.77 (s), 1143.62 (s), 1092.09 (s), 1001.07 (s), 806.98 (w), 742.28 (w), 651.64 (w), 599.73 (s), 489.52 (m), 431.22 (m).
[Ho2(SO4)3(H2O)8] (8). This complex was synthesized by a procedure similar to that used for 1 but changing the PrCl3×6H2O to HoCl3×6H2O (0.114 g, 0.30 mmol), pink crystals of 8 were obtained in ca. 61% yield based on Ho (III). Elemental analysis for H16O20S3Ho2 (Mr = 762.20): Ho, 43.28%; H, 2.12%. Found: Ho, 43.15%; H, 2.32%. IR data (KBr pellet, n [cm−1]): 3486.64 (s), 3384.20 (s), 3240.87 (w), 2331.67 (w), 1641.23 (s), 1395.07 (w), 1148.91 (s), 1101.26 (s), 1005.58 (s), 608.94 (m), 479.11 (w), 438.22 (w).
2.3. Initial Characterization
Initial characterizations were carried out by elemental analysis, PXRD and IR studies.
PXRD patterns were recorded in the 2θ range 5-50˚using Cu-Ka radiation (Bruker Advance-D8), with a step size of 0.02˚(2θ) and a count time of 2s per step. As shown in Figures S1-S8, all the peaks presented in the measured patterns closely match the simulated patterns generated from single crystal diffraction data, which confirm the phase purity of the bulk samples.
The IR spectra for the complexes were recorded as KBr pellets (Supporting Information, Figure S9 and S10). The IR spectra of complexes 1, 2, 3, 4, 5, 7 and 8 exhibit strong and broad absorption bands in the range of 3009 –3679 cm−1 and 1640 cm−1, indicating the presence of coordination water moleculars. In 1, 2, 3, 4, 5, 7 and 8, the  ions adopt μ3 or μ2 coordination modes and lead to low site symmetry C3v or C2v. The bands show medium strong intensity at 994 and 607 cm−1. These may be attributable to the symmetric S-O stretching mode (ν1) and the symmetric
  bending mode(ν2). The strong band around 1117 cm−1 splitting into two bands, 1142 and 1093 cm−1, may be assigned to the ν3 mode because of the coordination of the free sulfate group to the metals. Compared with that of the above complexes, the IR spectra of complex 6 shows some difference in that there were only two main characteristic bands of 1139 cm−1 and 601 cm−1 ascribed to the vibration of the sulfate group [57-59].
2.4. Single Crystal Structural Determinations
A suitable single crystal of each compound was carefully selected under a cubic microscope and glued to a thin glass fiber for X-ray measurement. Of these reflection data of the complexes, 1-5, 7 and 8 were collected on a Bruker AXS SMART APEX II CCD diffractometer with graphite monochromatized Mo Kα radiation (λ = 0.71073 Å), and that of 6 was collected on a Xcalibur, Atlas, Gemini ultra CCD diffractometer. The data were reduced using SAINTPLUS, and an empirical absorption correction was applied using the SADABS program. The structure was solved and refined using SHELXL-97. All the hydrogen positions were initially located in the different Fourier maps. Final refinement included atomic positions for all the atoms, anisotropic thermal parameters for all the non-hydrogen atoms, and isotropic thermal parameters for all the hydrogen atoms. Details of the structure solution and final refinements for the compounds are given in Tables 1 and 2. The selected bond lengths and bond angles of complexes 3 are listed in Table 3, that of 6 are represented in Table 4, and that of 1, 2, 4, 5, 7 and 8 are shown in the supplement materials (Table S1-S6).
2.5. Experiment Set up for Catalytic Oxidation
The oxidation reactions were carried out under air condition (atmospheric pressure) in Schlenk tubes. In a typical experiment, 0.0004 g of the catalysts (complex 1-8) was dissolved in 3.00 ml of desired solvent. Then the required amounts of H2O2 (30% H2O2 solution) and HNO3 were added according to this order. Finally, 0.68 g of cyclohexane was added into the solution to make the cyclohexane/catalyst molar ratio equal to 15,000. The reaction solution was stirred for some time at the given temperature.
For the product analysis, 0.03 g of methylbenzene (internal standard) and 1.5 ml of diethyl ether (to extract the substrate and the organic products from the reaction mixture) were added. The obtained mixture was stirred
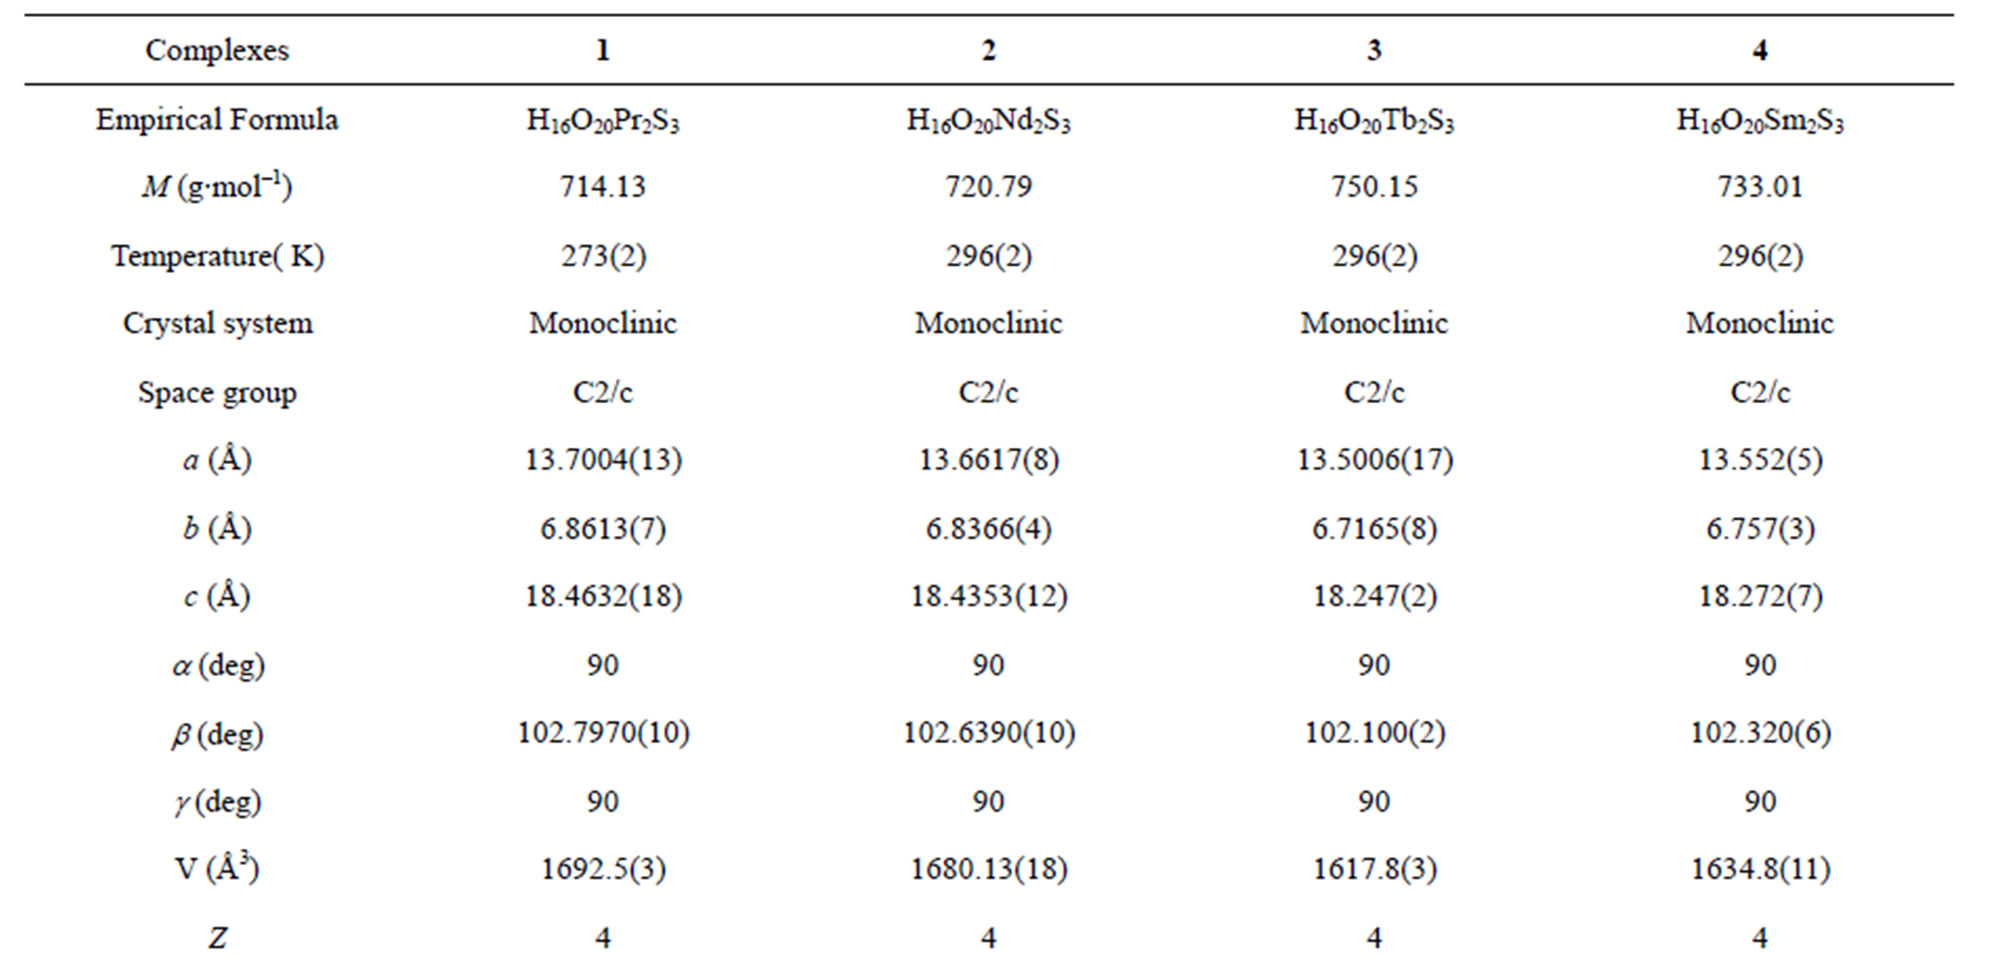
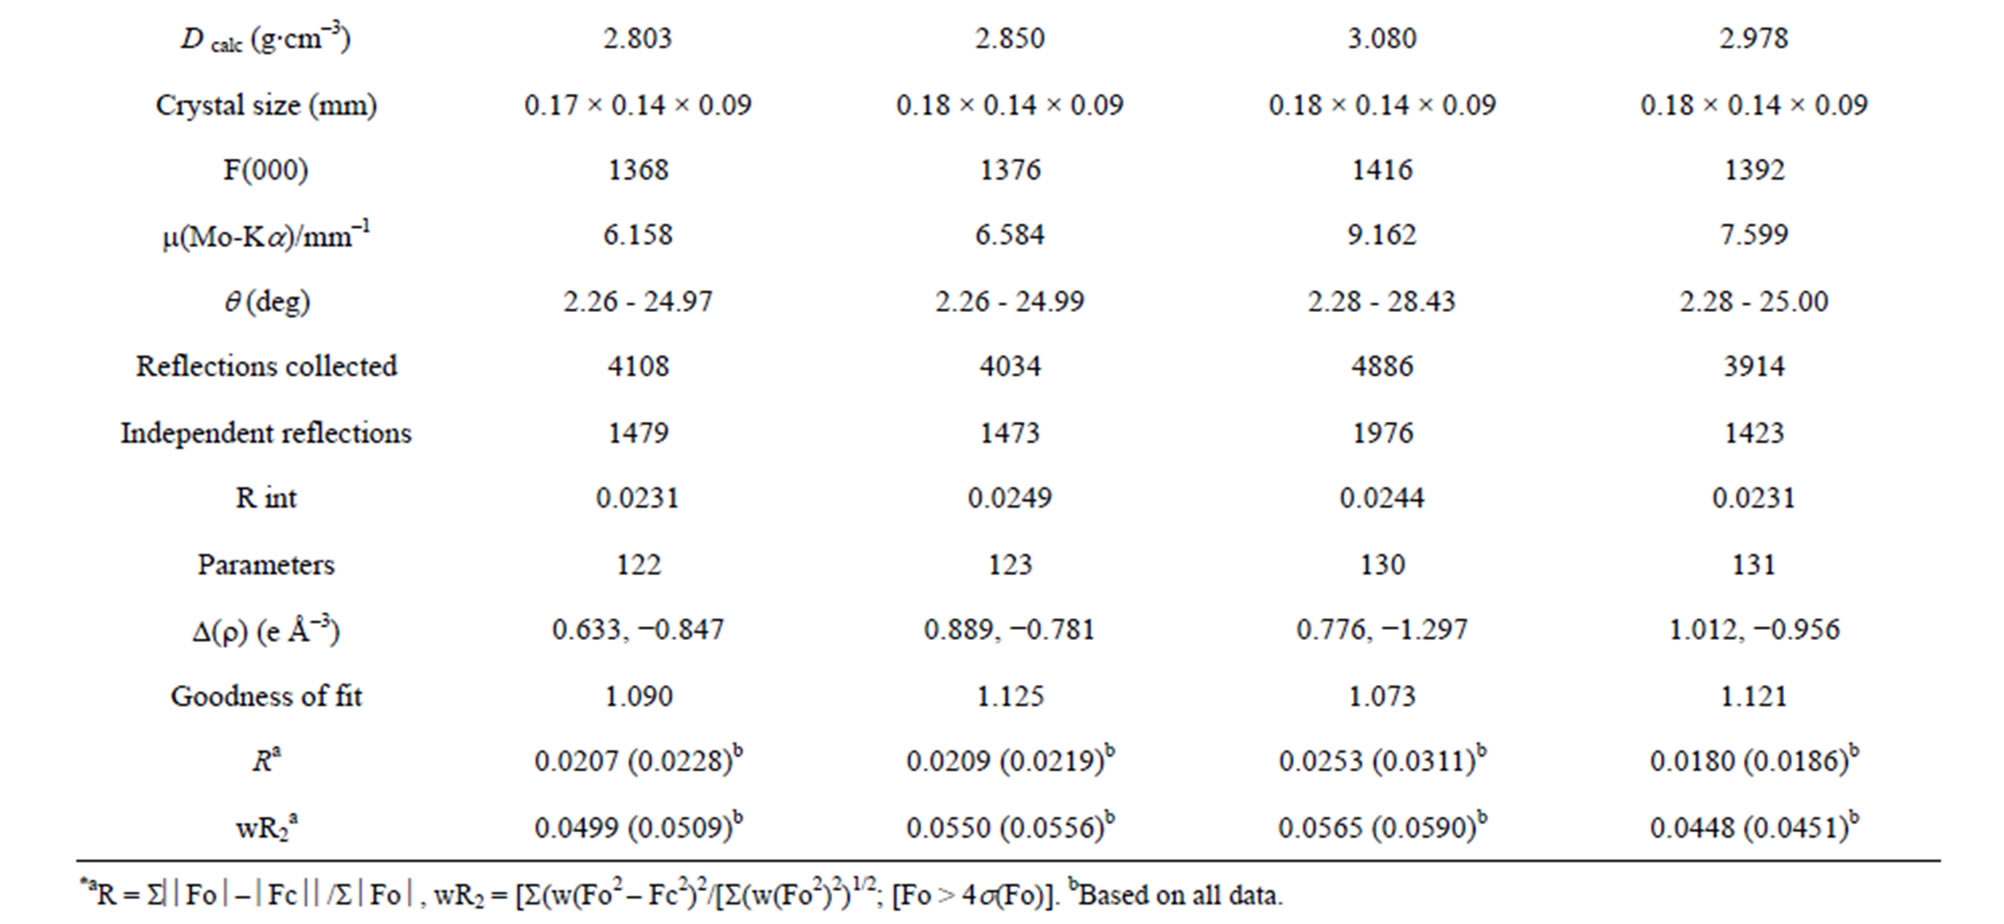
Table 1. Crystallographic data for complexes 1-4*.
for 10 min and then a sample (0.8 μL) was taken from the organic phase and analyzed by a GC equipped with a capillary column and a flame ionization detector by the internal standard method. Blank experiments confirmed that no cyclohexanol or cyclohexanone were formed in the absence of the metal catalyst under the same conditions.
3. RESULTS AND DISCUSSION
3.1. Synthesis
As shown in Table 5, in the investigation we tried four methods in order to let the lanthanide ions coordinate with 5-sulfosalicylic acid and a flexible ligand, or to coordinate with 5-sulfosalicylic acid and another rigid ligand. The details are as follows. At first, we designed the experimental method (II), for the purpose of the coordination of lanthanide ions and 5-sulfosalicylic acid and chain-like aliphatic dicarboxylic acid to achieve novel complexes with 5-sulfosalicylic acid-dicarboxylic acid as rigid-flexible ligands. But unfortunately, every experimental result demonstrated that lanthanide ions only coordinated with aliphatic dicarboxylic acid. In this case, in order to explore the experimental conditions of the coordination of 5-sulfosalicylic acid and lanthanide
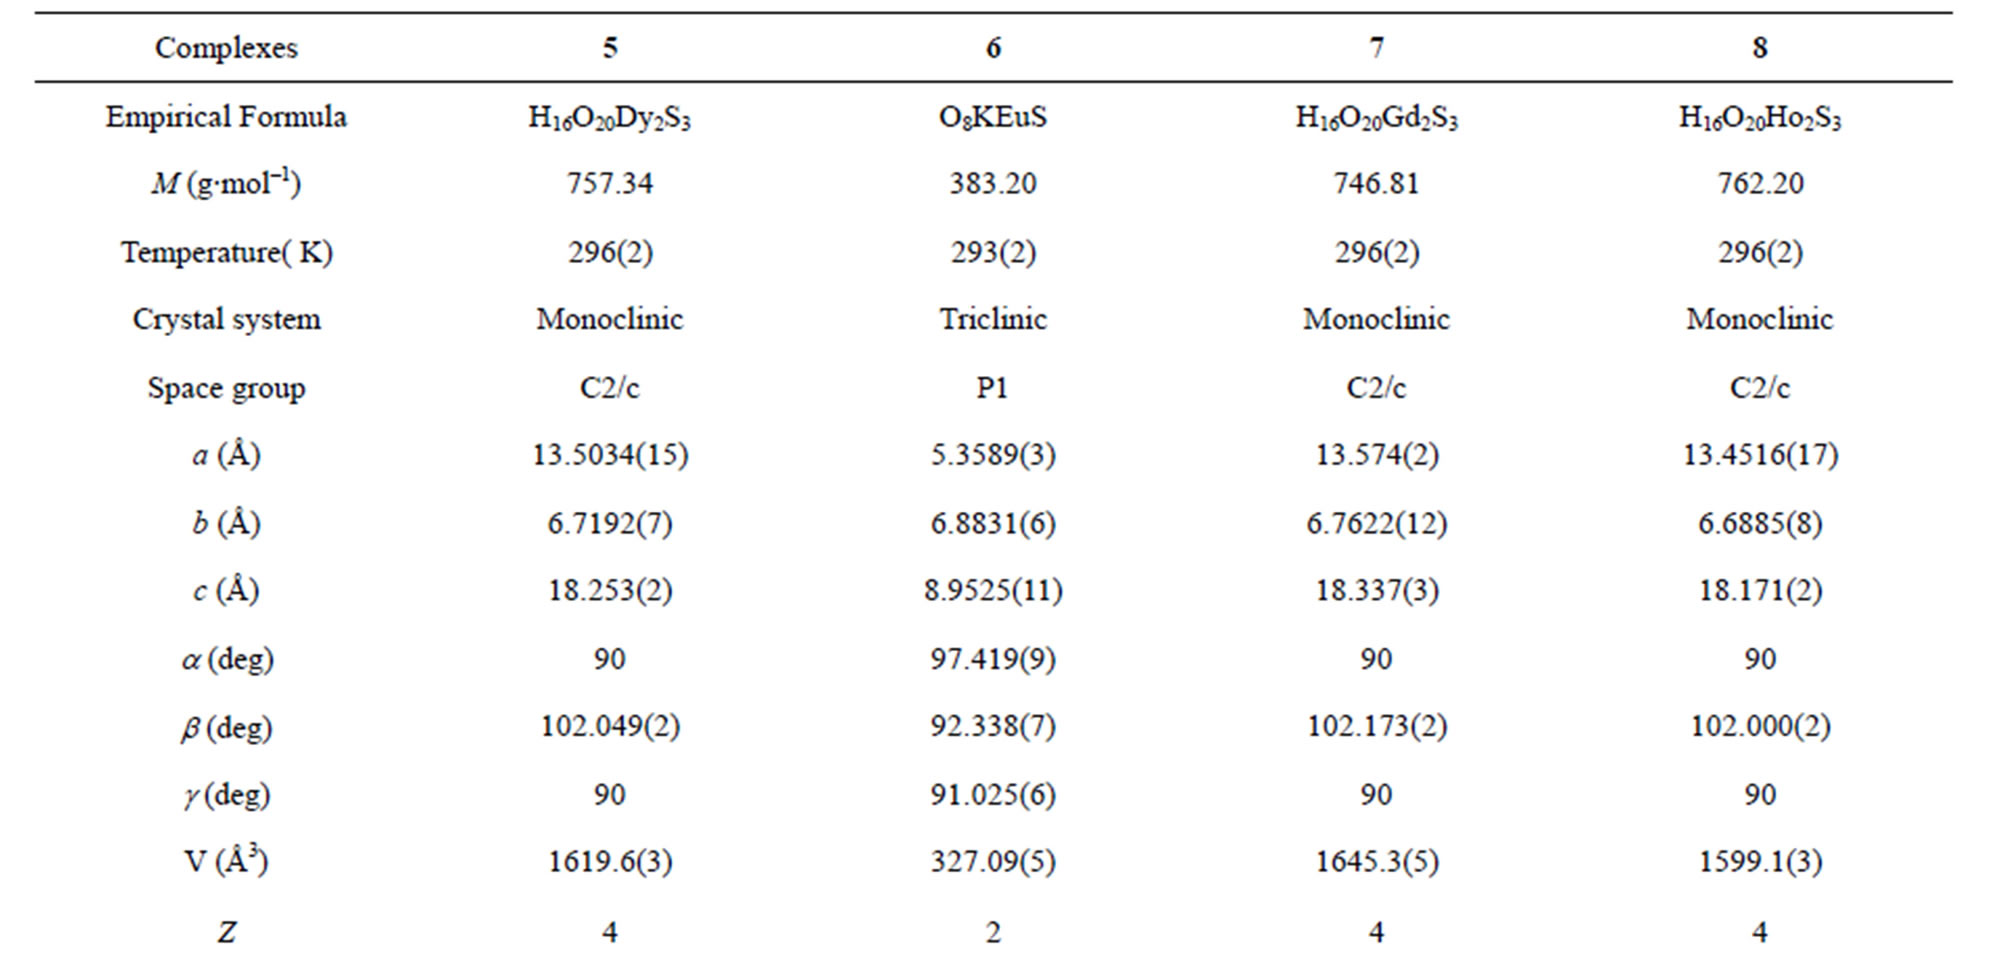
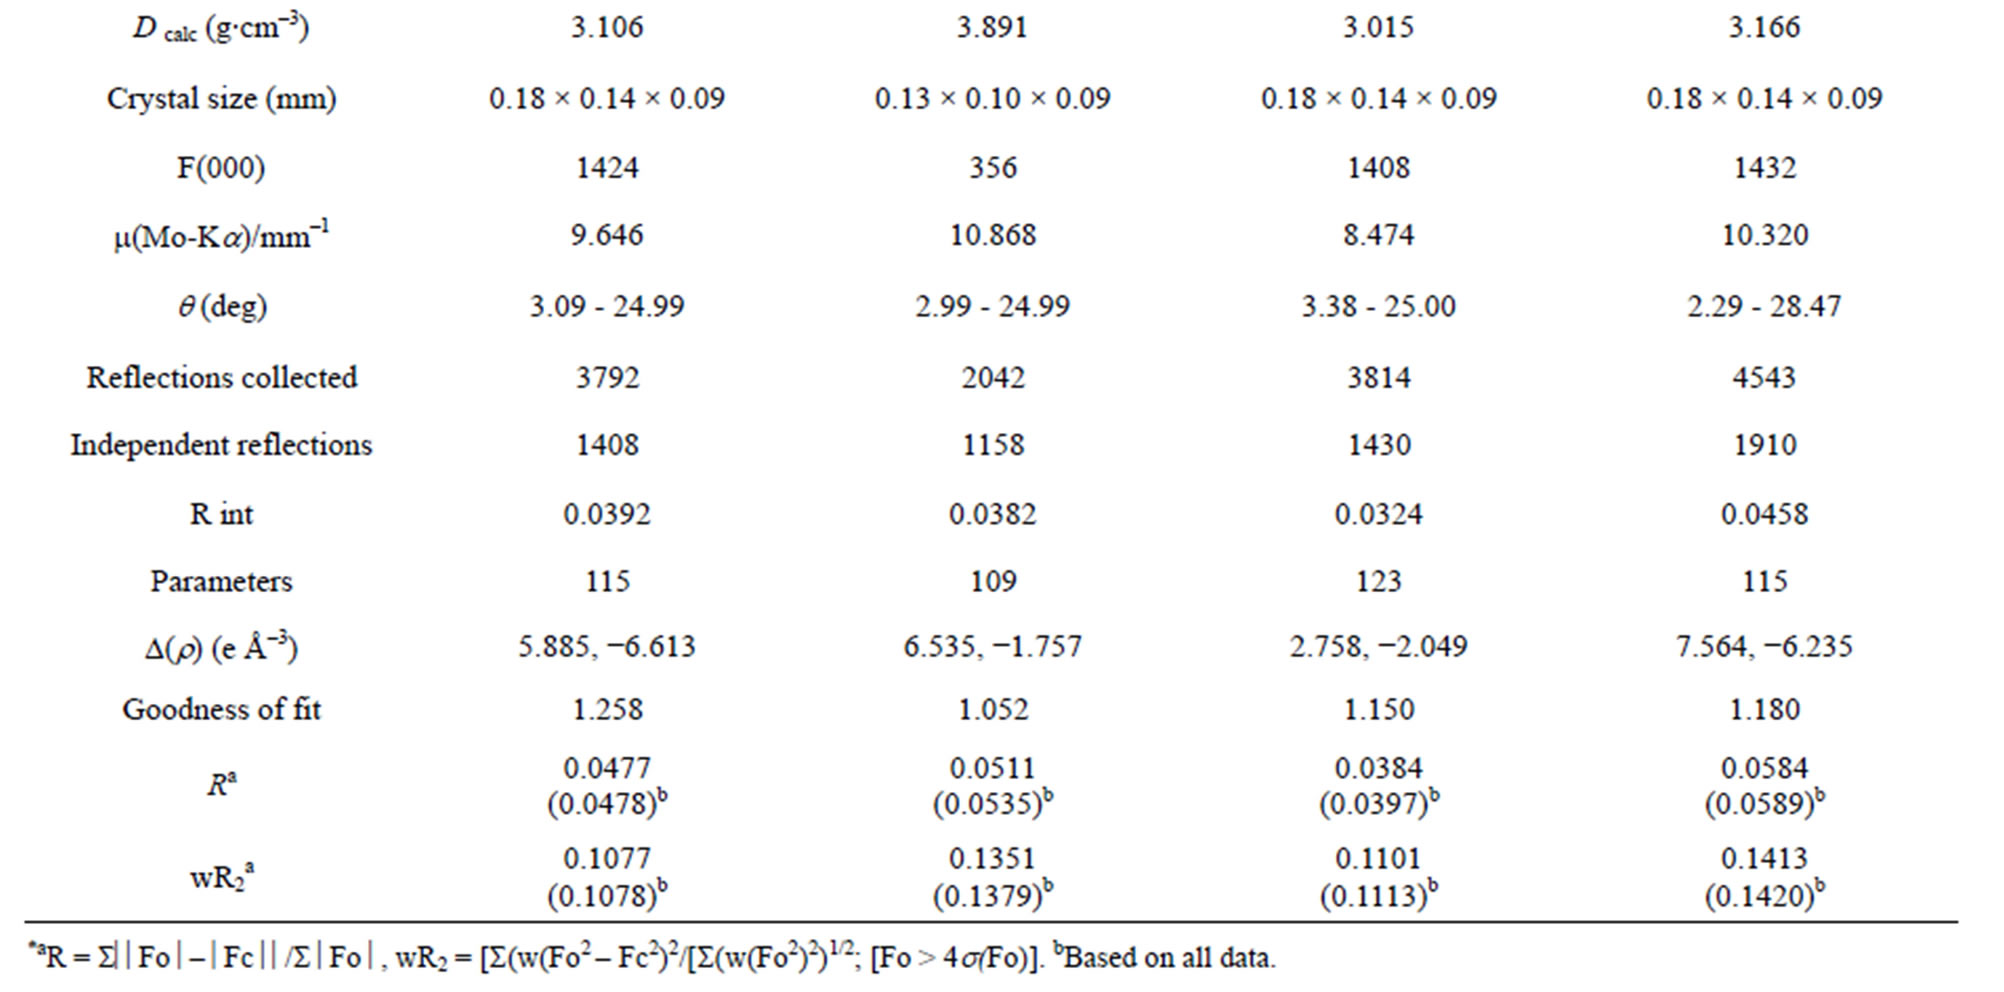
Table 2. Crystallographic data for complexes 5-8*.
ions, the experiment of (I) was devised. That is, there were only the lanthanide chloride and 5-sulfasalicylic acid in the reaction systems. However, after the normal hydrothermal reaction and cooling, there was still only the clear solution and no desired crystal of the complexes, which lead us to reach a conclusion that 5-sulfosalicylic acid and lanthanide chloride could not directly react with each other in this condition. Then, we designed the experiments of (III) and (IV), that is, the weak acid of dodecanedioic acid or the weak base of 2,4,6-tis (3,5-dimethyl-1H-pyrazol-1-yl)-1,3,5-triazine were added in addition to the lanthanide ions and 5-sulfosalicylic acid because neither dodecanedioic acid nor 2,4,6-tis(3,5- dimethyl-1H-pyrazol-1-yl)-1,3,5-triazine can easily coordinate with lanthanide ions in this reaction condition. Although lanthanide-3pz-CQ has been reported in the past literature, a lanthanide-dodecanedioic acid complex has never been reported. For 3pz-CQ compound, it is possible that lanthanide ions tend to coordinate with oxygen atoms, and coordinate with nitrogen only in an appropriately polar non-aqueous solvent such as ethanol. For dodecanedioic acid, since it possesses a too long
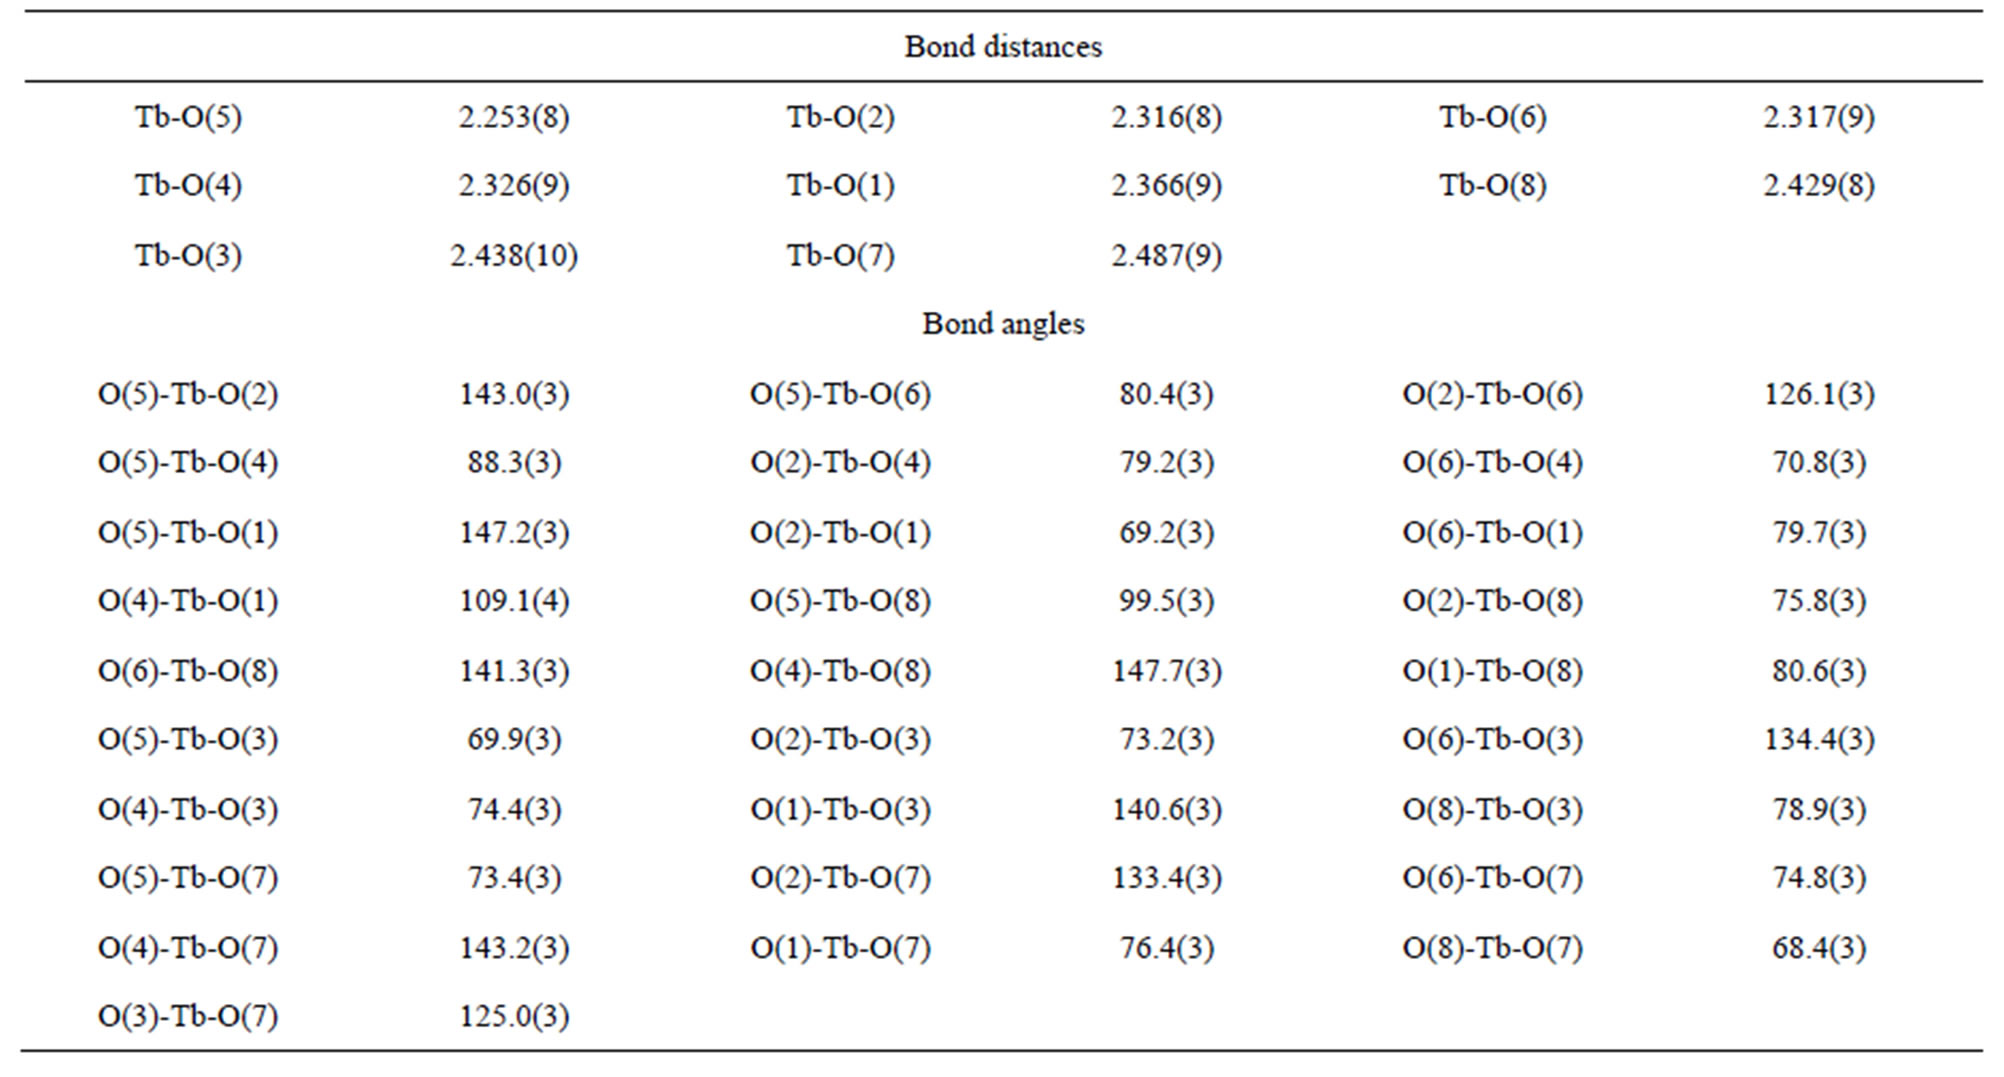
Table 3. Selected bond distances (Å) and angles (deg) of complex 3.
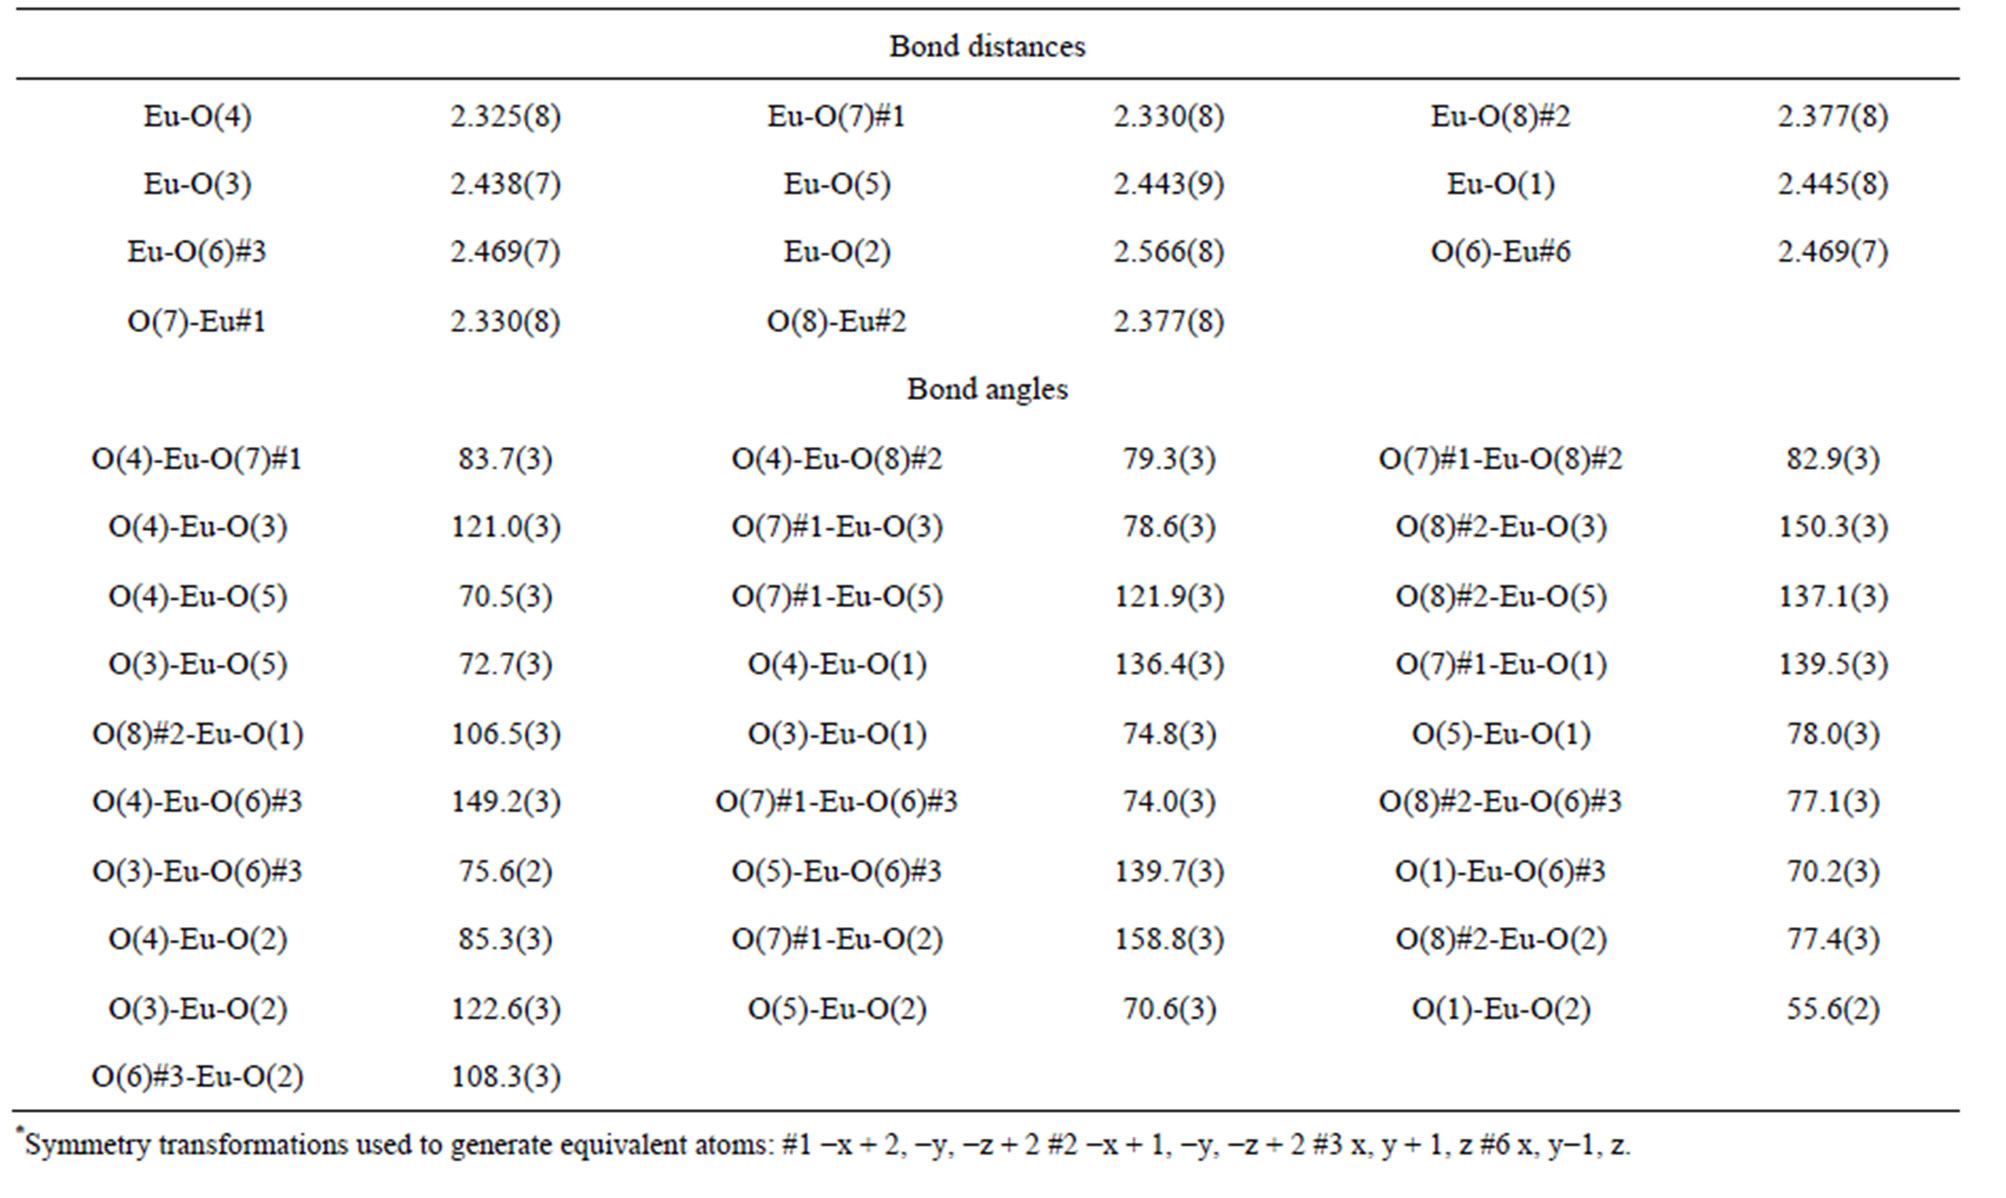
Table 4. Selected bond distances (Å) and angles (deg) of complex 6*.
carbon chain and large steric hindrance, it maybe not coordinate with lanthanide ions to form stable skeleton of complexes. According to the experimental case above, we can use their insolubility and inertia of coordination with lanthanide ions to promote the coordination of lanthanide ions and 5-sulfosalicylic acid. Based on these points, we chose the mixed solvents of water-ethanol. On one hand, it makes the inert ligand dissolve well in the
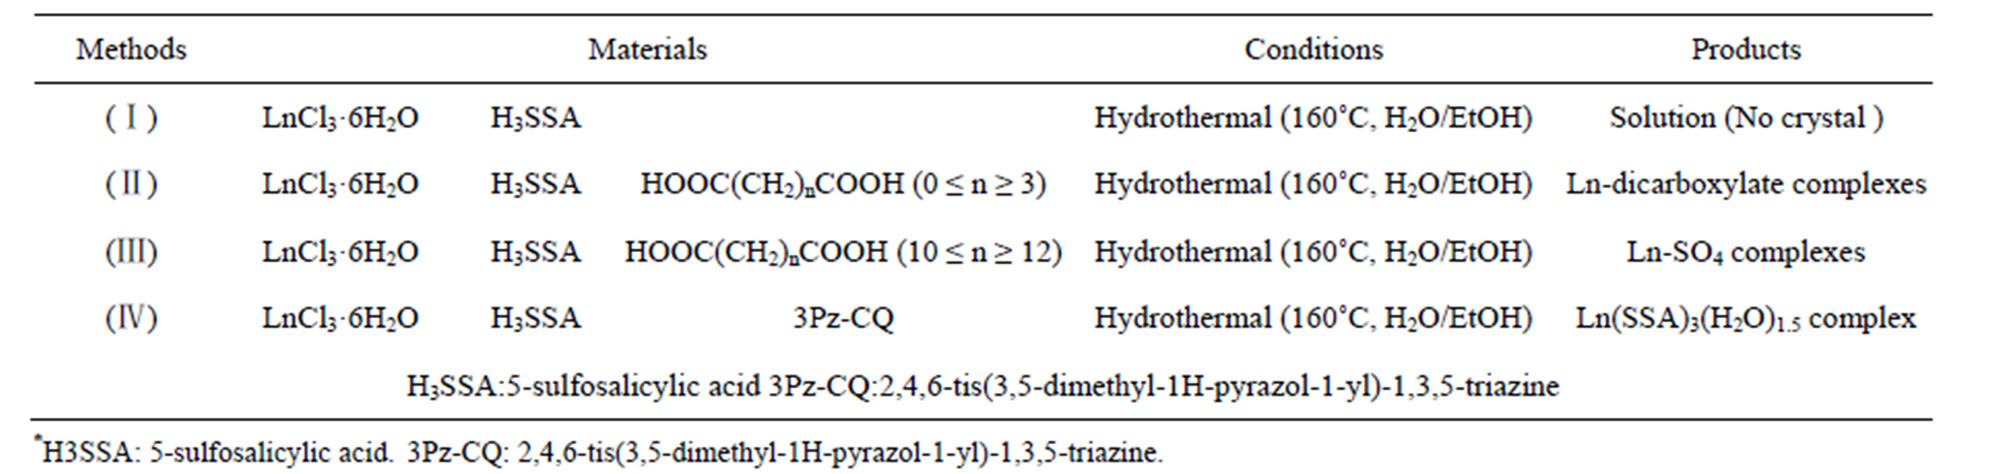
Table 5. Experimental strategies demonstrating the reaction mechanism.
ethanol and strengthen the possibility of coordination with lanthanide ions. On the other hand, because of the addition of ethanol, it increases the mole concentration of 5-sulfosalicylic acid which easily dissolves in water, and as a result, enhances the molecular collision possibilities and coordination opportunities of 5-sulfosalicylic acid and lanthanide ions. All these promote the lanthanide ions to coordinate with the inert ligand as well as 5-sulfosalicylic acid. But in fact, the results of the experiment of (III) indicated that when a weak acidic ligand was added in the reaction system a decomposition reaction of 5-sulfosalicylic acid occurred, and at the same time, it gave rise to a new reaction in situ, namely, the decomposed product ( ) coordinated to lanthanide directly. This shows that in the reaction above both dodecanedioic acid and 2,4,6-tis(3,5-dimethyl-1H-pyrazol-1-yl)-1,3,5-triazine played a certain role as a pHadjusting agent and a structure-directing agent for the coordination of 5-sulfosalicylic acid and lanthanide ions. Compared to 2,4,6-tis(3,5-dimethyl-1H-pyrazol-1-yl)-1,3, 5-triazine, it seems that dodecanedioic acid played a more important role for coordination. It might offer some protons for the system to be acidic. Then these protons attached at the juncture of the sulfo-group and phenyl and made the unstable 5-sulfosalicylic to decompose and form the rather stable salicylic acid, and the sulfo-group, which has fallen off from the phenyls, then coordinated with lanthanide ions. The detailed reaction mechanism was speculated in Scheme 2.
3.2. Structural Description of Complexes
X-ray diffraction determination results reveal that coordination polymers 1 - 5, 7, 8 are isomorphous, therefore complexes 3 and 6 are taken as the examples to present and describe the structures in detail.
Structure of Ln2(SO4)3(H2O)8, (Ln = Pr(1), Nd(2), Tb(3), Sm(4), Dy(5), Gd(7), Ho(8))
The structure of 3 reveals that it is a 2-D framework complex. The asymmetric unit of 3 contains one Tb3+ atom, one and a half  anions and four coordination water molecules. The Tb atom is eight-coordinated to
Scheme 2 . Reaction mechanism of complexes 1-8.
four sulfate ions in the monodentate fashion and four water molecules (Figure 1(a), Figures S11(a)-S16(a)). Of the two framework sulfate ions, one binds to two Tb atoms in a monodentate fashion leaving two terminal S-O bonds, whereas another binds to three metal atoms in a monodentate manner leaving one terminal S–O bond (Scheme 3(d) and (c)). The linkage of the TbO8 polyhedra and the SO4 tetrahedra by sharing vertices gives rise to neutral inorganic layers parallel to the bc-plane, containing four-membered and eight-membered rings (Figure 1(b)), (Figures S11(b)-S16(b)).
 can be regarded as 2-connected and 3-connected linkers, and Tb3+ is surrounded by four
  ligands and can be regarded as a 4-connected node. Topology analysis by the TOPOS 4.0 software package suggests that complex 3 possesses a 2D (2, 3, 4)-connected 3- nodal network with a Schläfli symbol of (42.6.82.10)2 (42.6)2(8) (Figure 1(c), Figures S11(c)-S16(c)).
In the complex Tb2(SO4)3(H2O)8, there exists seven kinds of intermolecular hydrogen bonding interactions of O1-H1A∙∙O9, O1-H1B∙∙O10, O3-H3A∙∙O7, O3-H3B∙∙O8, O4-H4A∙∙O9, O4-H4B∙∙O10, O7-H7B∙∙O8, in which they are respectively formed by water molecular and  ligands, except O3-H3A∙∙O7 which is formed by water molecules. In addition, O1-H1A∙∙O9, O4-H4A∙∙O9, O4-H4B∙∙O10 and O7-H7B∙∙O8 linked the adjacent bc planes to generate a 3D framework. At the same timeO1-H1B∙∙O10, O3-H3A∙∙O7, O3-H3B∙∙O8, as the intermolecular hydrogen bondings, further strengthen the whole structure of complexes (Figure 1(d), Figures S11(d)-S16(d)). As shown in Table 6, the hydrogen
Table 6. Hydrogen bonds distances (Å) and angles (˚) of complex 3*.
bonding distances of D···A vary from 2.7151 to 2.9413 Å, and the angles of D-H···A are in the rage of 120.09˚ - 166.93˚. The detail hydrogen bondings of the complexes are listed in Tables S7-S12. All these are comparable with those found in other reported lanthanide sulfate complexes [55,60-62].
Structure of EuK(SO4)2 (6)
The structure of 6 reveals that it is a 3-D framework complex. The asymmetric unit of 6 contains one Eu3+ cation, one K+ cation and two  anions. The metal atom is eight-coordinated by the oxygen atoms from seven sulfate ions as can be seen in Figure 2(a). Thus, two of the sulfur atoms in the asymmetric unit S1 forms four S-O-Ln bonds to four crystallographically distinct Ln atoms, thereby sharing corners with four metal-oxygen polyhedra. The S2 forms four S-O-Ln bonds to three unique metal atoms, sharing the corners with two metal-oxygen polyhedra and the edge with another polyhedron (Scheme 3(a) and (b)). The Eu-O bond distances are in the range of 2.325(5) - 2.566(8) Å (av. 2.416(1) Å). The O-Eu-O bond angles are in the range of 55.6(2) - 158.8(3)˚. The selected bond distances and angles are given in Table 4. LnO8 polyhedra are linked by the S(1)O4 tetrahedra in two-dimensions to form fourmembered rings, the rings connected by S(2)O4 to form layers parallel to the bc-plane of the unit cell. Such a connectivity between the four-membered rings results in the formation of six four-membered rings around each eight-membered ring (Figure 2(b)). The layers are stacked over one another in AAA… fashion, with two adjacent layers separated by a unit cell length along the a-axis of the unit cell, thus forming four and eightmembered channels. The S(1)O4 tetrahedra share corners and the S(2)O4 tetrahedra share corners and edges with
 (a)
(a)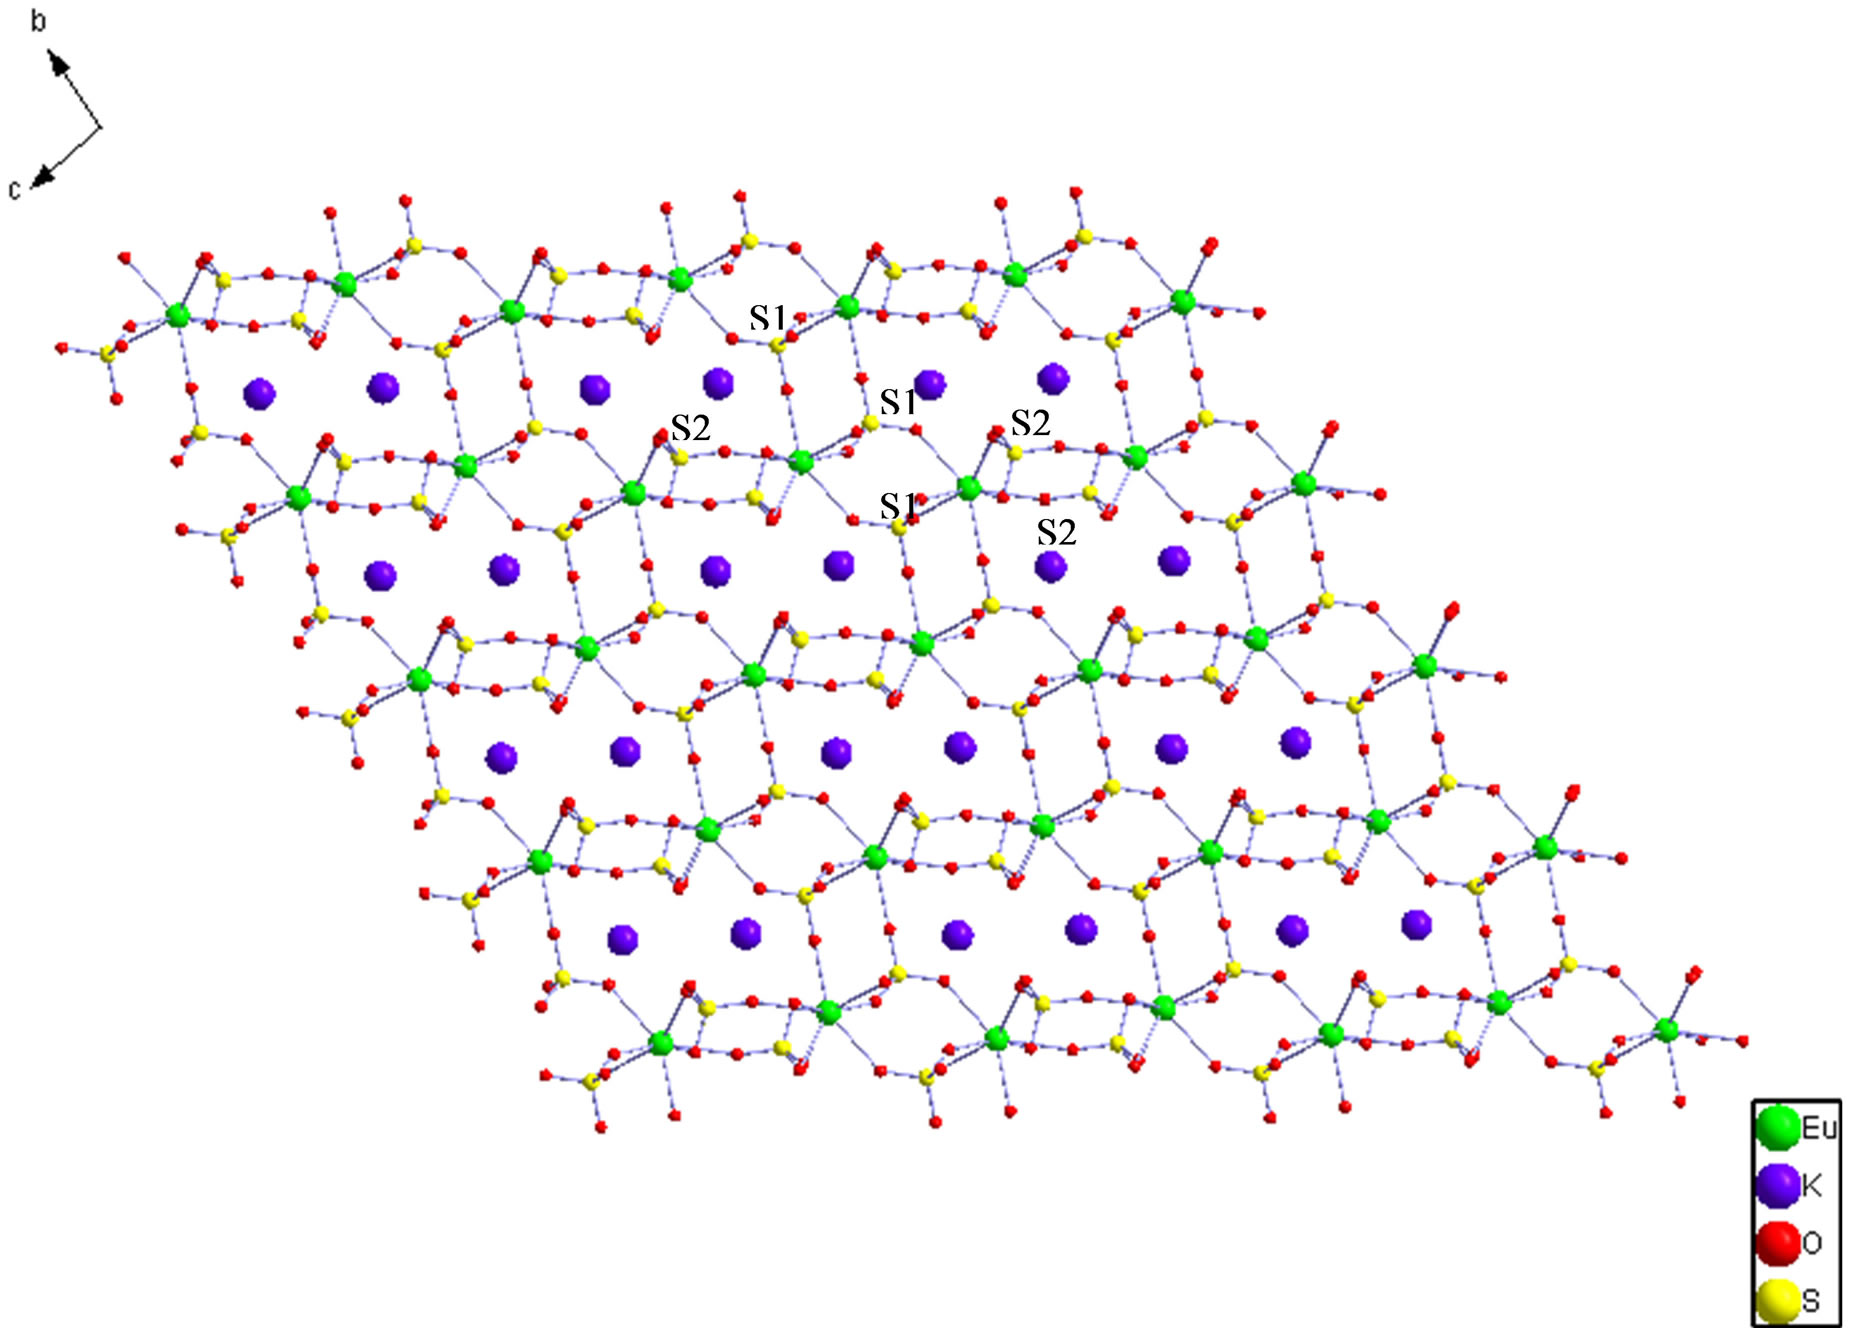 (b)
(b) (c)
(c) (d)
(d)
Figure 2. (a) The ORTEP view of the coordination environment of Eu in complex 6. (Symmetry codes: #1: –x+2, –y, –z + 2; #2: –x + 1, –y, –z + 2; #3: x, y + 1, z; #4:x−1, y, z; #5:−x + 2,−y, −z + 1); (b) The layer, parallel to the bc-plane of the unit cell in I, formed by connecting EuO8 polyhedra with SO4 tetrahedra, by sharing edges and vertices, and thereby forming four-membered and eight-membered rings. Note the arrangement of the four-membered rings around the eight-membered rings. The kalium cations are shown in one eight-membered rings. (c) The three-dimensional framework formed by the linking of the layers, stacked one over another, along the a-axis of the unit cell by the sulfate groups. (d) Schematic representation of the 3D (43)(45.6)(48.69.84) topology network in complex 6. Fuchia, Eu; Lime, . (d-1) The 1D zig-zig chains in the ac plane. (d-2) The 2D wavelike layer in the ab plane. (d-3) A 7-connected metal mode containing one europium center with seven
 . (d-4) A 3-connected ligand node containing one
  with three samarium center. (d-5) A 4-connected ligand node containing one
  with four europium center.
the metal-oxygen polyhedra respectively from adjacent layers, thereby connecting the layers and forming a threedimensional framework (Figure 2(c)). This connectivity gives rise to a square grid of intersecting four membered channels running perpendicular to one an other, and intersecting the channels along the a-axis of the unit cell. The kalium cations are located in the cages formed by the eight-membered channels.
Each S(1)O4 links four adjacent Eu atoms to afford an infinite wavelike 2D layer in an ab plane (Figure 2(d)-2). Then S(2)O4 between the adjacent layers links three Eu atoms in zig-zig 1D chains in ac planes to construct a 3D framework (Figure 2(d)-1). In this case, S(1)O4 ligands can be regarded as 4-connected nodes (Figure 2(d)-5), S(2)O4 ligands can be regarded as 3-connected nodes (Figure 2(d)-4), and Eu atoms surrounded by seven  ligands can be considered as 7-connected nodes (Figure 2(d)-3). Topology analysis by the TOPOS4.0 software package suggests that EuK(SO4)2 possesses a 3D (3, 4, 7)-connected 3-nodel network with a (43) (45.6) (48.69.84) Schläfli symbol (Figure 2(d)).
3.3. Photoluminescent Properties
Lanthanide coordination polymers often exhibit intense luminescence and thereby are particularly interesting for luminescent materials. Owing to the excellent luminescent properties of Tb (III), Sm (III), Dy (III) and Eu (III) ions, the photoluminescent behaviors of the coordination polymers 3, 4, 5, 6 were investigated in the form of a solid state at room temperature.
The luminescent spectrum of complex 3 was investigated under excitation of 368 nm with a slit width (2.5:2.5). In Figure 3 it can be seen that emission peaks at 491 nm, 545 nm, 587 nm and 622 nm are attributed to the characteristic emissions of Tb emissive state 5D4 to the ground state 7FJ (J = 6→3), respectively. The spectra are dominated by the 5D4→7F5 transitions at 545 nm which create the intense green luminescence output for the solid sample. In addition, there exists a weak luminescence emission at 417 nm assigned to intraligand π→π* transition, implying that the energy is not fully transferred from the sulfate ion to the Tb ion.
The emission spectrum involving complex 4 was determined on excitation at 367 nm with a slit width (2.5:2.5), which is depicted in Figure 4. As expected, the
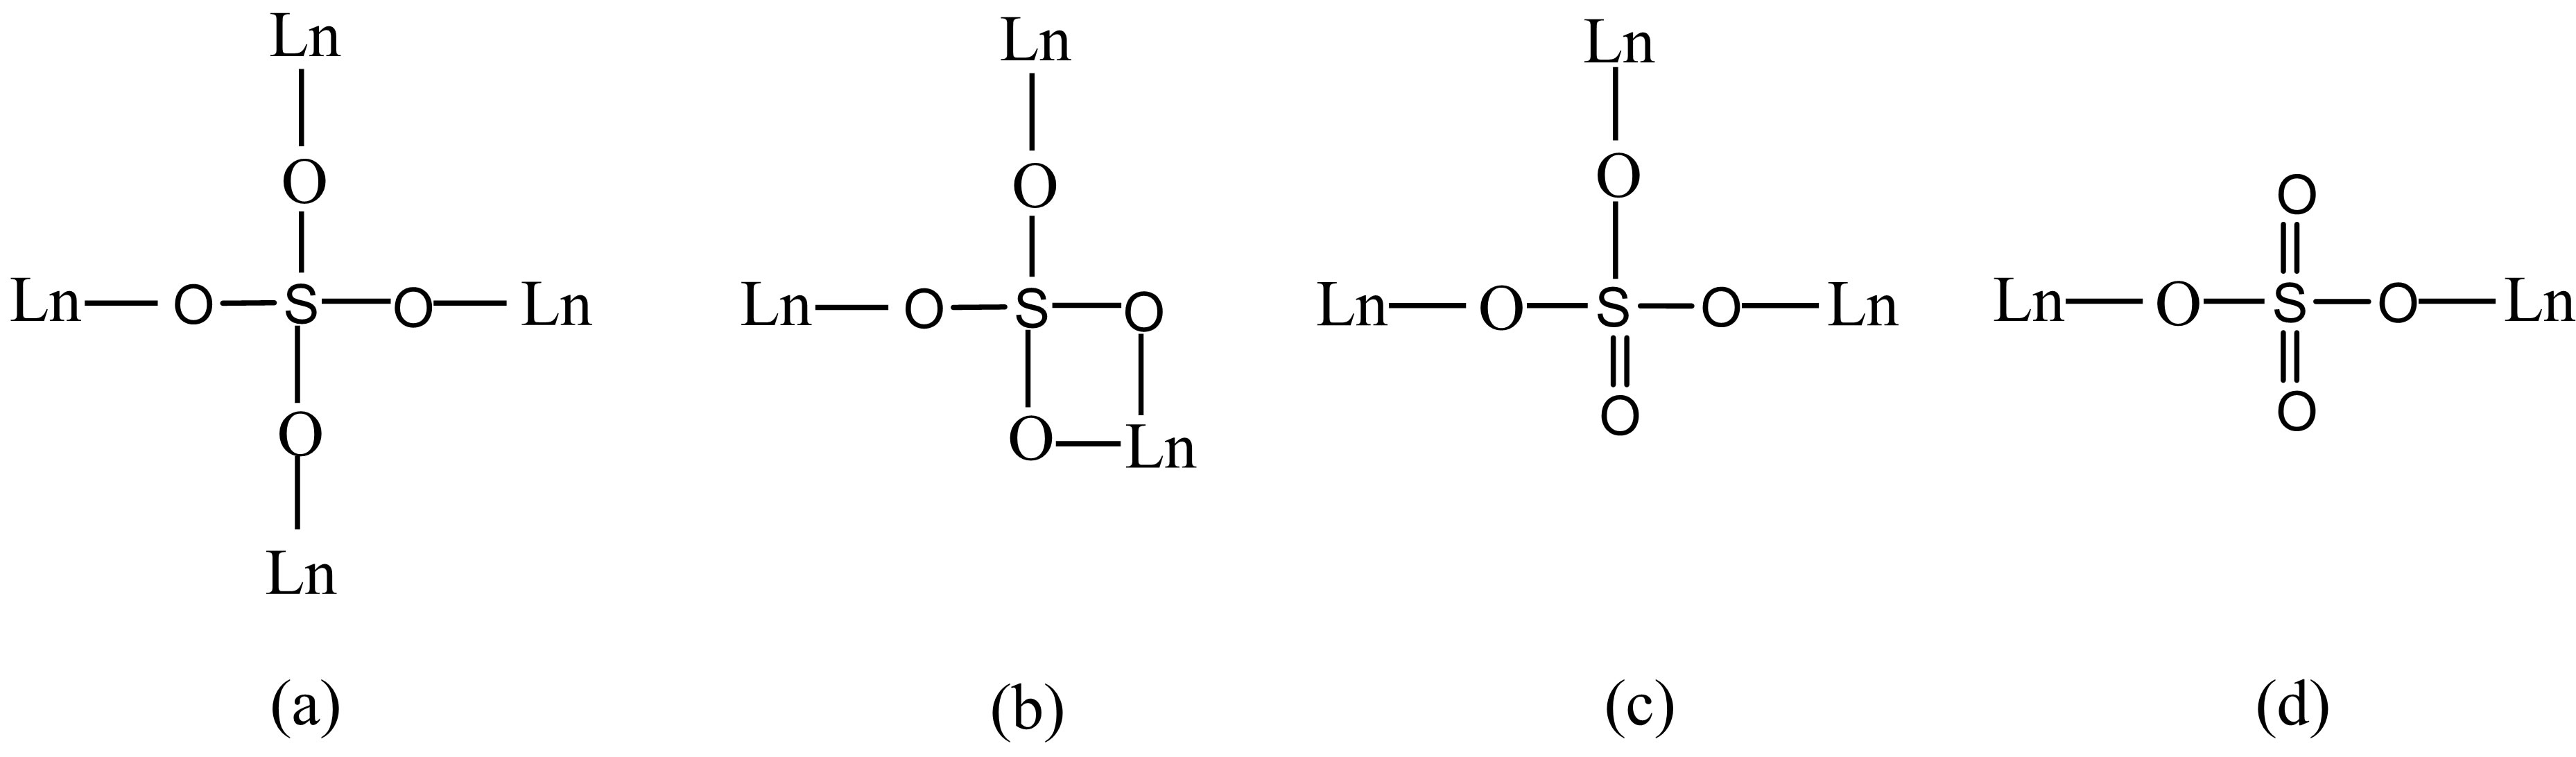
Scheme 3 . The four kinds of coordination modes of sulfate ions coordinated to lanthanide ions.
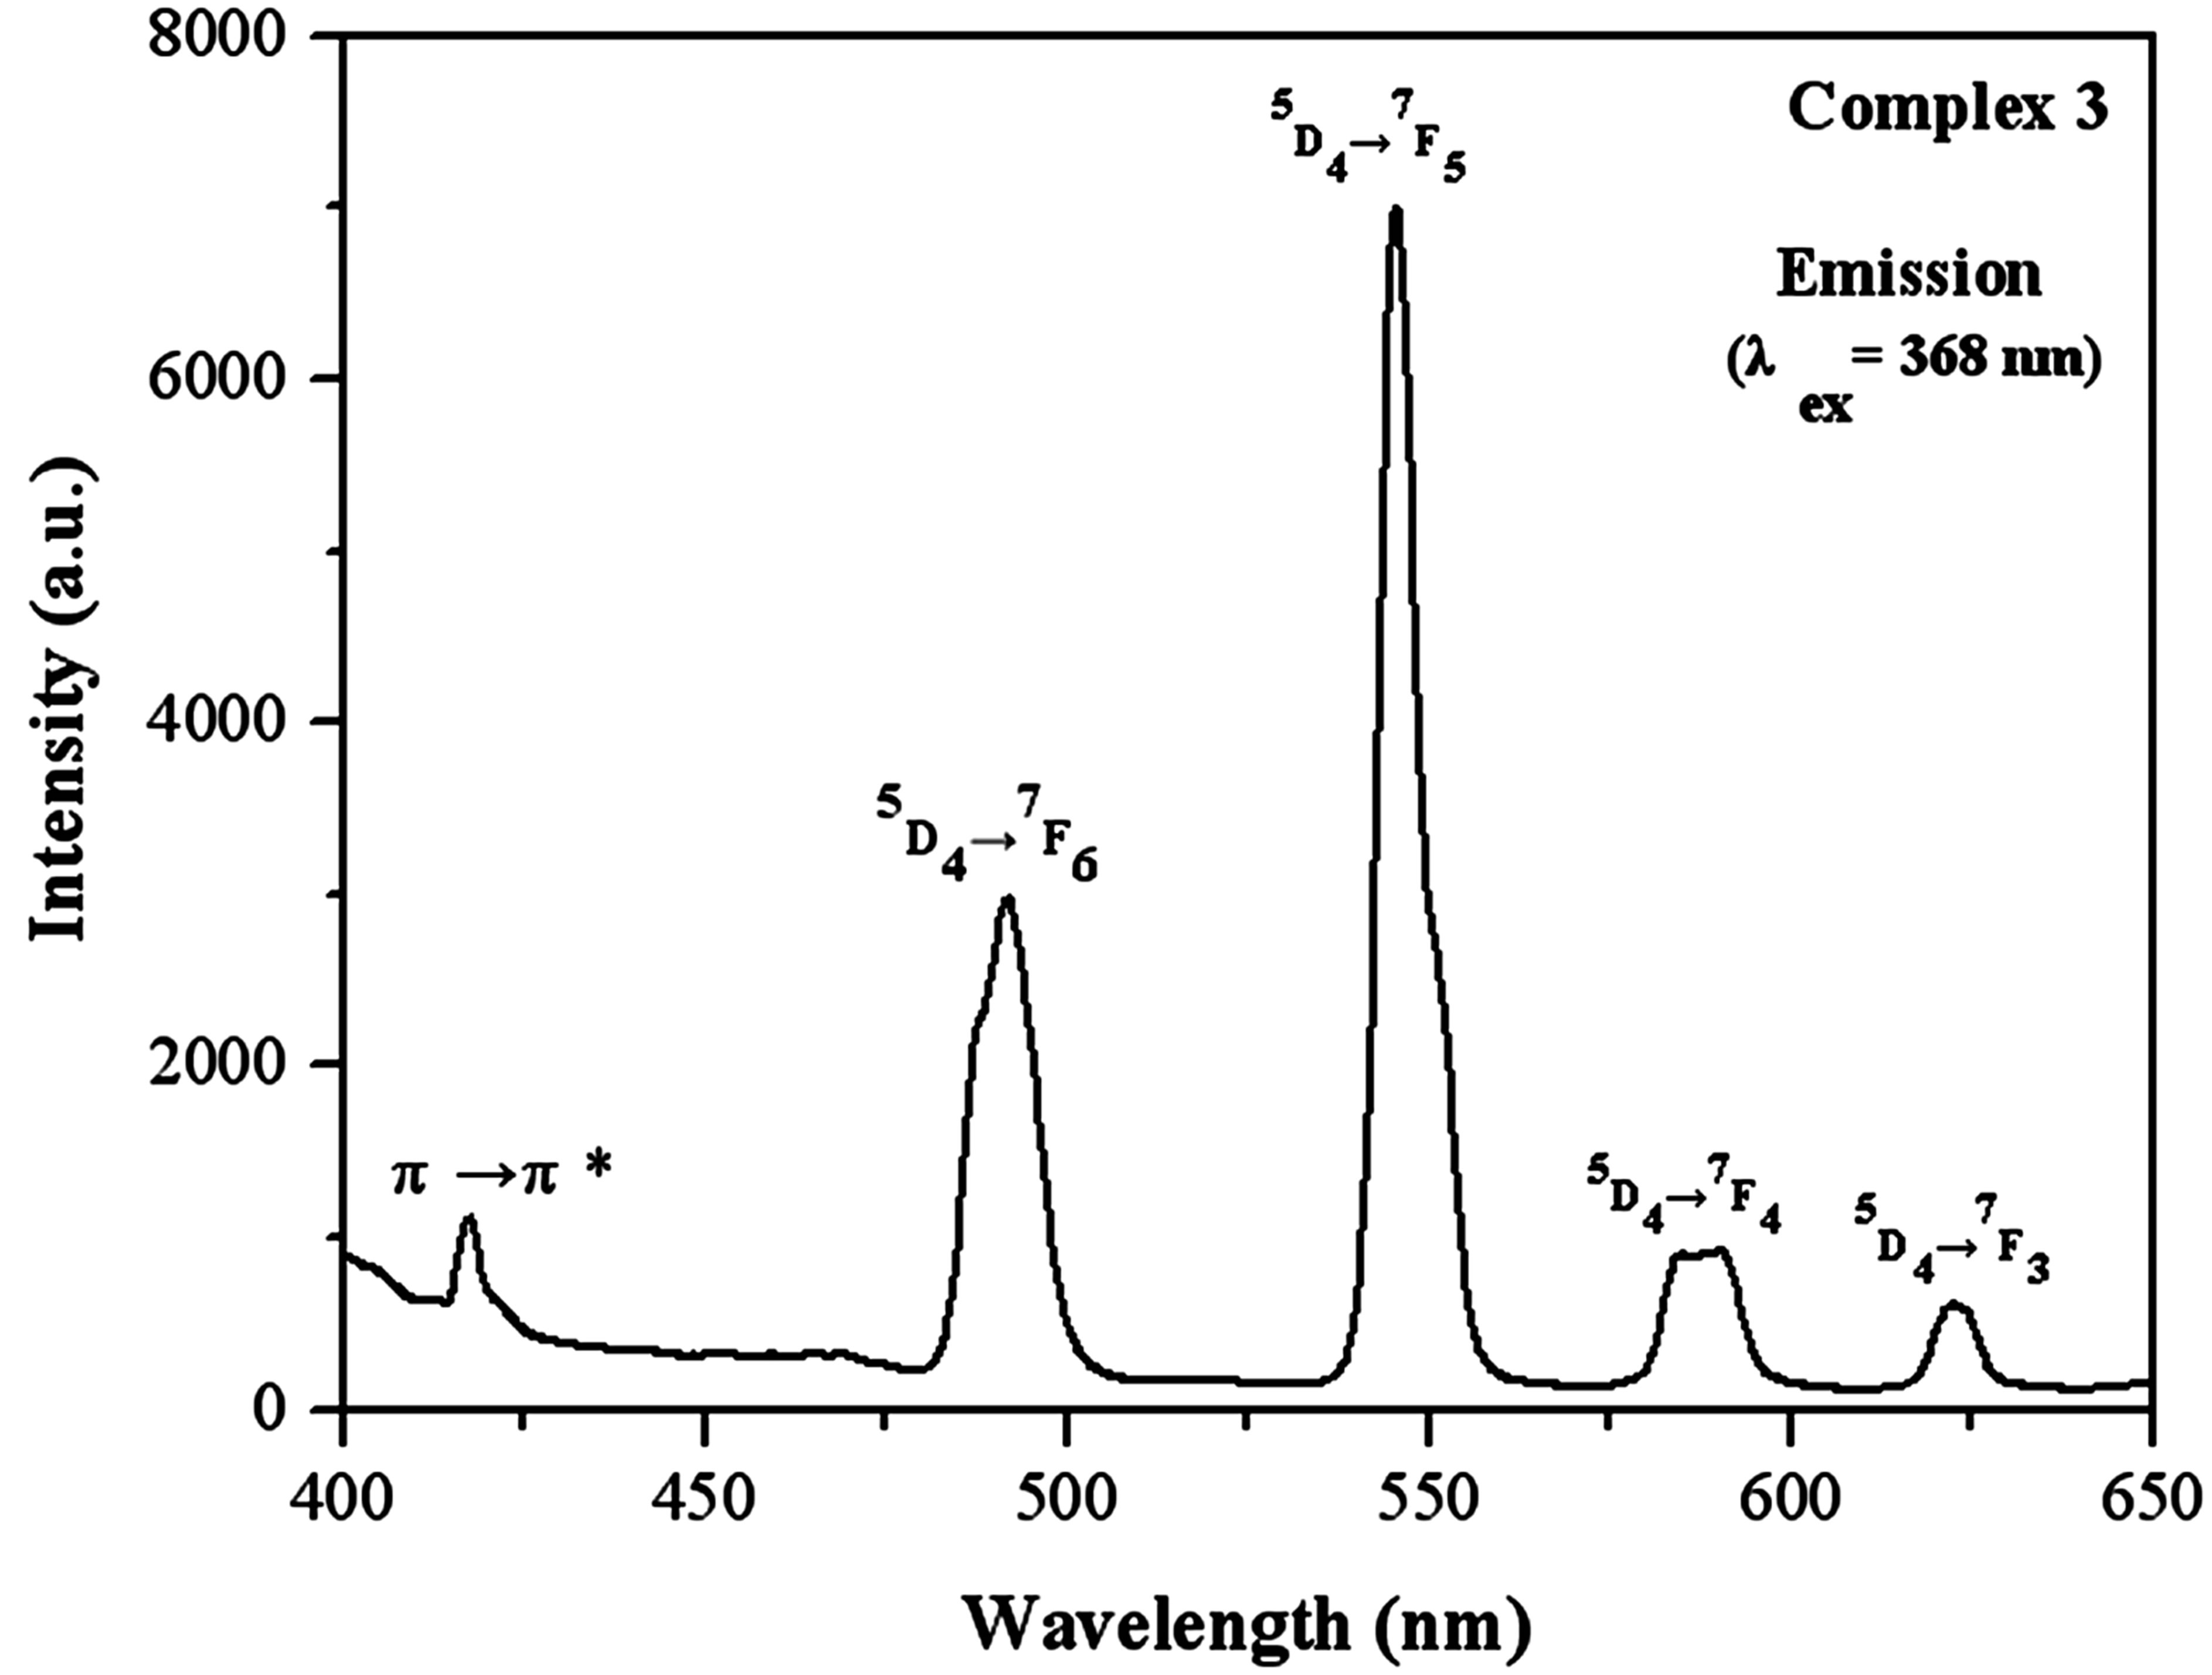
Figure 3. Photoluminescence emission spectra for complex 3 in the solid state at room temperature.
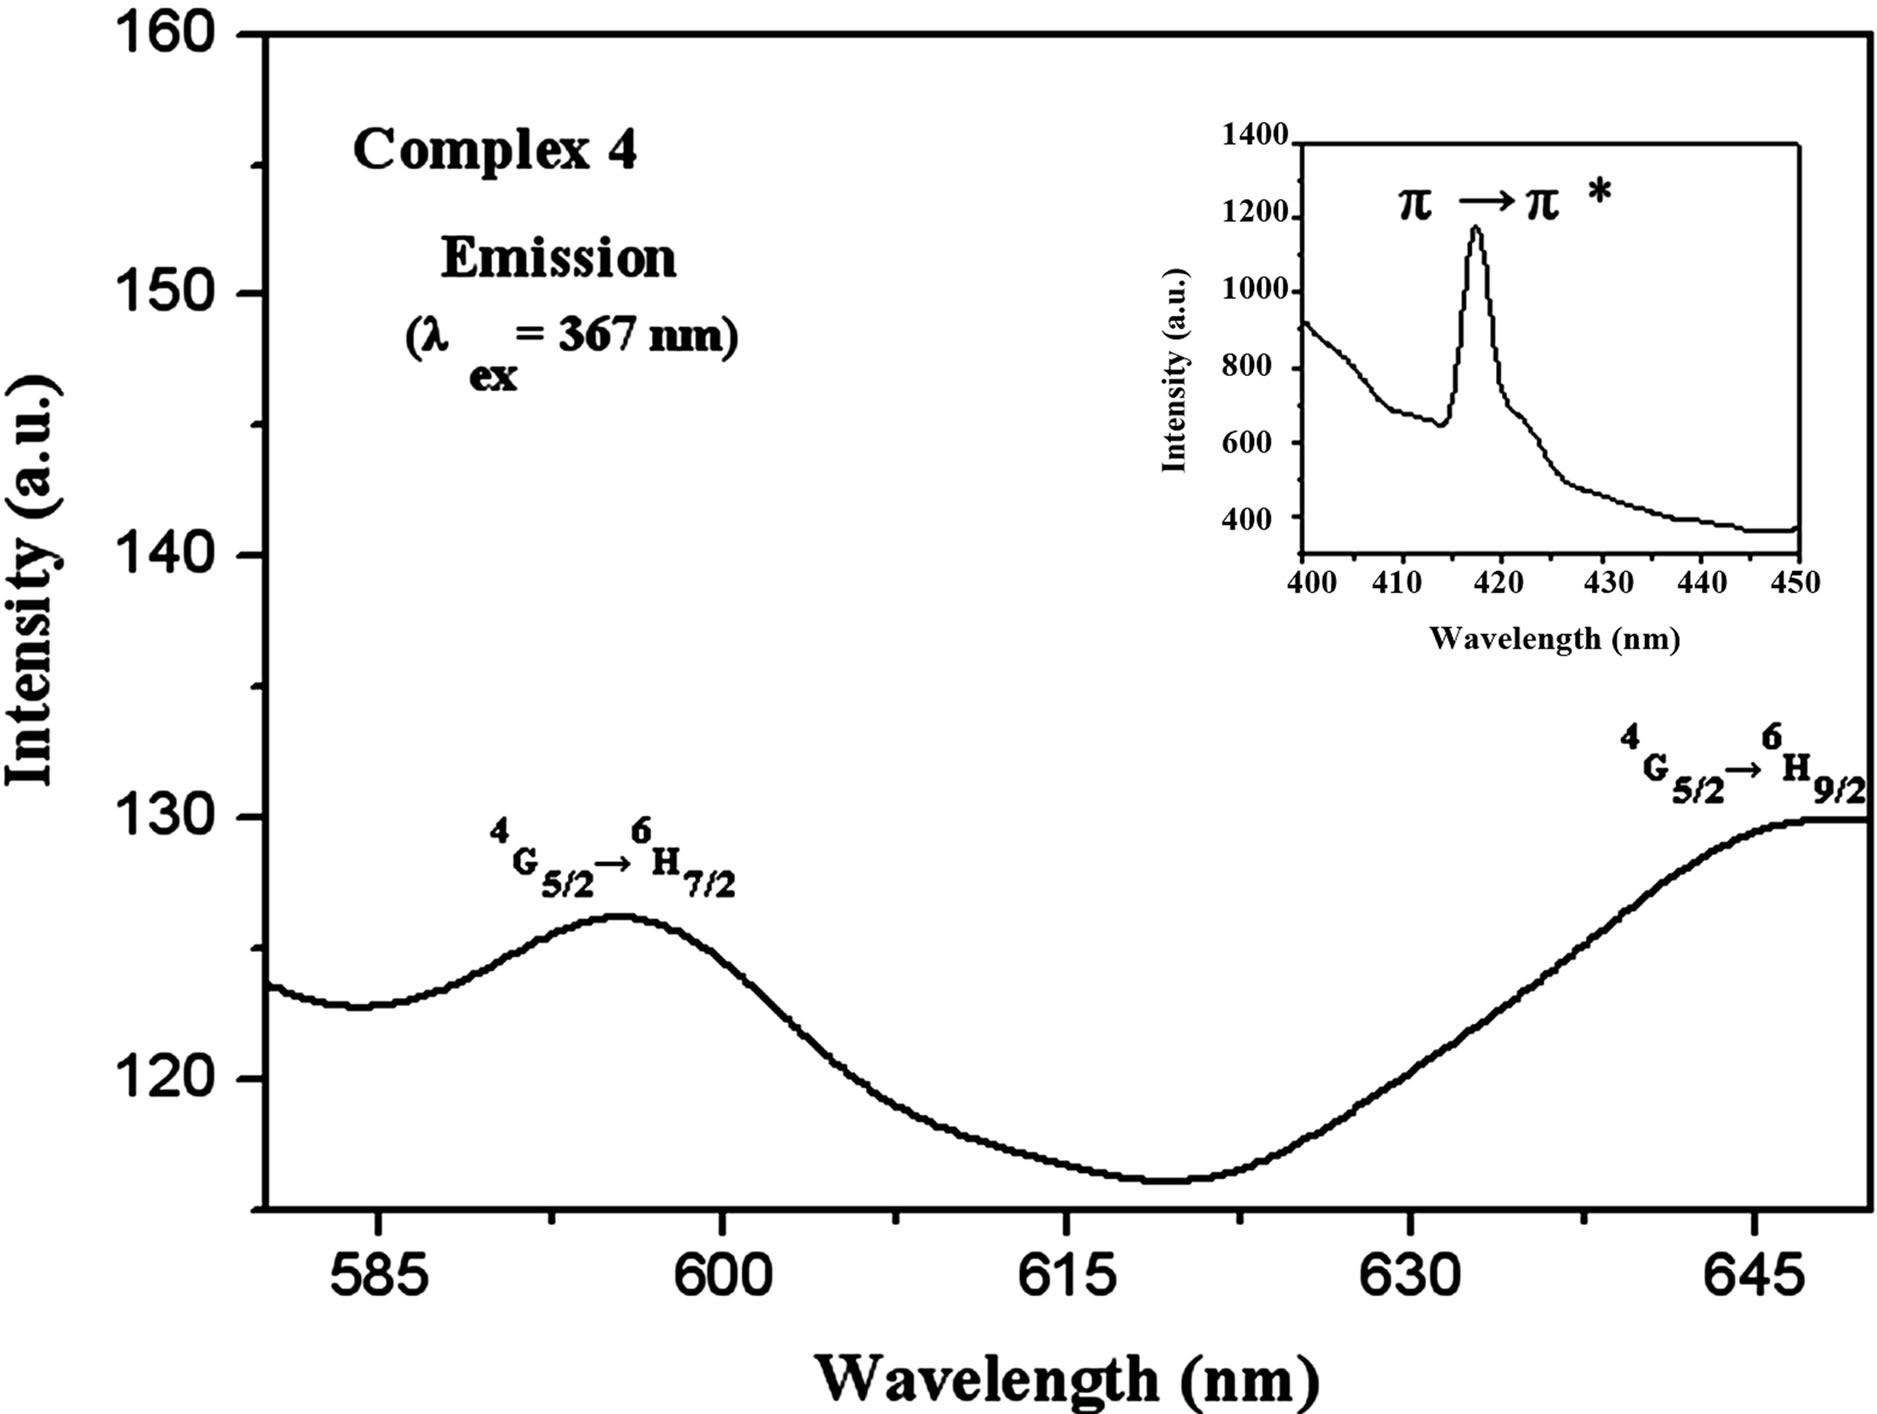
Figure 4. Photoluminescence emission spectra for the complex 4 in the solid state at room temperature.
two luminescence emission peaks at 595 and 647 nm correspond to the characteristic emissions of Sm emissive state 4G5/2 to the 4H7/2 and 4H9/2 levels, respectively. Similar to complex 3, there also exists an intraligand π→π* transition at 417 nm, implying that the energy is not fully transferred from the sulfate ion to the Sm ion. Compared to those of the other three complexes, the emission spectrum of complex 3 showed very weak and broad.
With regard to the luminescent characteristic of the dysprosium complex, the luminescent spectra of complex 5 was determined under excitation of 240 nm with slit width (2.5:2.5). As shown in Figure 5, it presents good luminescent properties with a narrow, sharp and strong emission peak at 482 nm assigned to the blue insensitive transitions 4F9/2→6H15/2. Additionally, it should be mentioned that no further emission peaks were observed, indicating that the energy is fully transferred from the sulfate ion to the Dy ion. This is different from the other three complexes in which the characteristic emission bands of the sulfates ions are found, suggesting that the more efficient ligand-to-metal energy transfers occur in dysprosium coordination polymer. Furthermore, the one strong emission band suggests that this homochromy effect possesses good optical application, which is rare in other dysprosium coordination polymers.
The luminescent properties regarding complex 6 were studied at the excitation wavelength of 370 nm with a slit width (2.5:2.5). Figure 6 gives the emission spectra of this complex. The characteristic 5D0→7FJ (J = 1→4) transitions of the Eu(III) ions at 595, 619, 653, and 689 nm show well an efficient ligand-to-Eu energy transfer. The quite weak emission peak 5D0→7F0 at 580 nm are attributed to the symmetry-forbidden emission of the Eu(III) ions in these coordination polymers. The 5D0→ 7F1 emission bands pertain to the prominent magnetic dipole transitions, which are almost uninfluenced by the coordination environment. On the other hand, the outstanding 5D0→7F2 emission bands, possessing a strong electric dipole character, are hypersensitive to
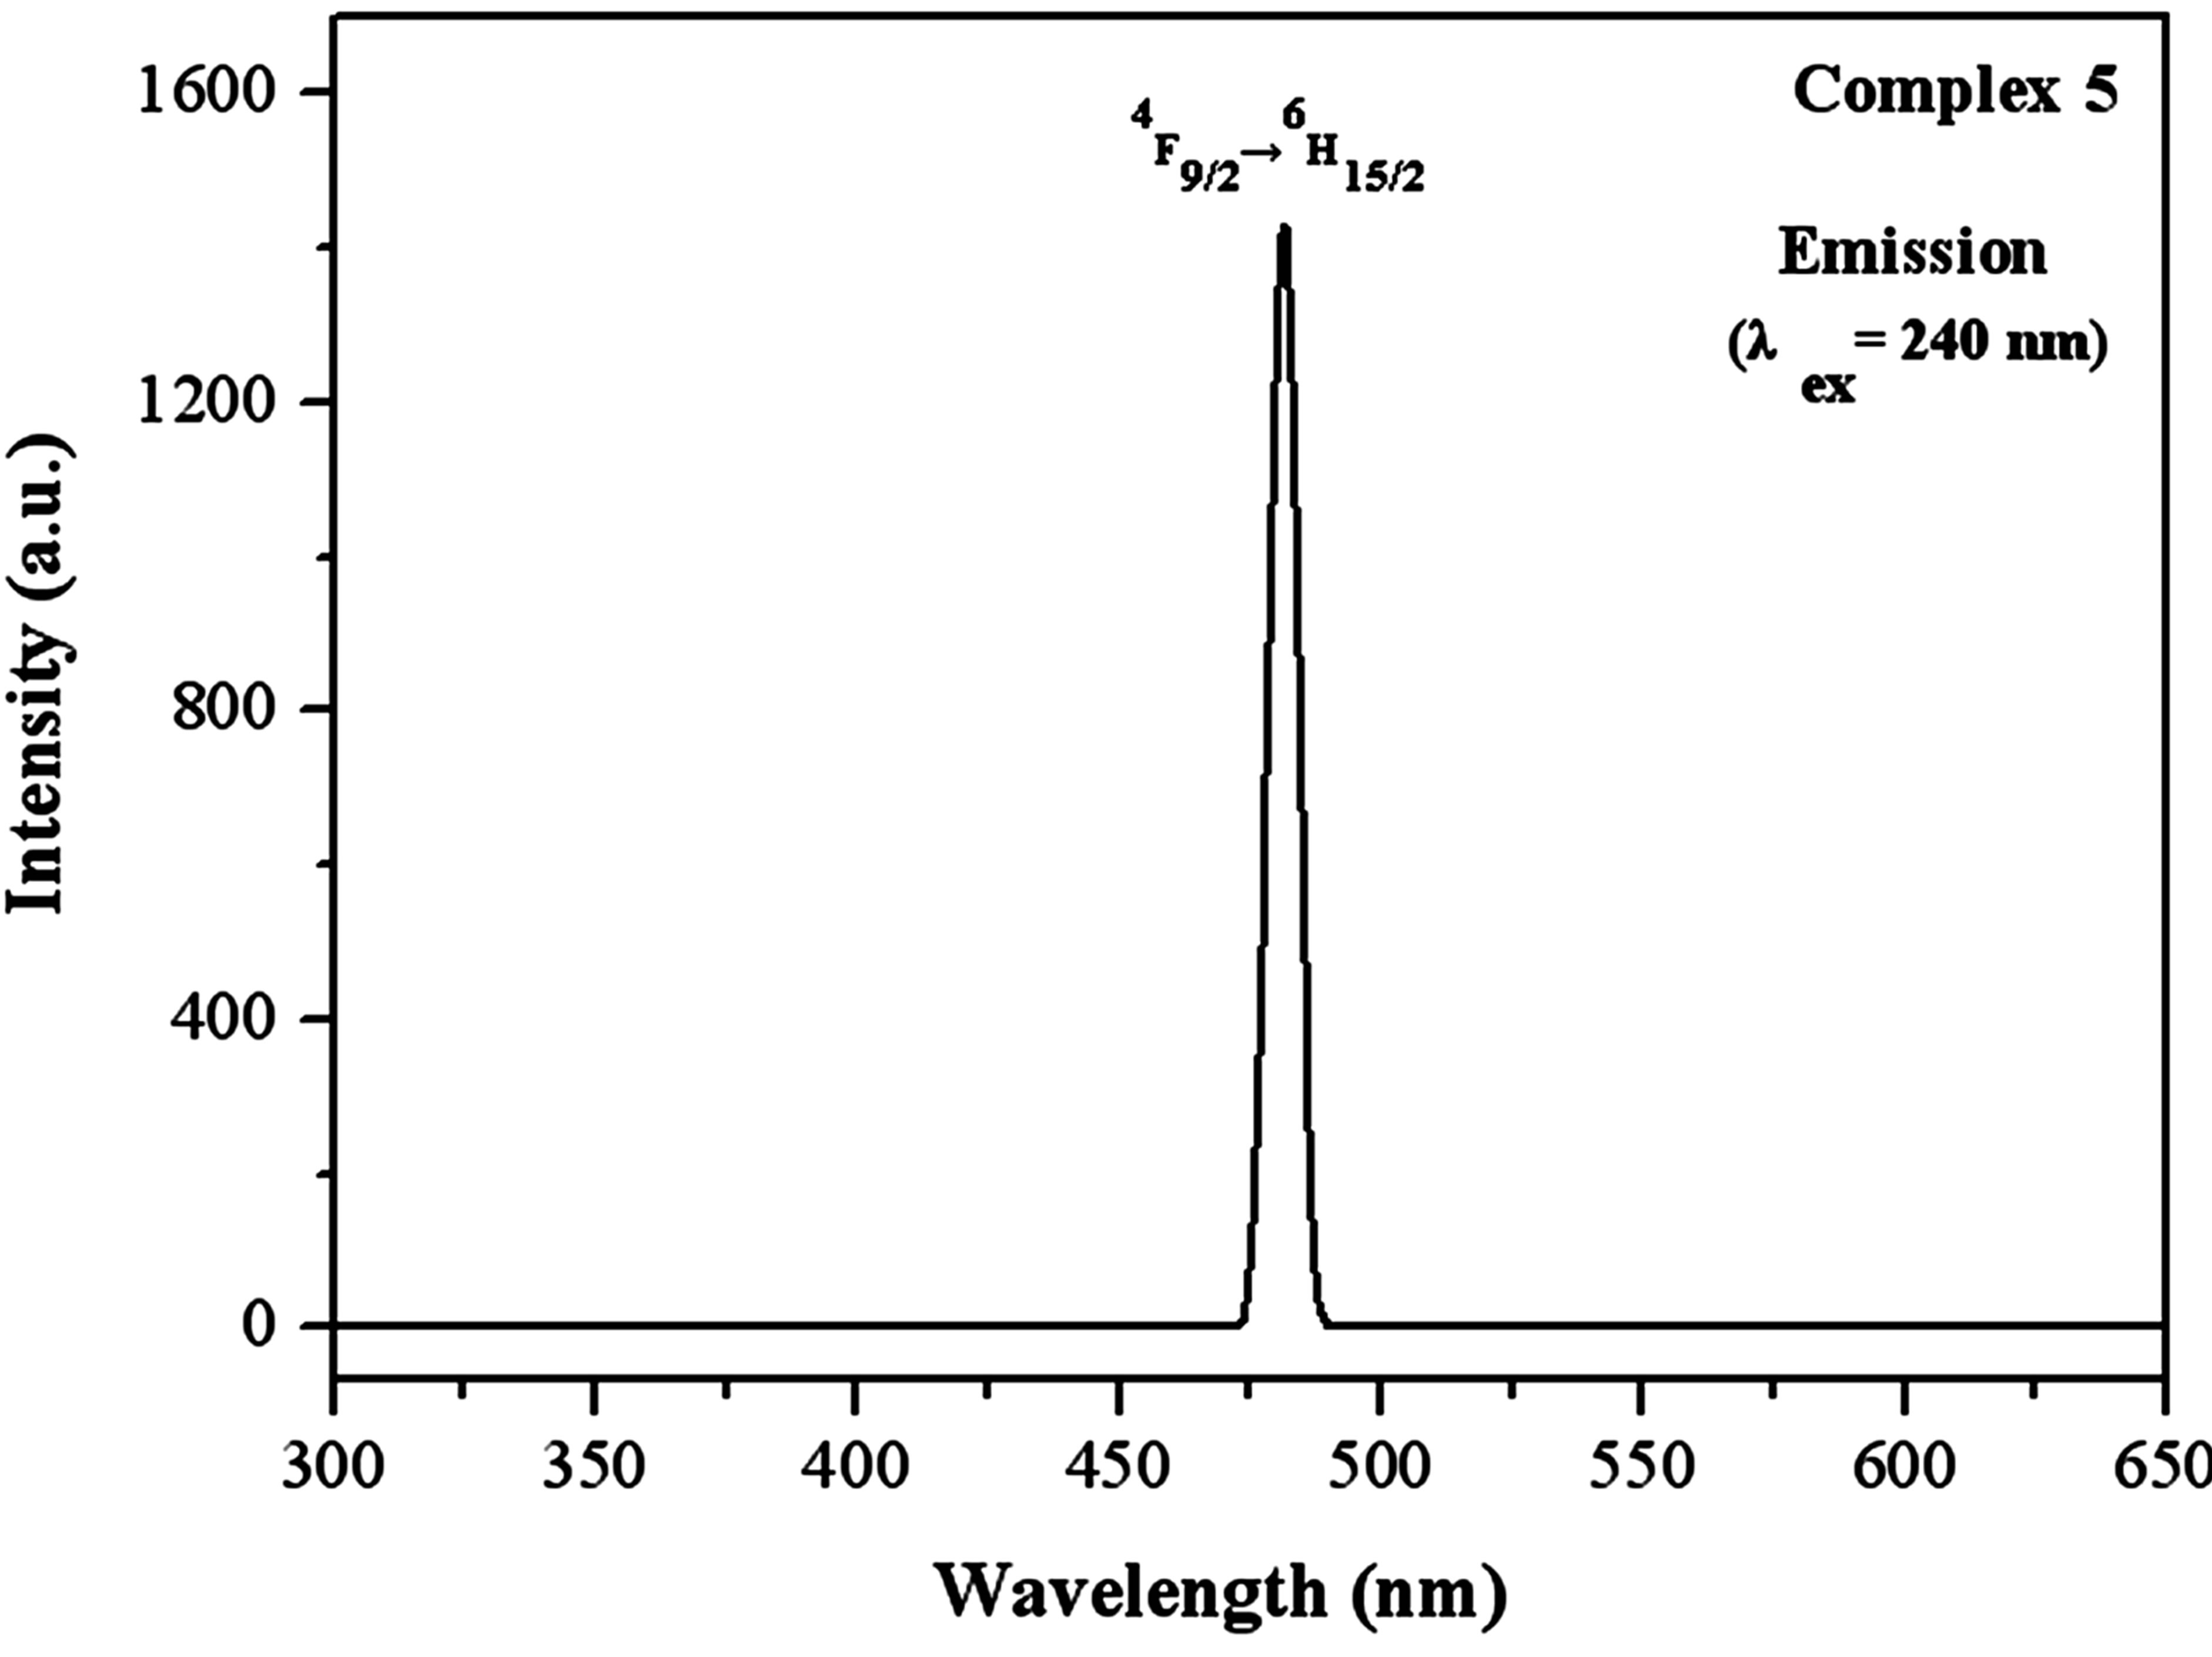
Figure 5. Photoluminescence emission spectrum for complex 5 in the solid state at room temperature.
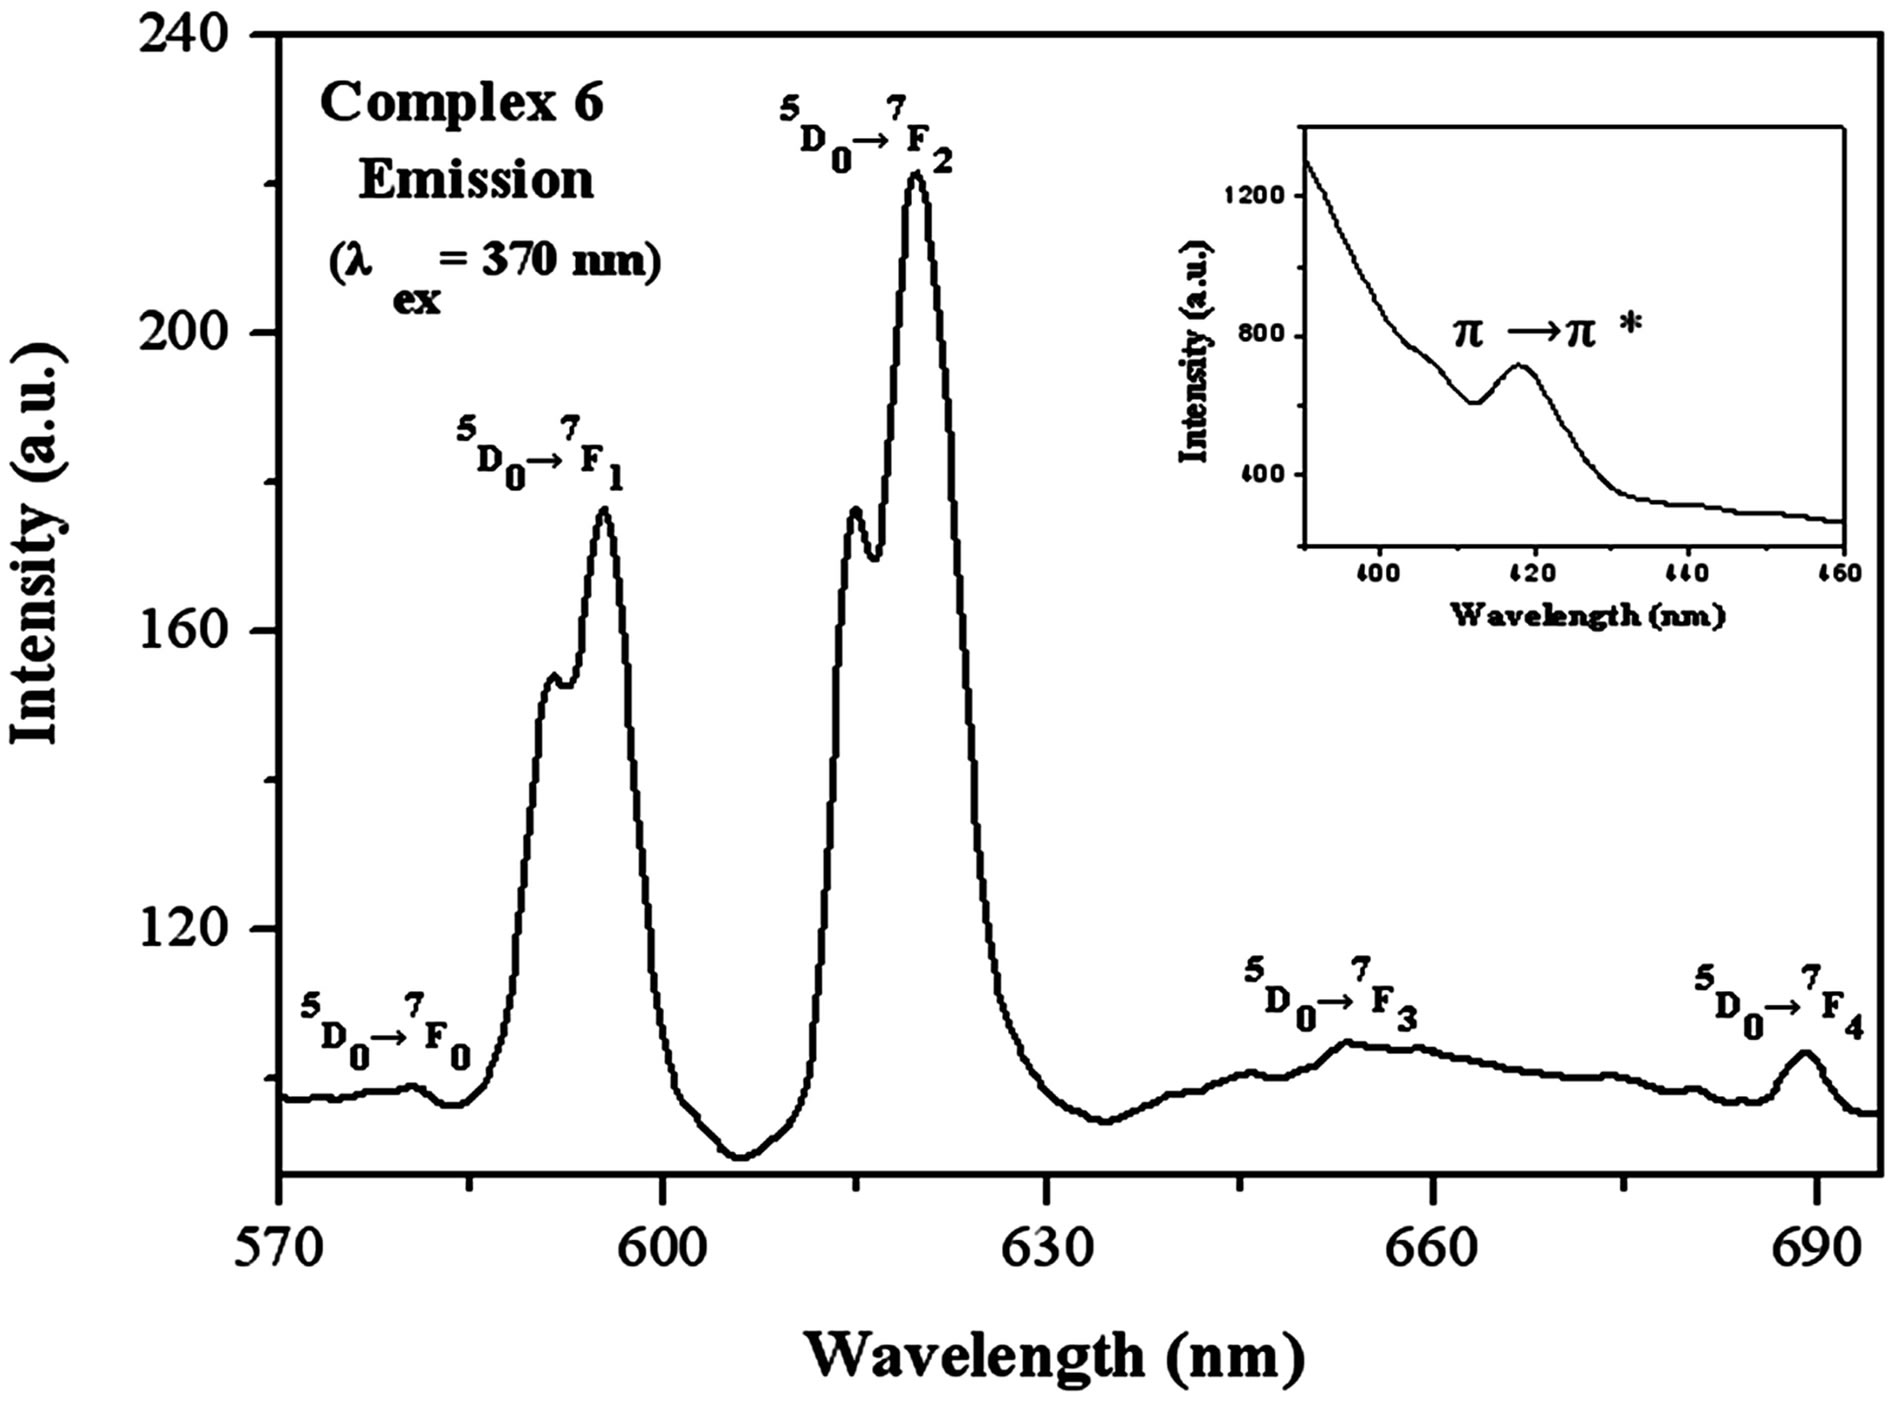
Figure 6. Photoluminescence emission spectra for complex 6 in the solid state at room temperature.
the coordination environment. Therefore, we can take advantage of the relative intensity disparity of these transitions to probe the nature of the linker environment and herein Eu luminescence can act as a sensitive probe of the lanthanide coordination environment [63,64]. In particular, the ratio of the intensities of the (5D0→7F2): (5D0→7F1) transition is very sensitive to the symmetry of the Eu(III) center. In the spectra, it can be obviously seen that the intensity of the electric dipole transitions 5D0→7F2 are much stronger than that of the magnetic dipole transition 5D0→7F1, which implies that the Eu(III) ions in these complexes are located in lower symmetric coordination environments. This is in agreement with the result of the single X-ray analysis. Additionally, the strongest emission peaks in the 5D0→7F1 and 5D0→7F2 transition region generate splitting of energy, which can be also ascribed to the Eu(III) centers in asymmetric sites in these complexes. Among these emission lines, 5D0→7F2 transitions are most striking, indicating intense red luminescence of complex 6. Additionally, there also exits a π→π* transition, which is similar to that of the complex 3 and 4.
3.4. TG Properties
Thermal analysis shows that the complexes are considerably stable, especially complex 6. As shown in Figure 7(a), the weight loss of 20.01% in the range 91˚C - 294˚C can be attributed to the loss of the coordinated water molecules (cal. 21.07%). Then the complexes stayed at a very stable stage until 800˚C. The collapse of the fragment in the second stage may be due to the loss of SO3, and the final residual is Ln2O3. In comparison, the thermal stability of complex 6 is better, and it didn’t decompose until 700˚C because of the absence of water in the structure (Figure 7(b)).
3.5. Catalysis Study
In the primary stage of our work, the oxidation reaction of cyclohexane to produce cyclohexanone and cyclohexanol was employed as a model reaction and complex 1 was examined as a catalyst. The reaction was carried out in a solvent of CH3CN at 40 centigrade. It showed small TON value, indicating that the capability of the catalysts for the reaction of cyclohexane conversion is weak. A blank experiment conducted in the absence of the catalyst, under the above reaction conditions, found that no products were detected. For the sake of compareson, complexes 2-8 were also used as catalysts. As shown in Table 7, similarly, there is very low catalytic activity with TON values in the range of 0.68 - 4.83, although cyclohexane can reach high conversion after the reaction for some time. It is found that the order of the catalytic activity is 8 > 2 > 5 >3 > 7 > 4 > 6 > 1 when
 (a)
(a)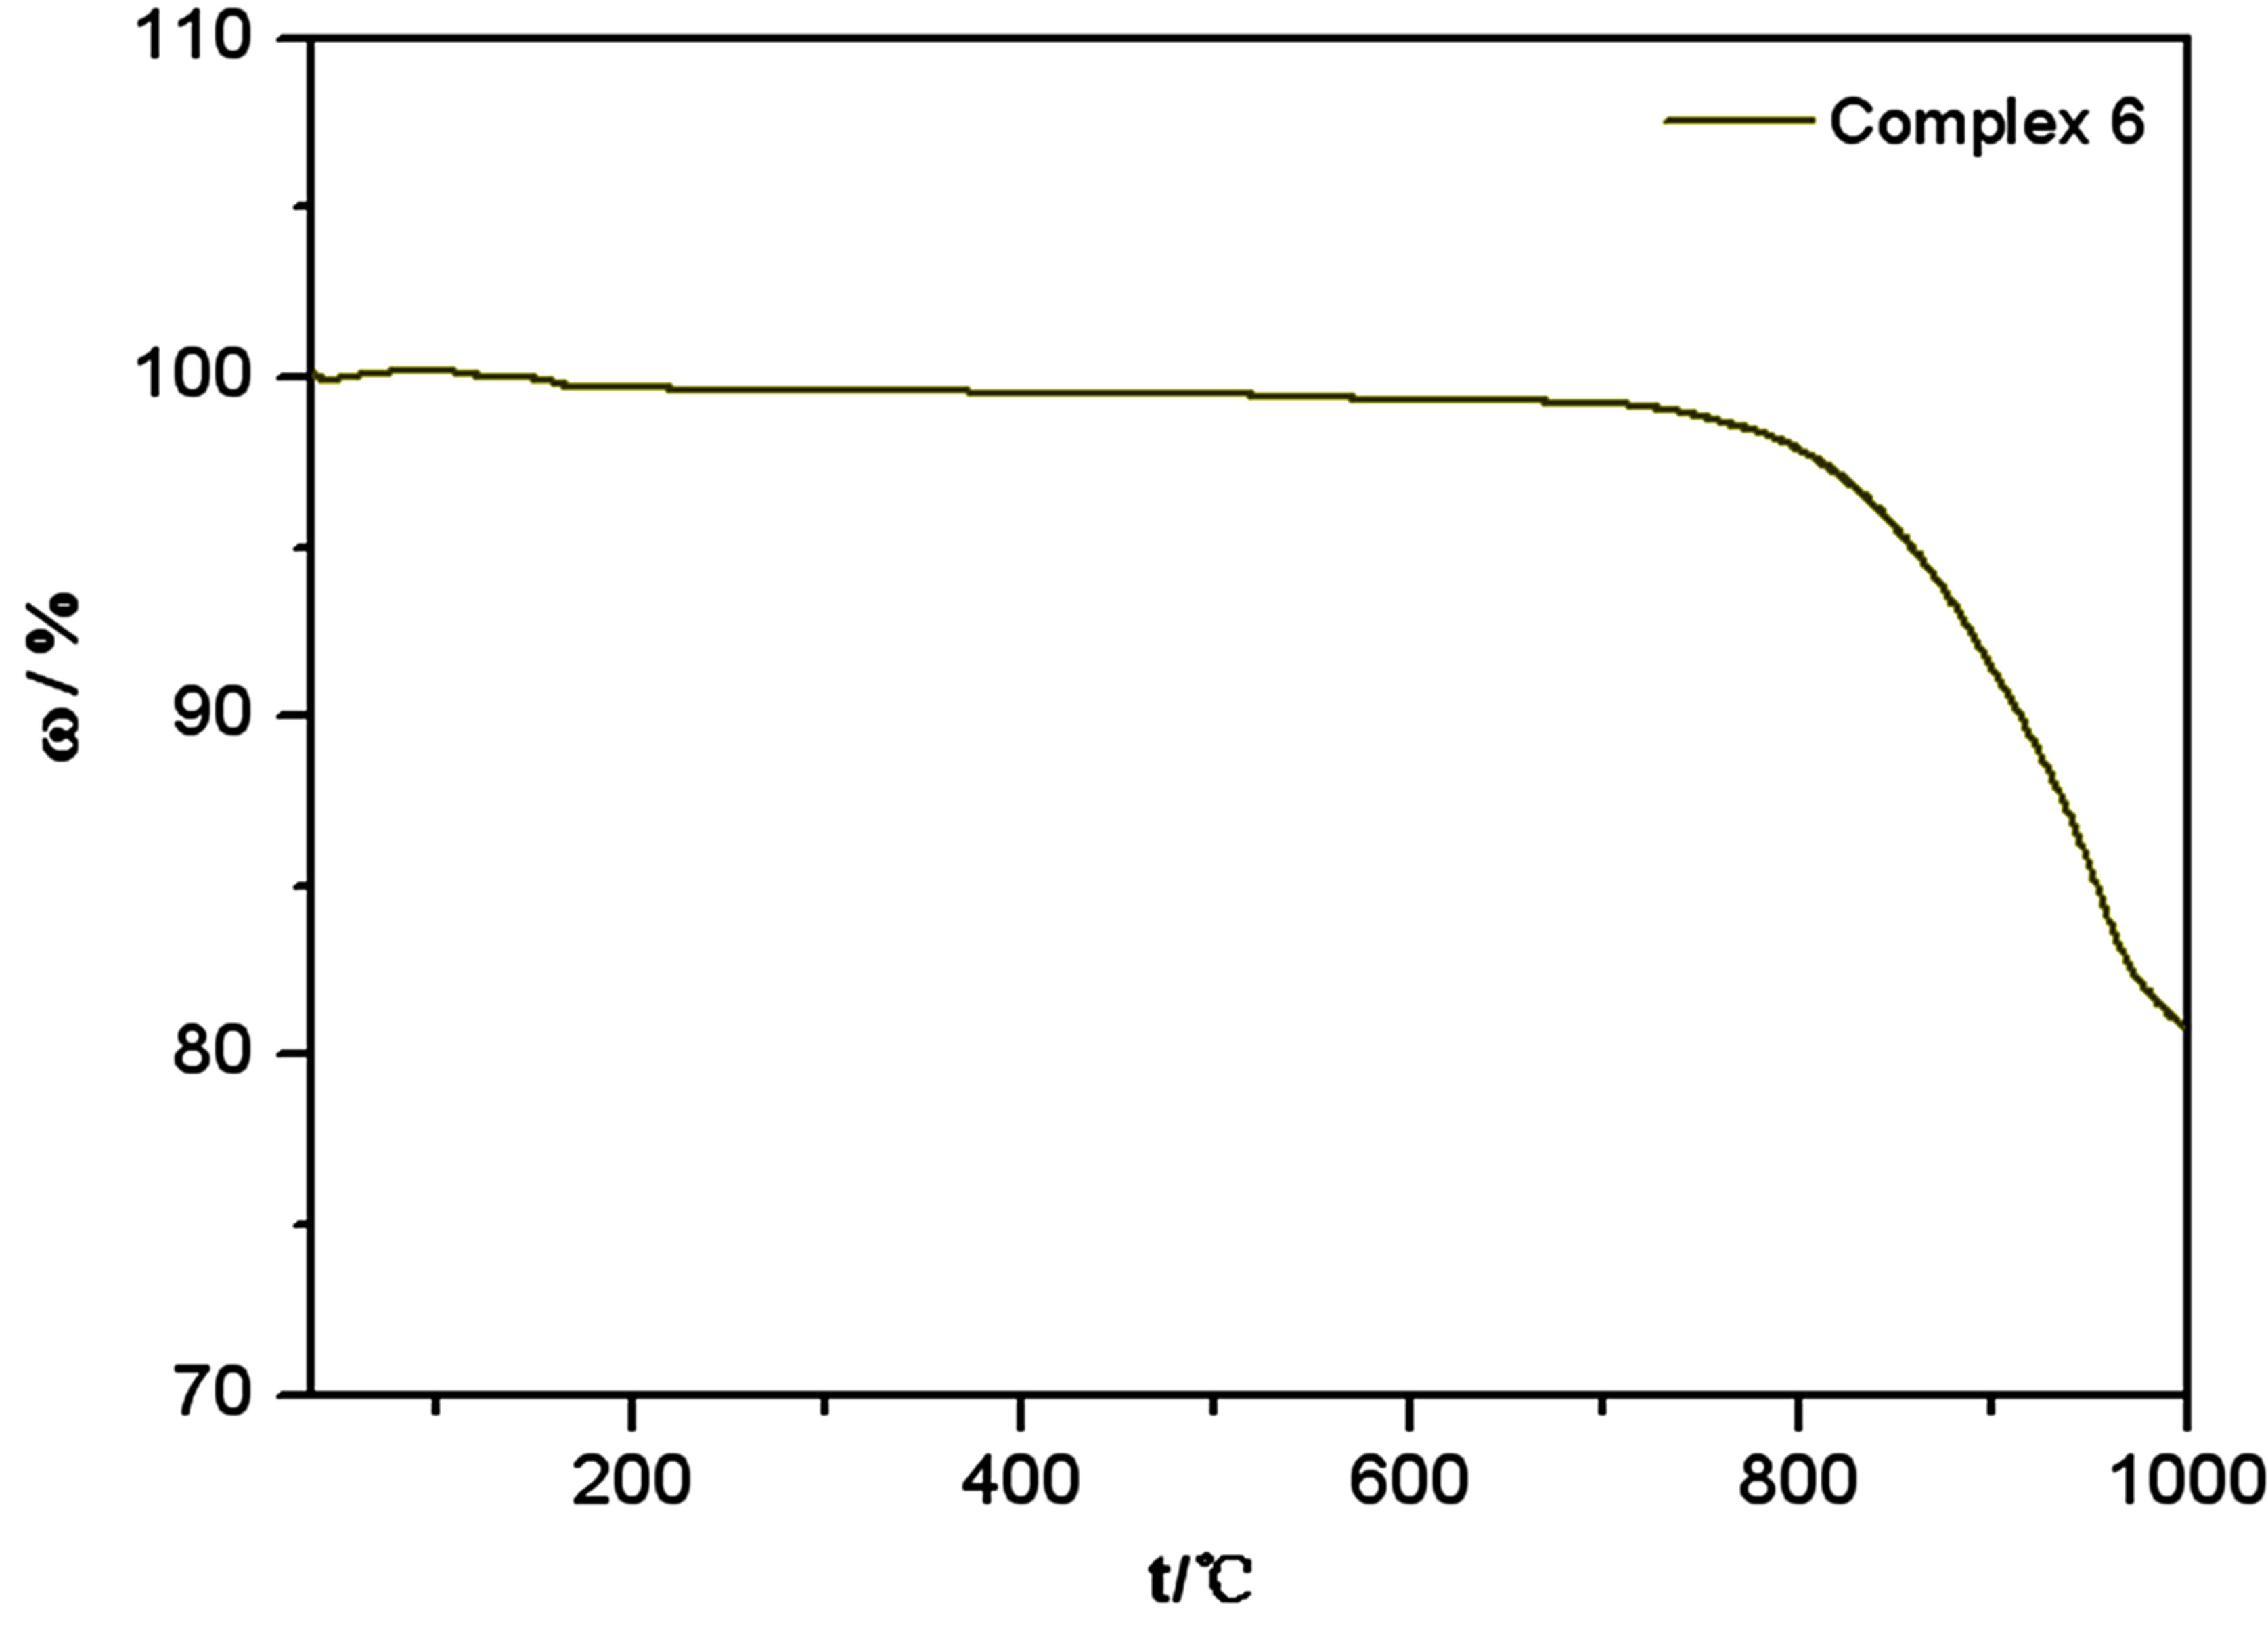 (b)
(b)
Figure 7. (a) TG curve of Ln2(SO4)3(H2O)8 (Ln = Sm(4), Ho(8)); (b) TG curve of EuK(SO4)2(6).
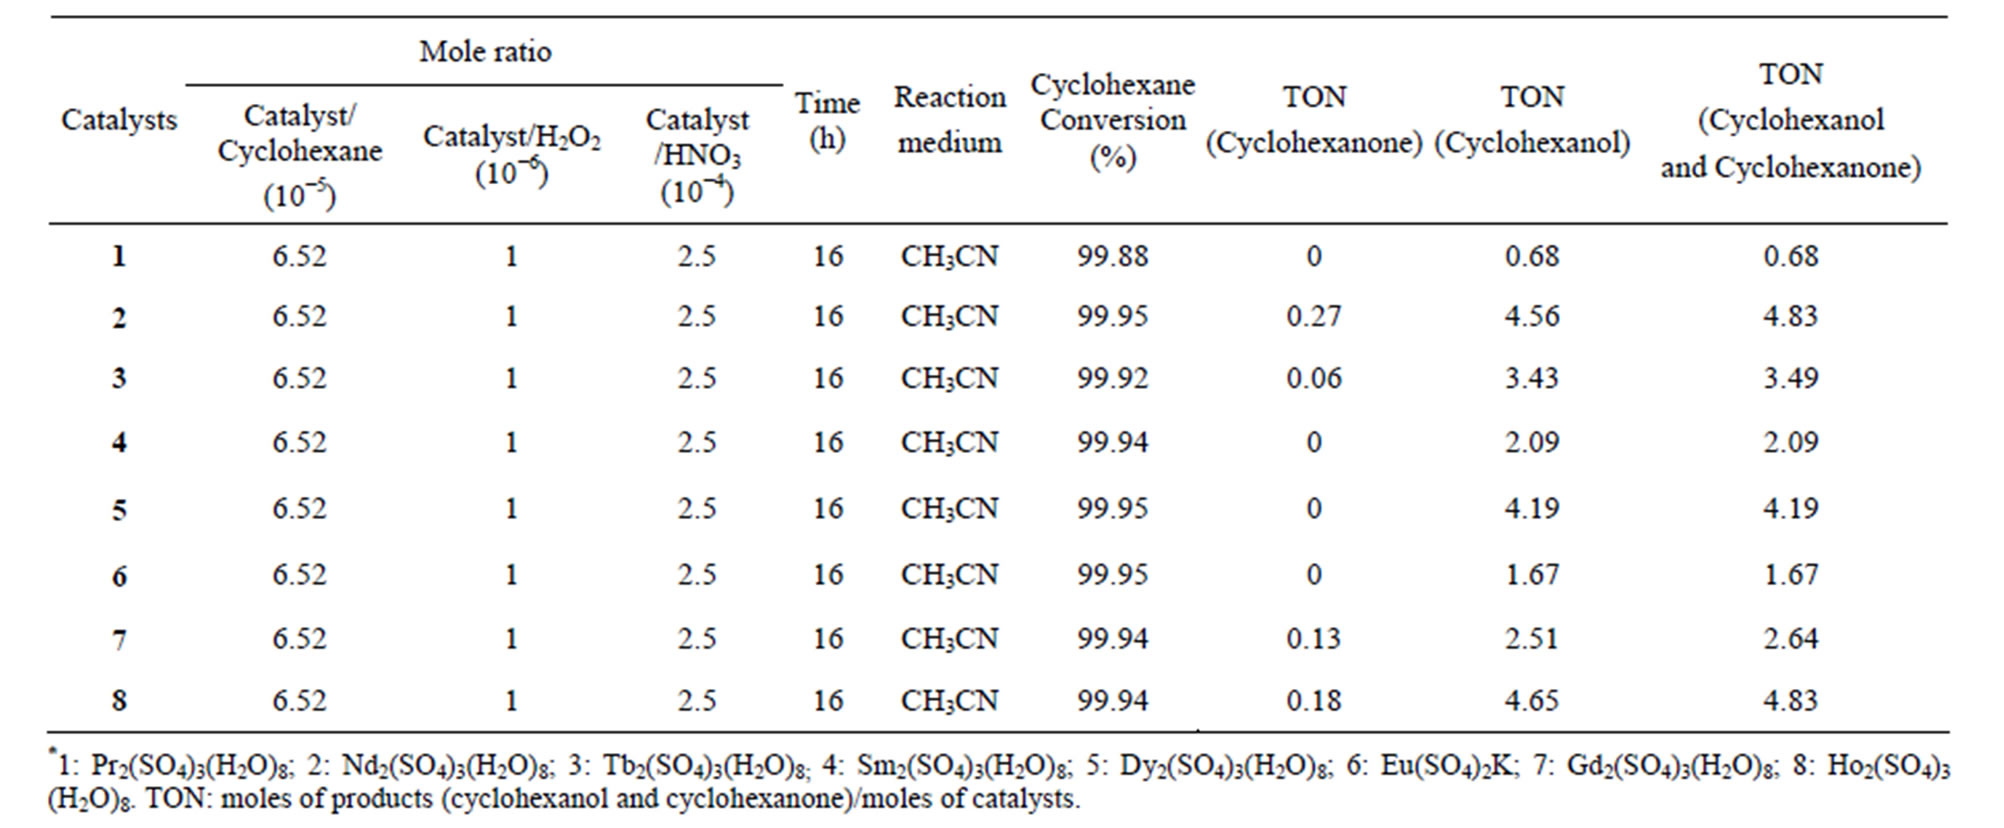
Table 7. Data of oxidation for cyclohexane with complexes 1-8 as catalysts in the system of /H2O2/HNO3/CH3CN at 40˚C*.
comparing the catalytic activity of the complexes 1-8. In particular, the catalytic efficiency of the complexes 2 and 8 is found to be much better than other complexes. The results also showed that in the cases of 1, 4, 5 and 6, the final products were only cyclohexanol, which indicated that the selectivity of those complexes is very high, and therefore, complexes of 1, 4, 5 and 6 may possess a value for potential application.
4. CONCLUSION
In summary, we have reported two kinds of simple, high-yield and pure phase synthesis of 2-D and 3-D framework lanthanide sulphate coordination complexes, Ln2(SO4)3(H2O)8 (Ln = Pr (1), Nd (2), Tb (3), Sm (4), Dy (5), Gd (7), Ho (8)) and EuK(SO4)2 (6). The synthesis of all complexes have demonstrated that the lanthanide sulfate complexes were designed and prepared by using appropriate solvent and SDAs. On the other hand, all these complexes represent a certain activity in catalysis. These Tb, Sm, Dy and Eu complexes exhibit different luminescence characterizations of Tb3+, Sm3+, Dy3+ and Eu3+, respectively. The luminescence in the solid state indicates the complex 5 is an excellent candidate for pure fluorescent materials.
5. ACKNOWLEDGEMENTS
This work was supported by grants from the National Natural Science Foundation of China (Grant No. 21071071) and the State Key Laboratory of Inorganic Synthesis and Preparative Chemistry, College of Chemistry, Jilin University, Changchun 130012, P. R. China (Grant No. 2013-05).
Supporting Information Available
Tables S1-S6 show the selected bond lengths and bond angles of the complexes 1, 2, 4, 5, 7, 8; Tables S7-S12 list the hydrogen bonds of the complexes 1, 2, 4, 5, 7, 8; Figures S1-S8 present the PXRD patterns for the simulations based on the X-ray single crystal diffraction and the experimental samples of complexes 1-8; Figures S9 and S10 show the infrared spectra of complexes 1-8, and Figures S11-S16 unfurl the coordination environments of lanthanide atoms, the 2D polyhedron lays, the 2D topology network and the 3D hydrogen bonding network structures in complexes 1, 2, 4, 5, 7 and 8. Tables of atomic coordinates, isotropic thermal parameters, complete bond distances and angles are deposited in the Cambridge Crystallographic Data Center. Copies of those tables can be obtained free of charge by contacting the Director of the CCDC, 12 Union Road, Cambridge, CB2 1EZ, UK (fax + 44-1223-336033; email deposit@ccdc.cam.ac.uk; http://www.ccdc.cam.ac.uk), and quoting the publication citations and deposition numbers CCDC 904695 (1), 904696 (2), 904697 (3), 904698 (4), 904699 (5), 904700 (6), 904701 (7) and 904702 (8).
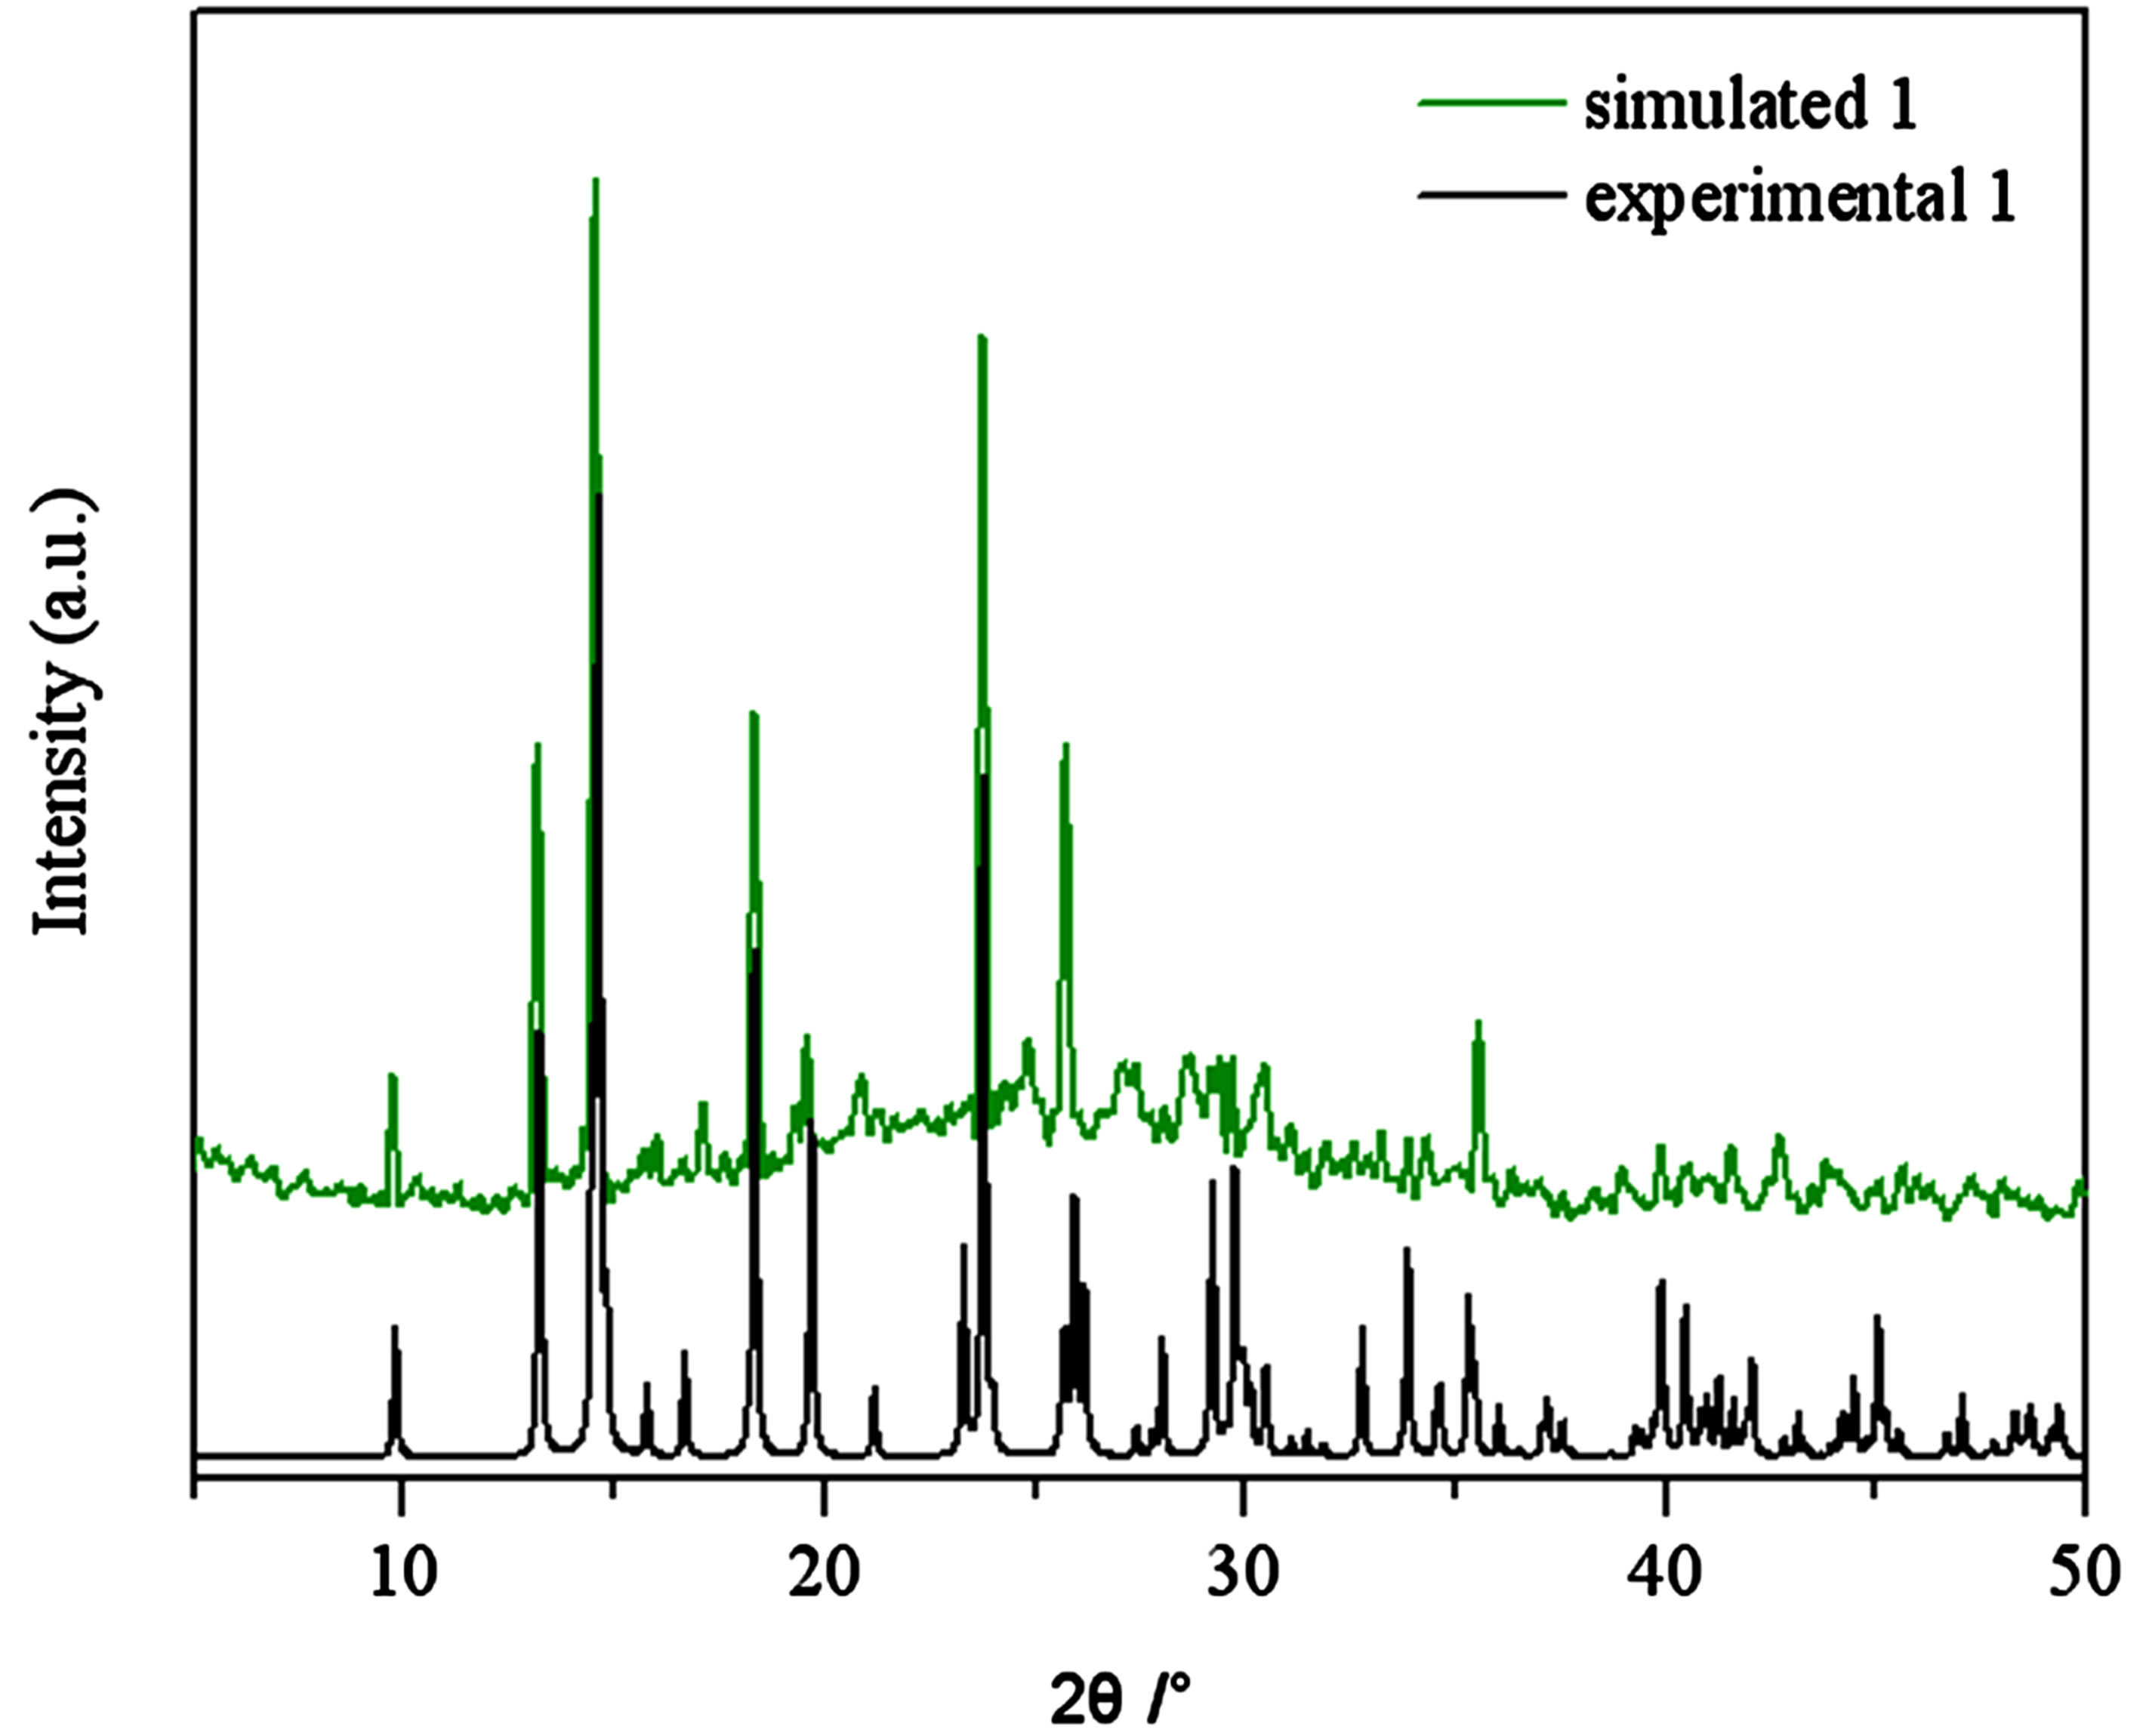
Figure S1 . PXRD patterns for the simulated based on the x-ray single crystal diffraction and the experimental samples of complexes 1.
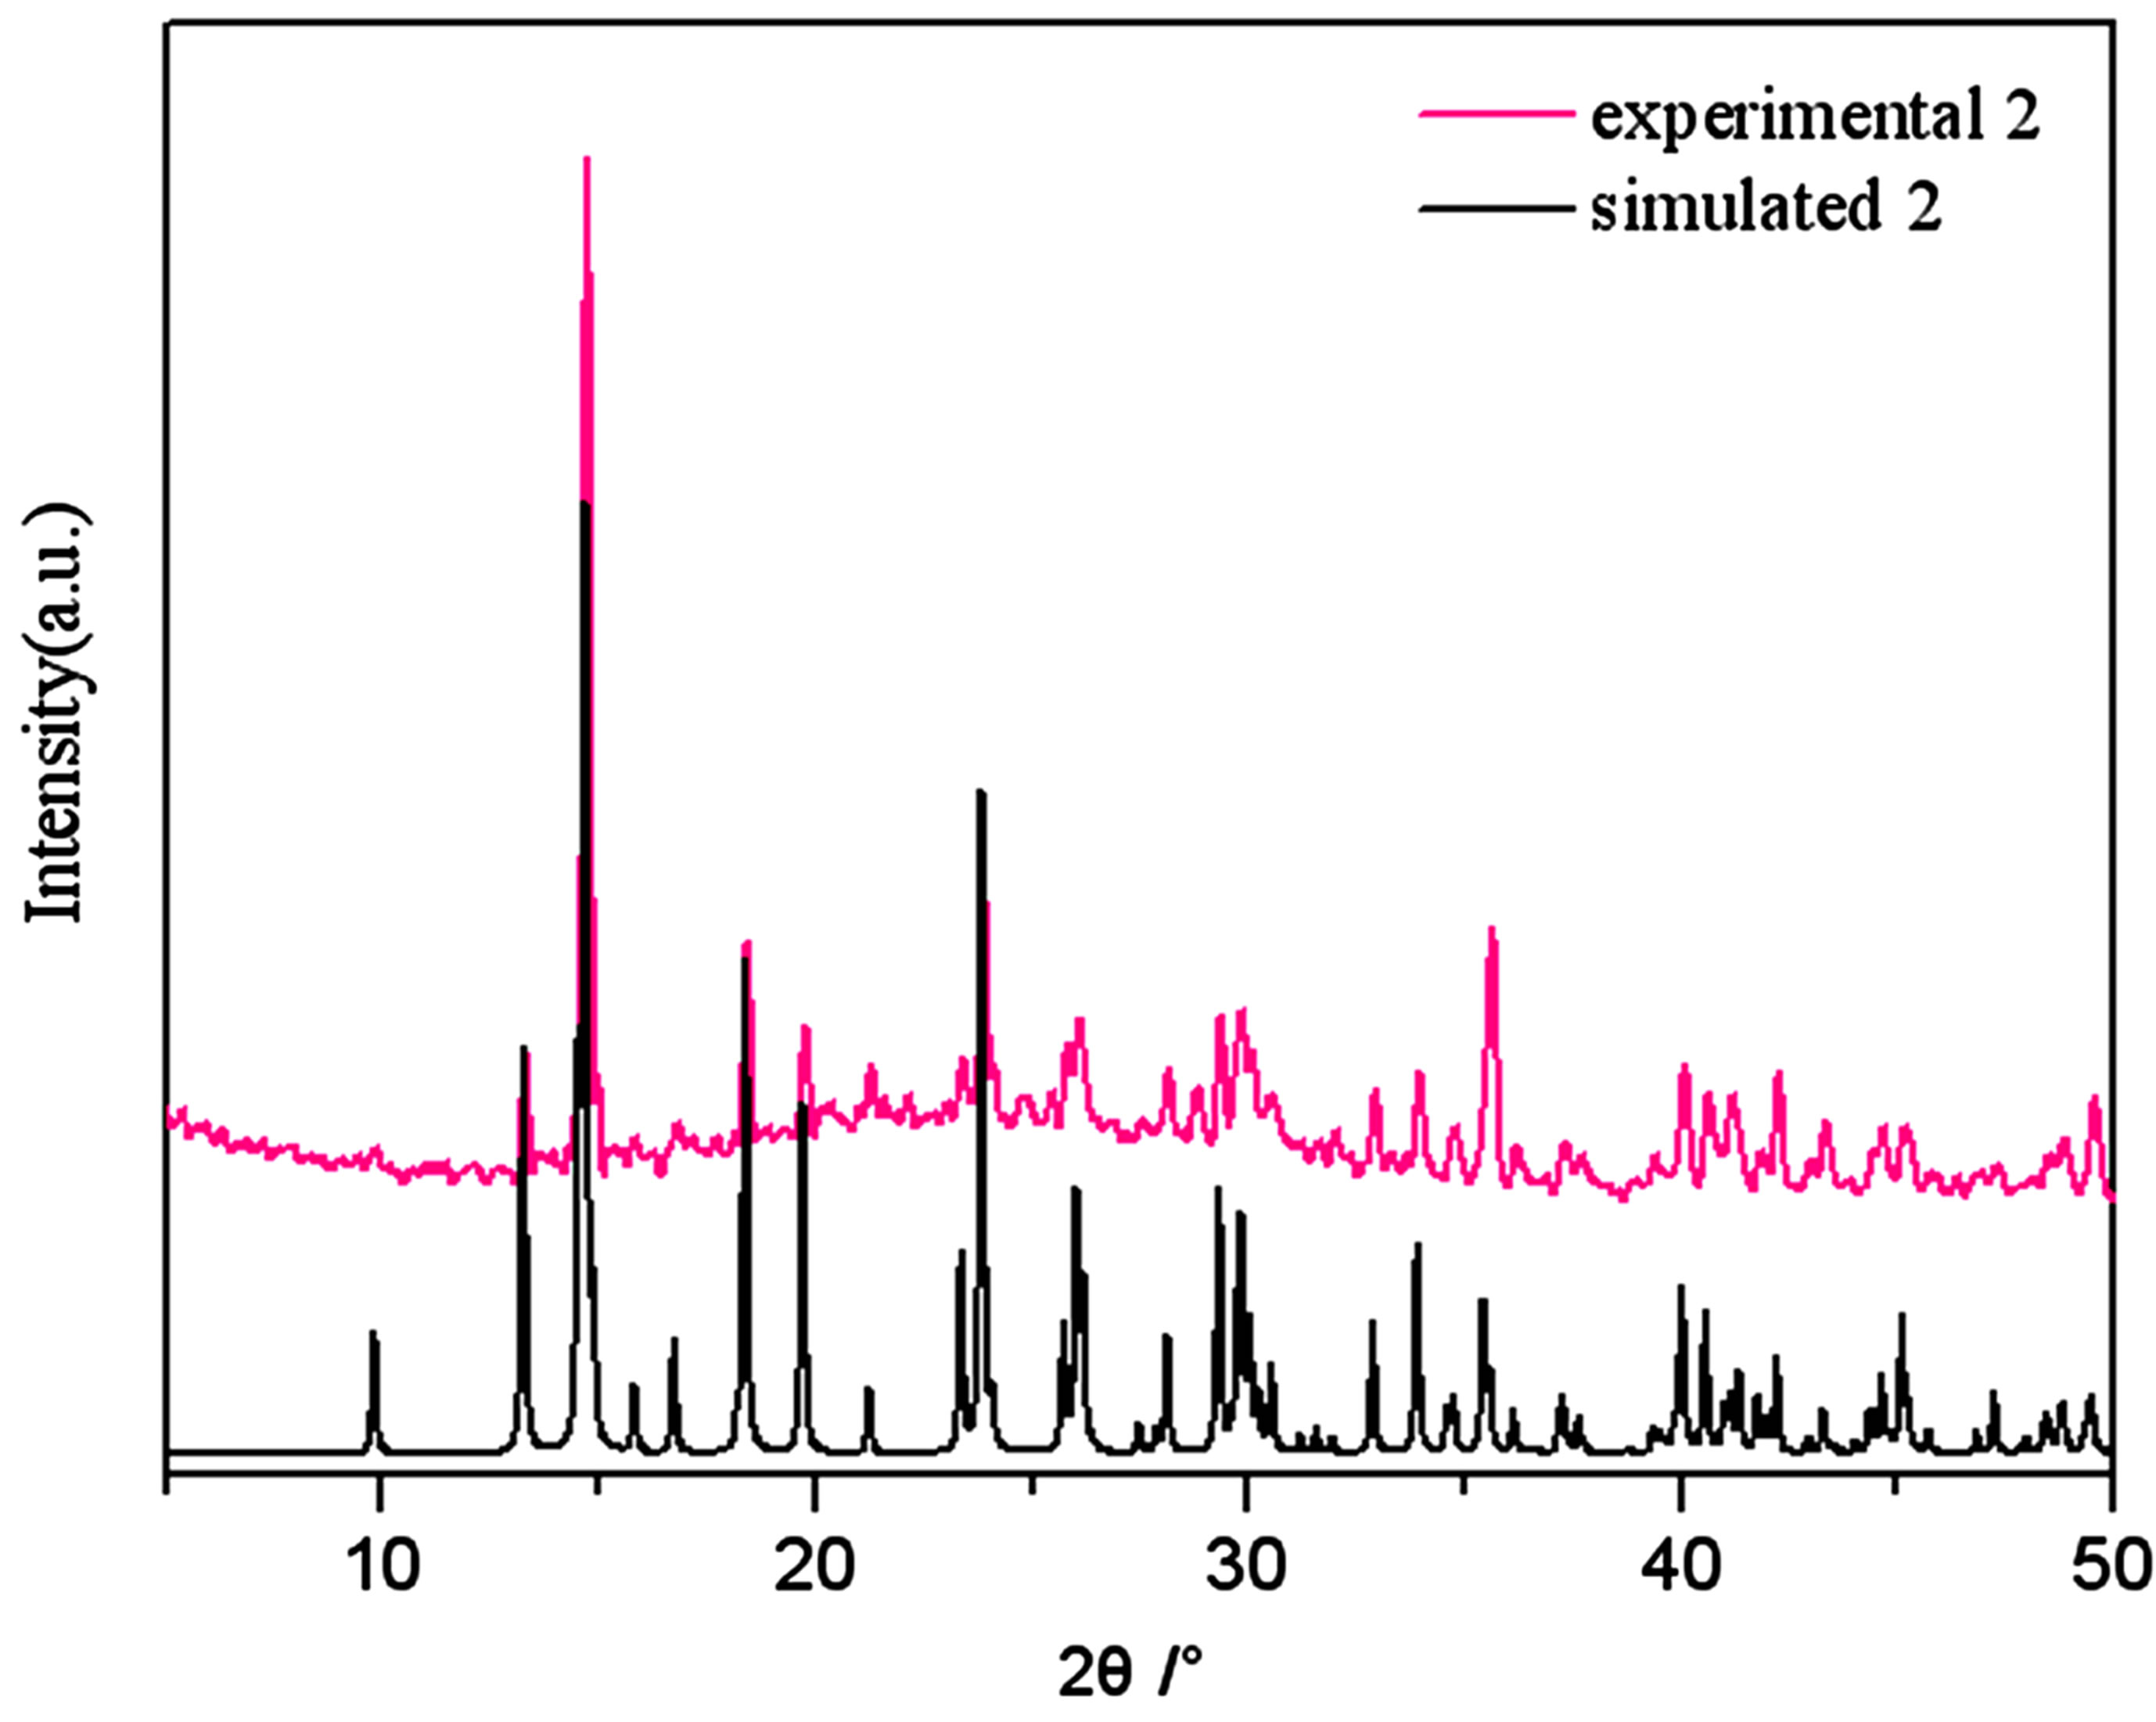
Figure S2 . PXRD patterns for the simulated based on the x-ray single crystal diffraction and the experimental samples of complexes 2.
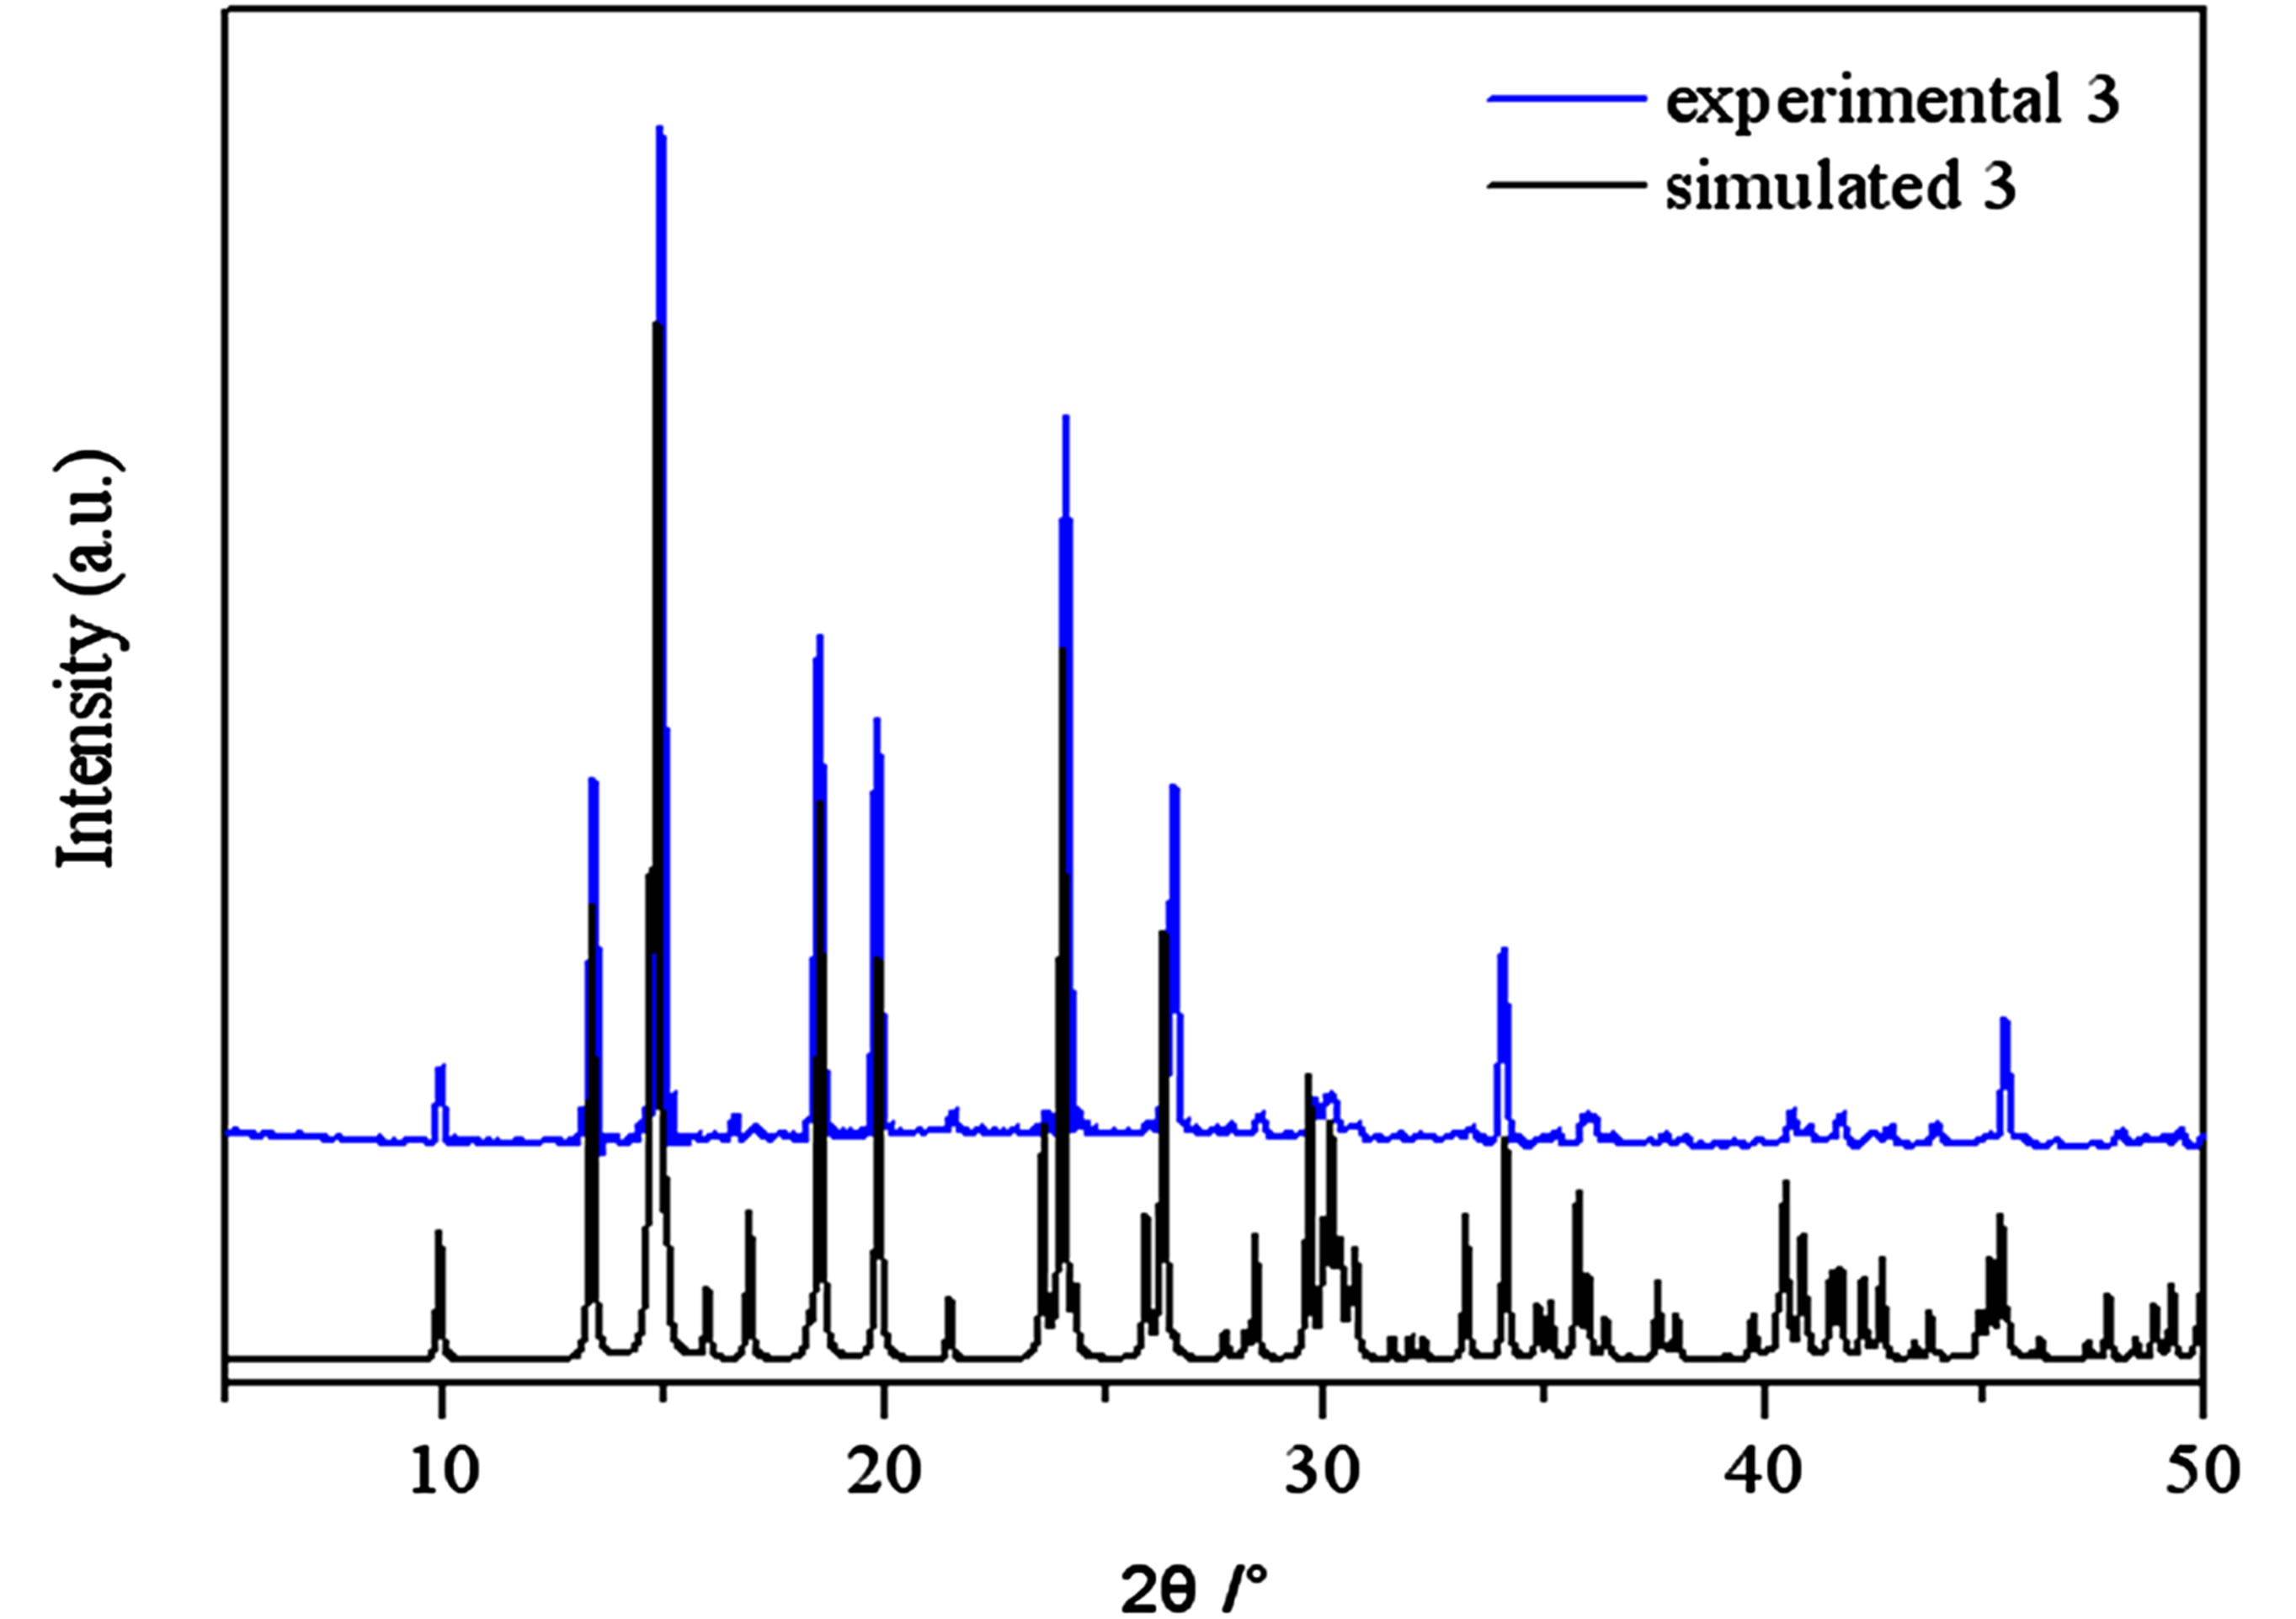
Figure S3 . PXRD patterns for the simulated based on the x-ray single crystal diffraction and the experimental samples of complexes 3.
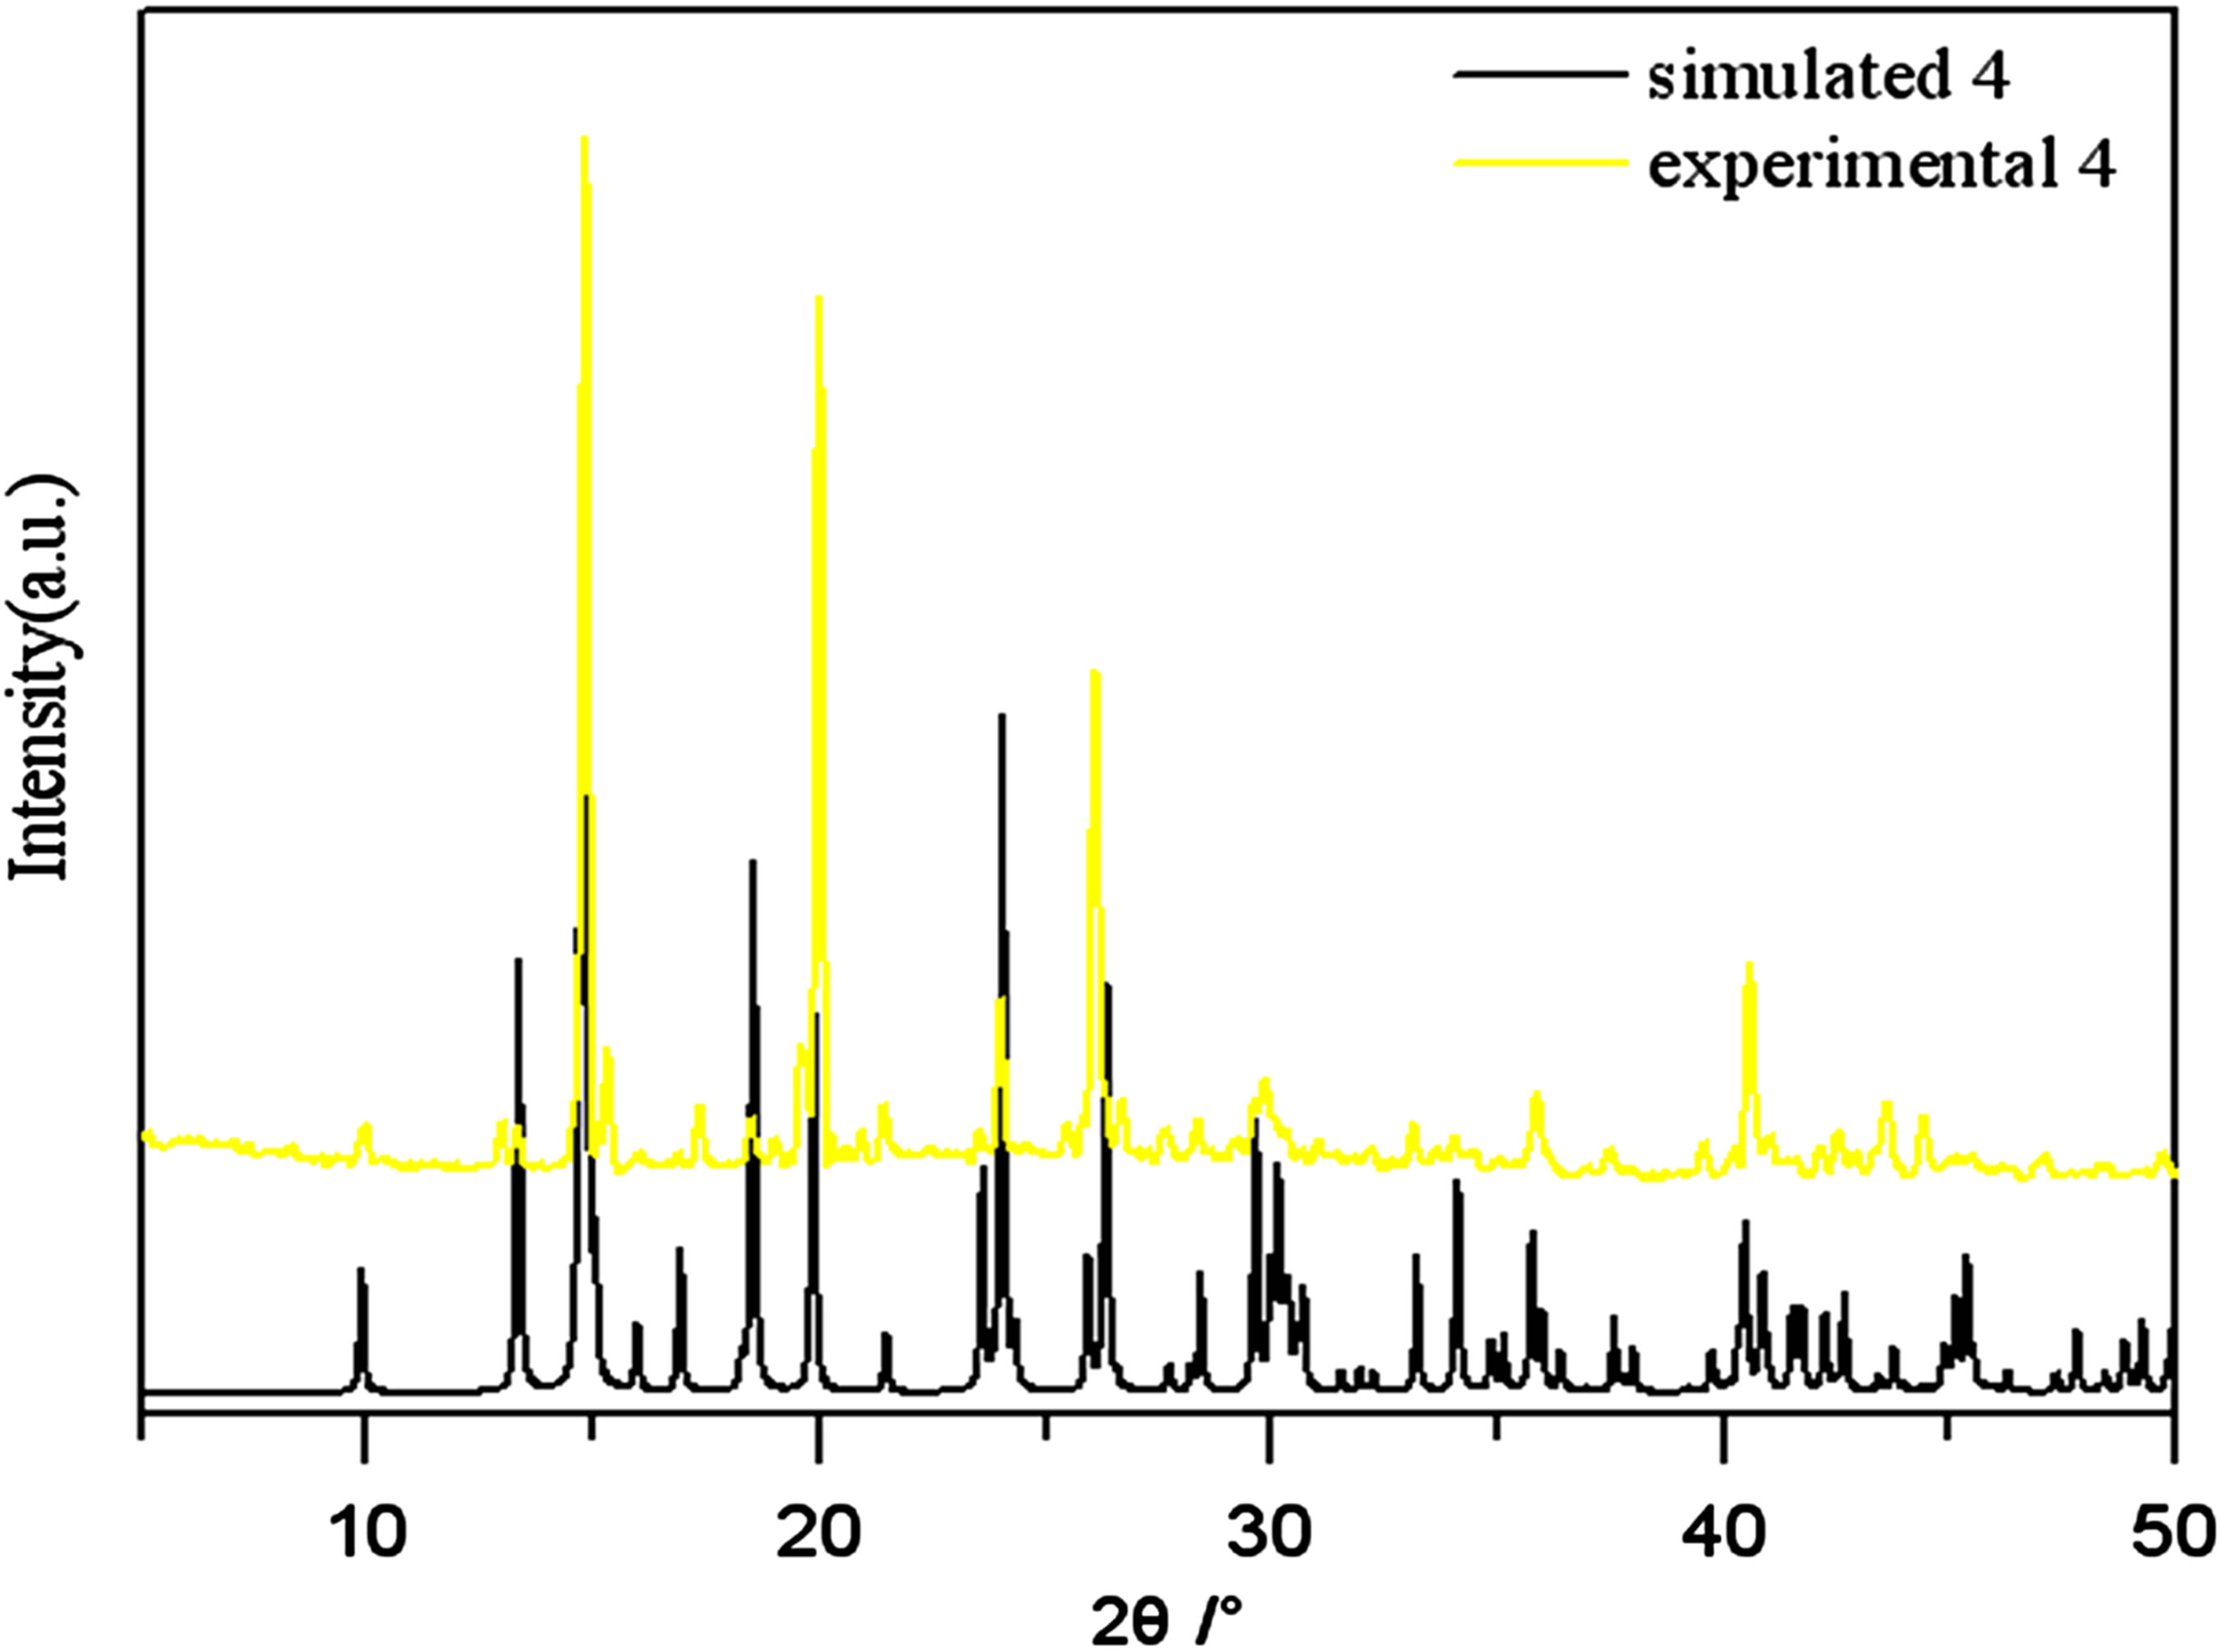
Figure S4. PXRD patterns for the simulated based on the x-ray single crystal diffraction and the experimental samples of complexes 4.
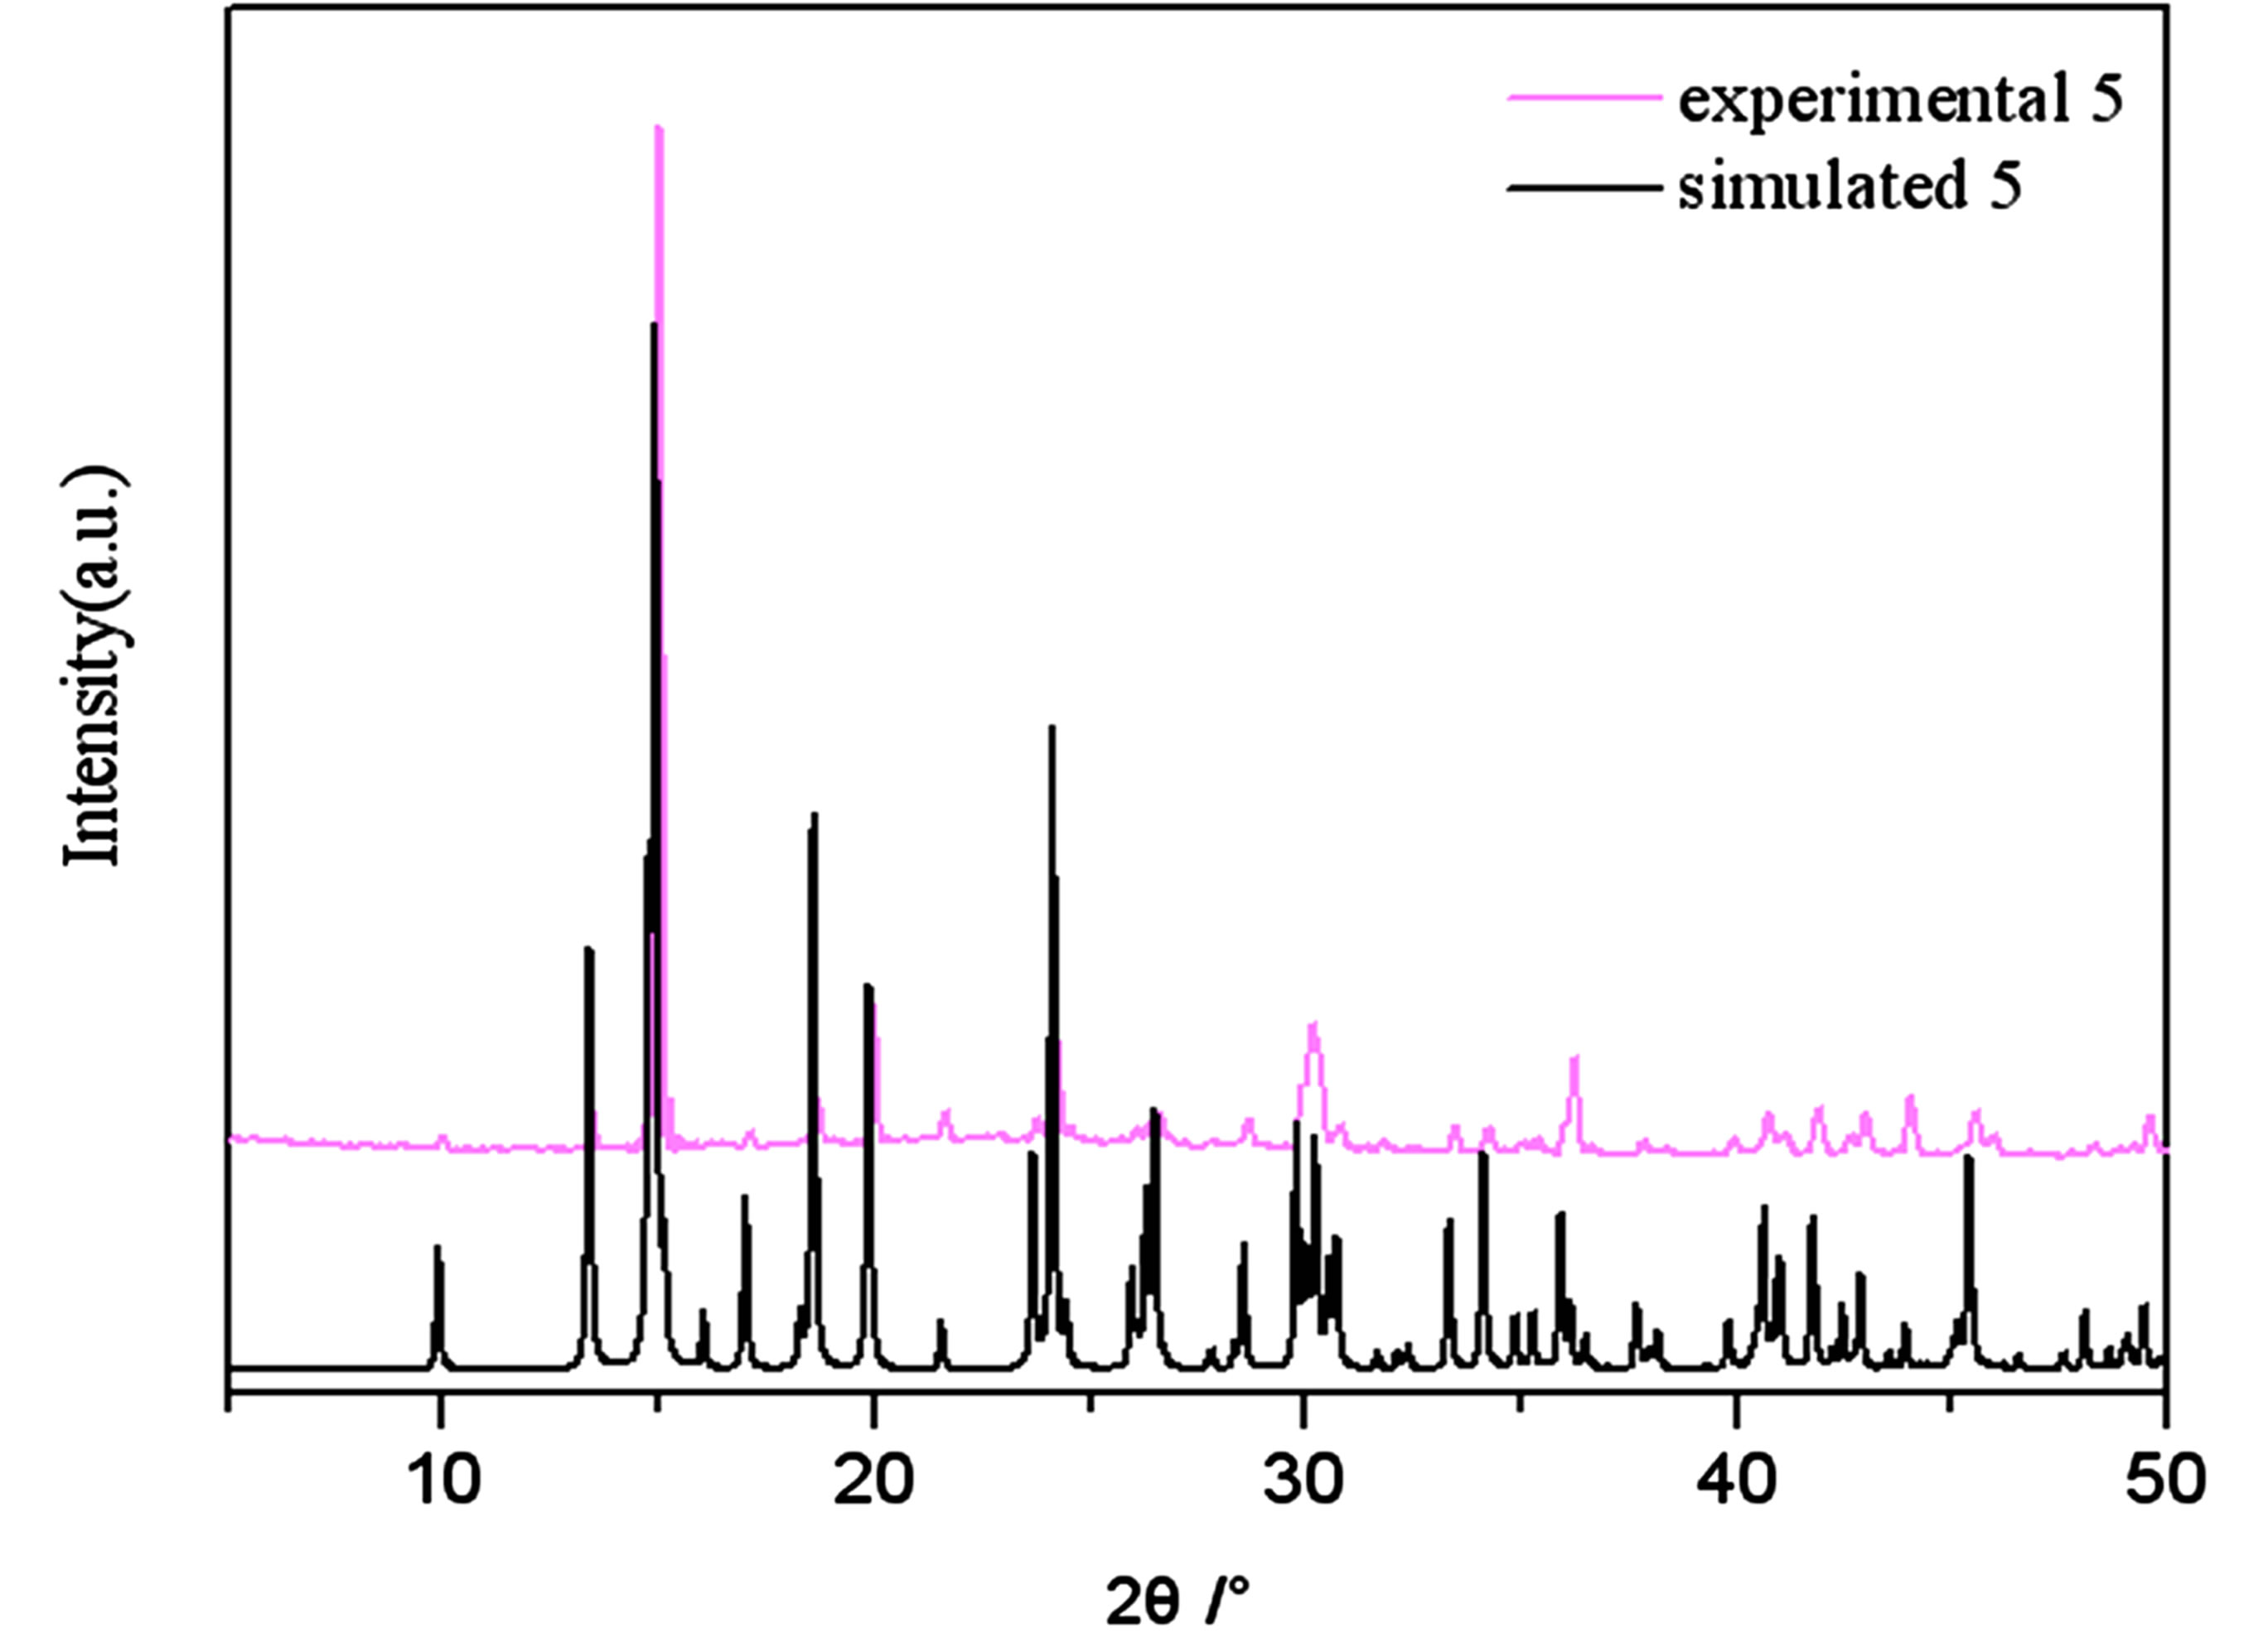
Figure S5 . PXRD patterns for the simulated based on the x-ray single crystal diffraction and the experimental samples of complexes 5.
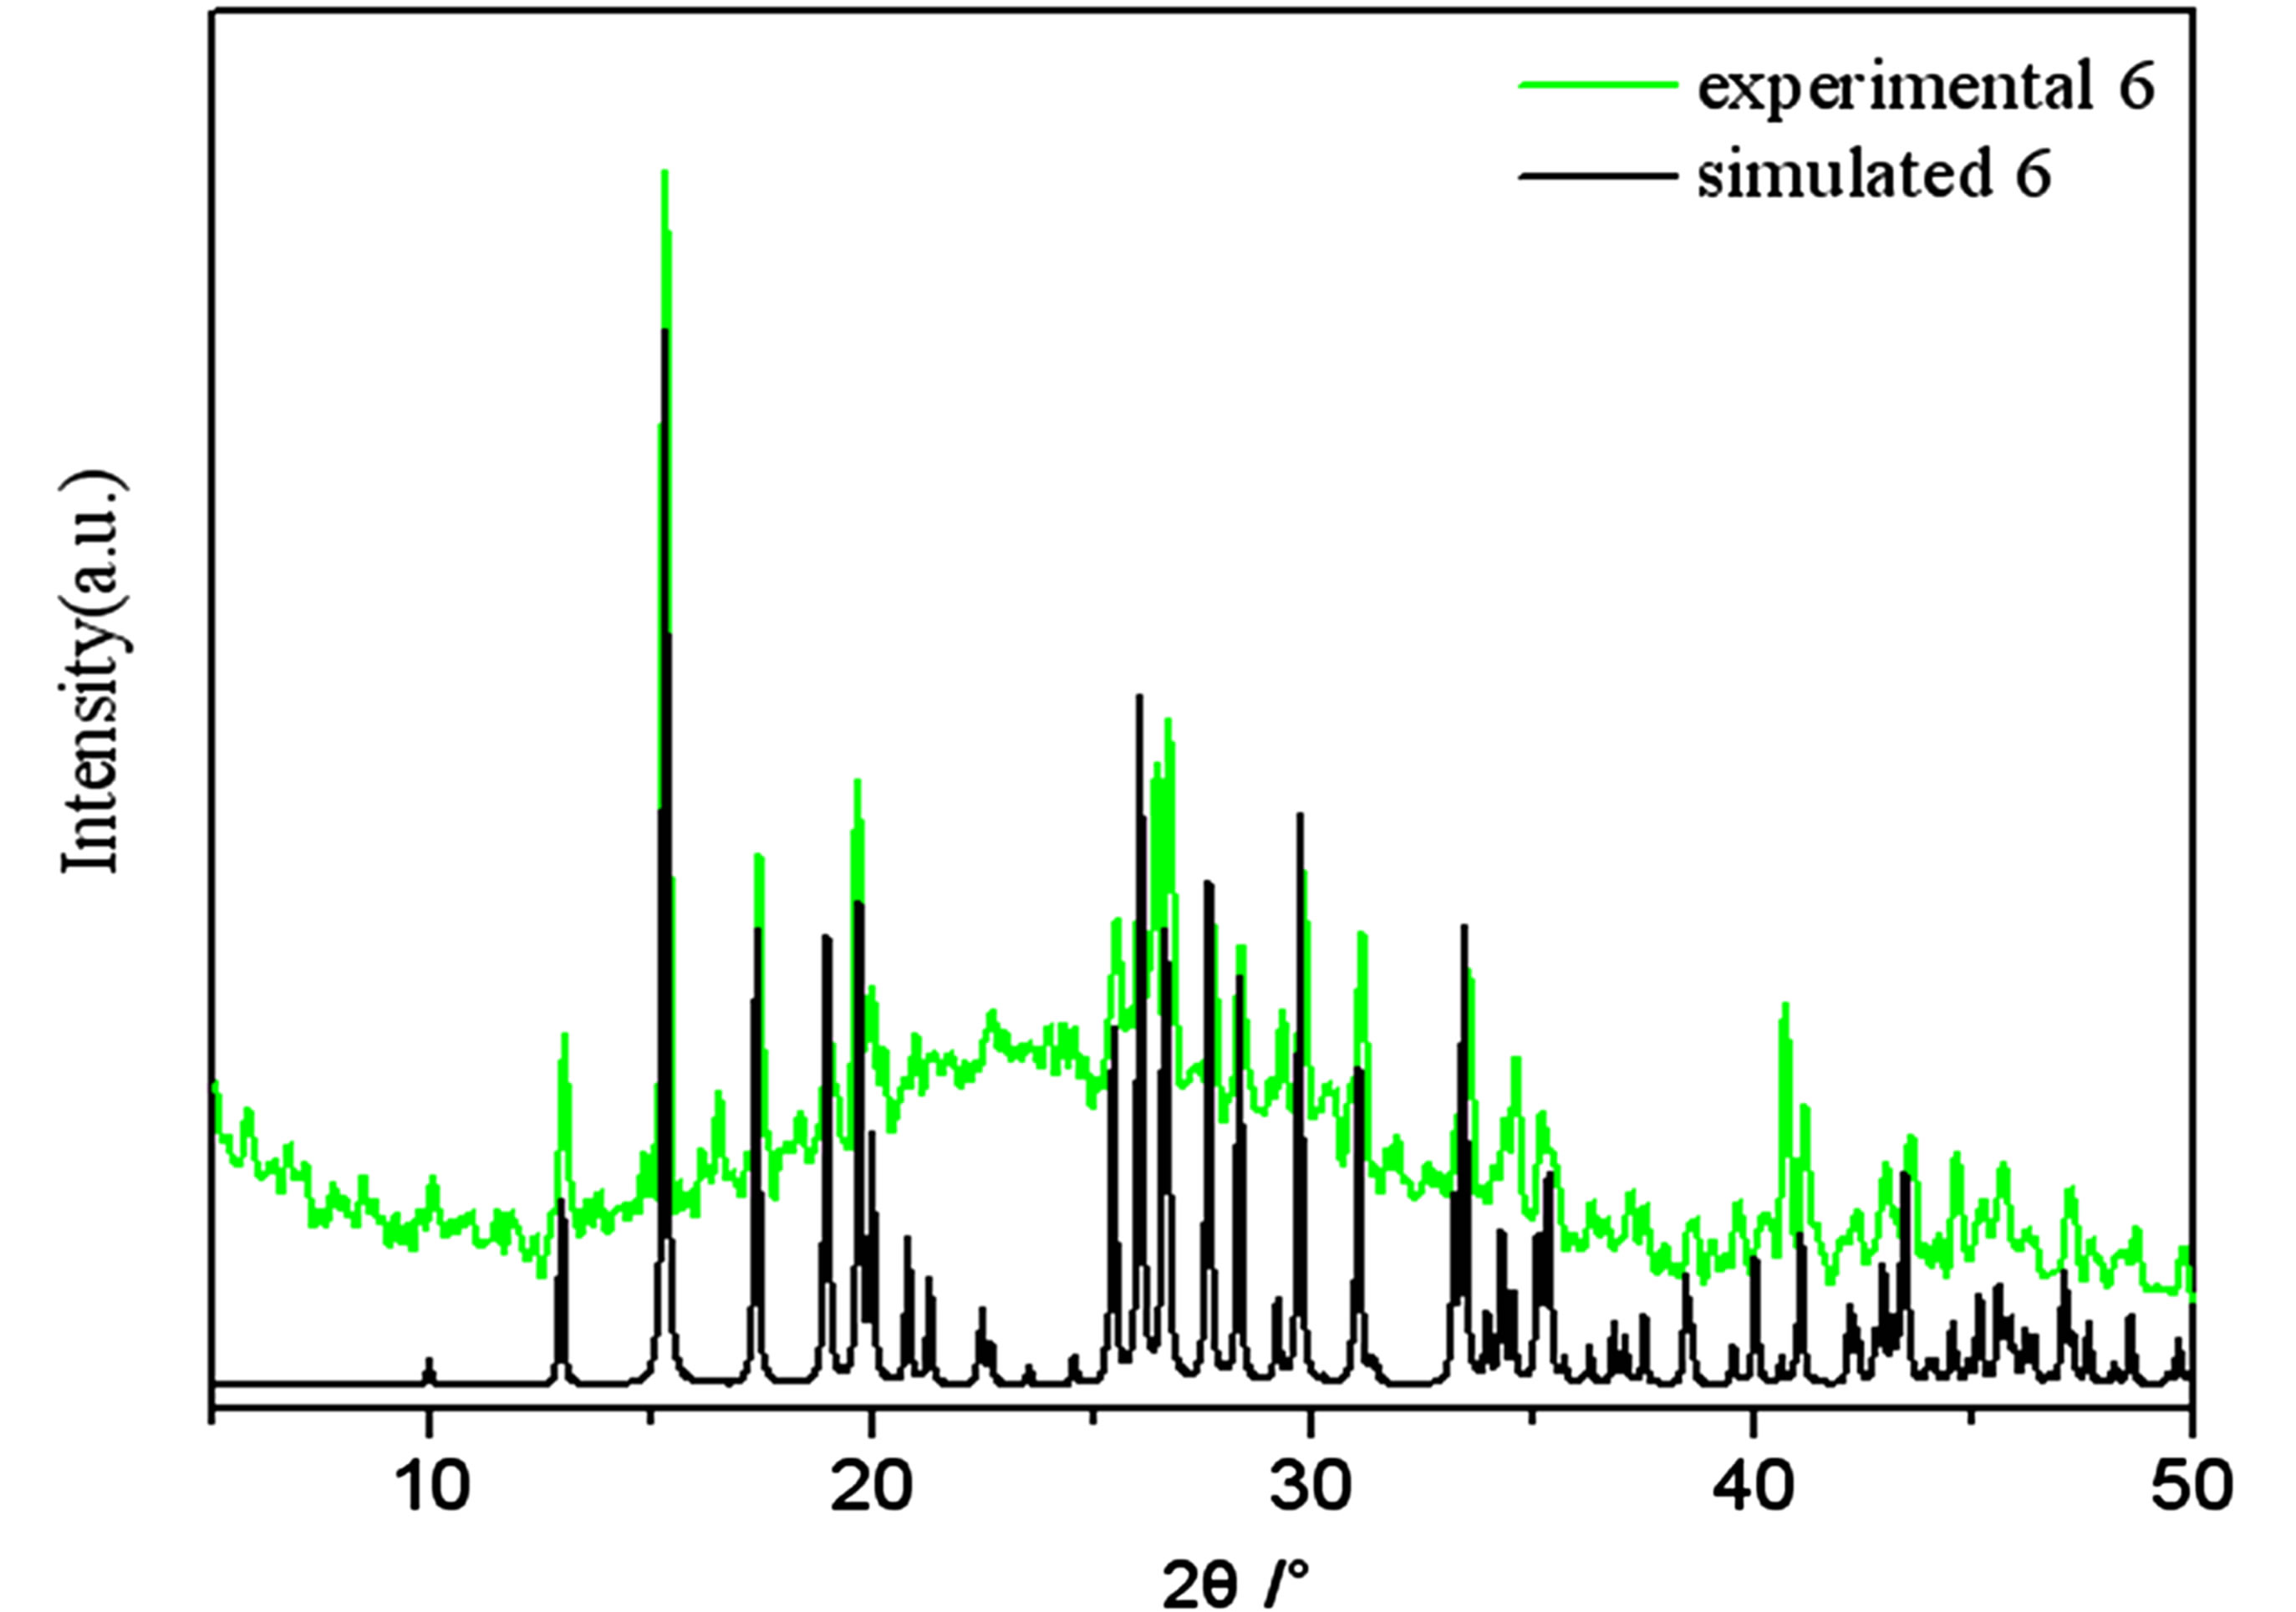
Figure S6 . PXRD patterns for the simulated based on the x-ray single crystal diffraction and the experimental samples of complexes 6.
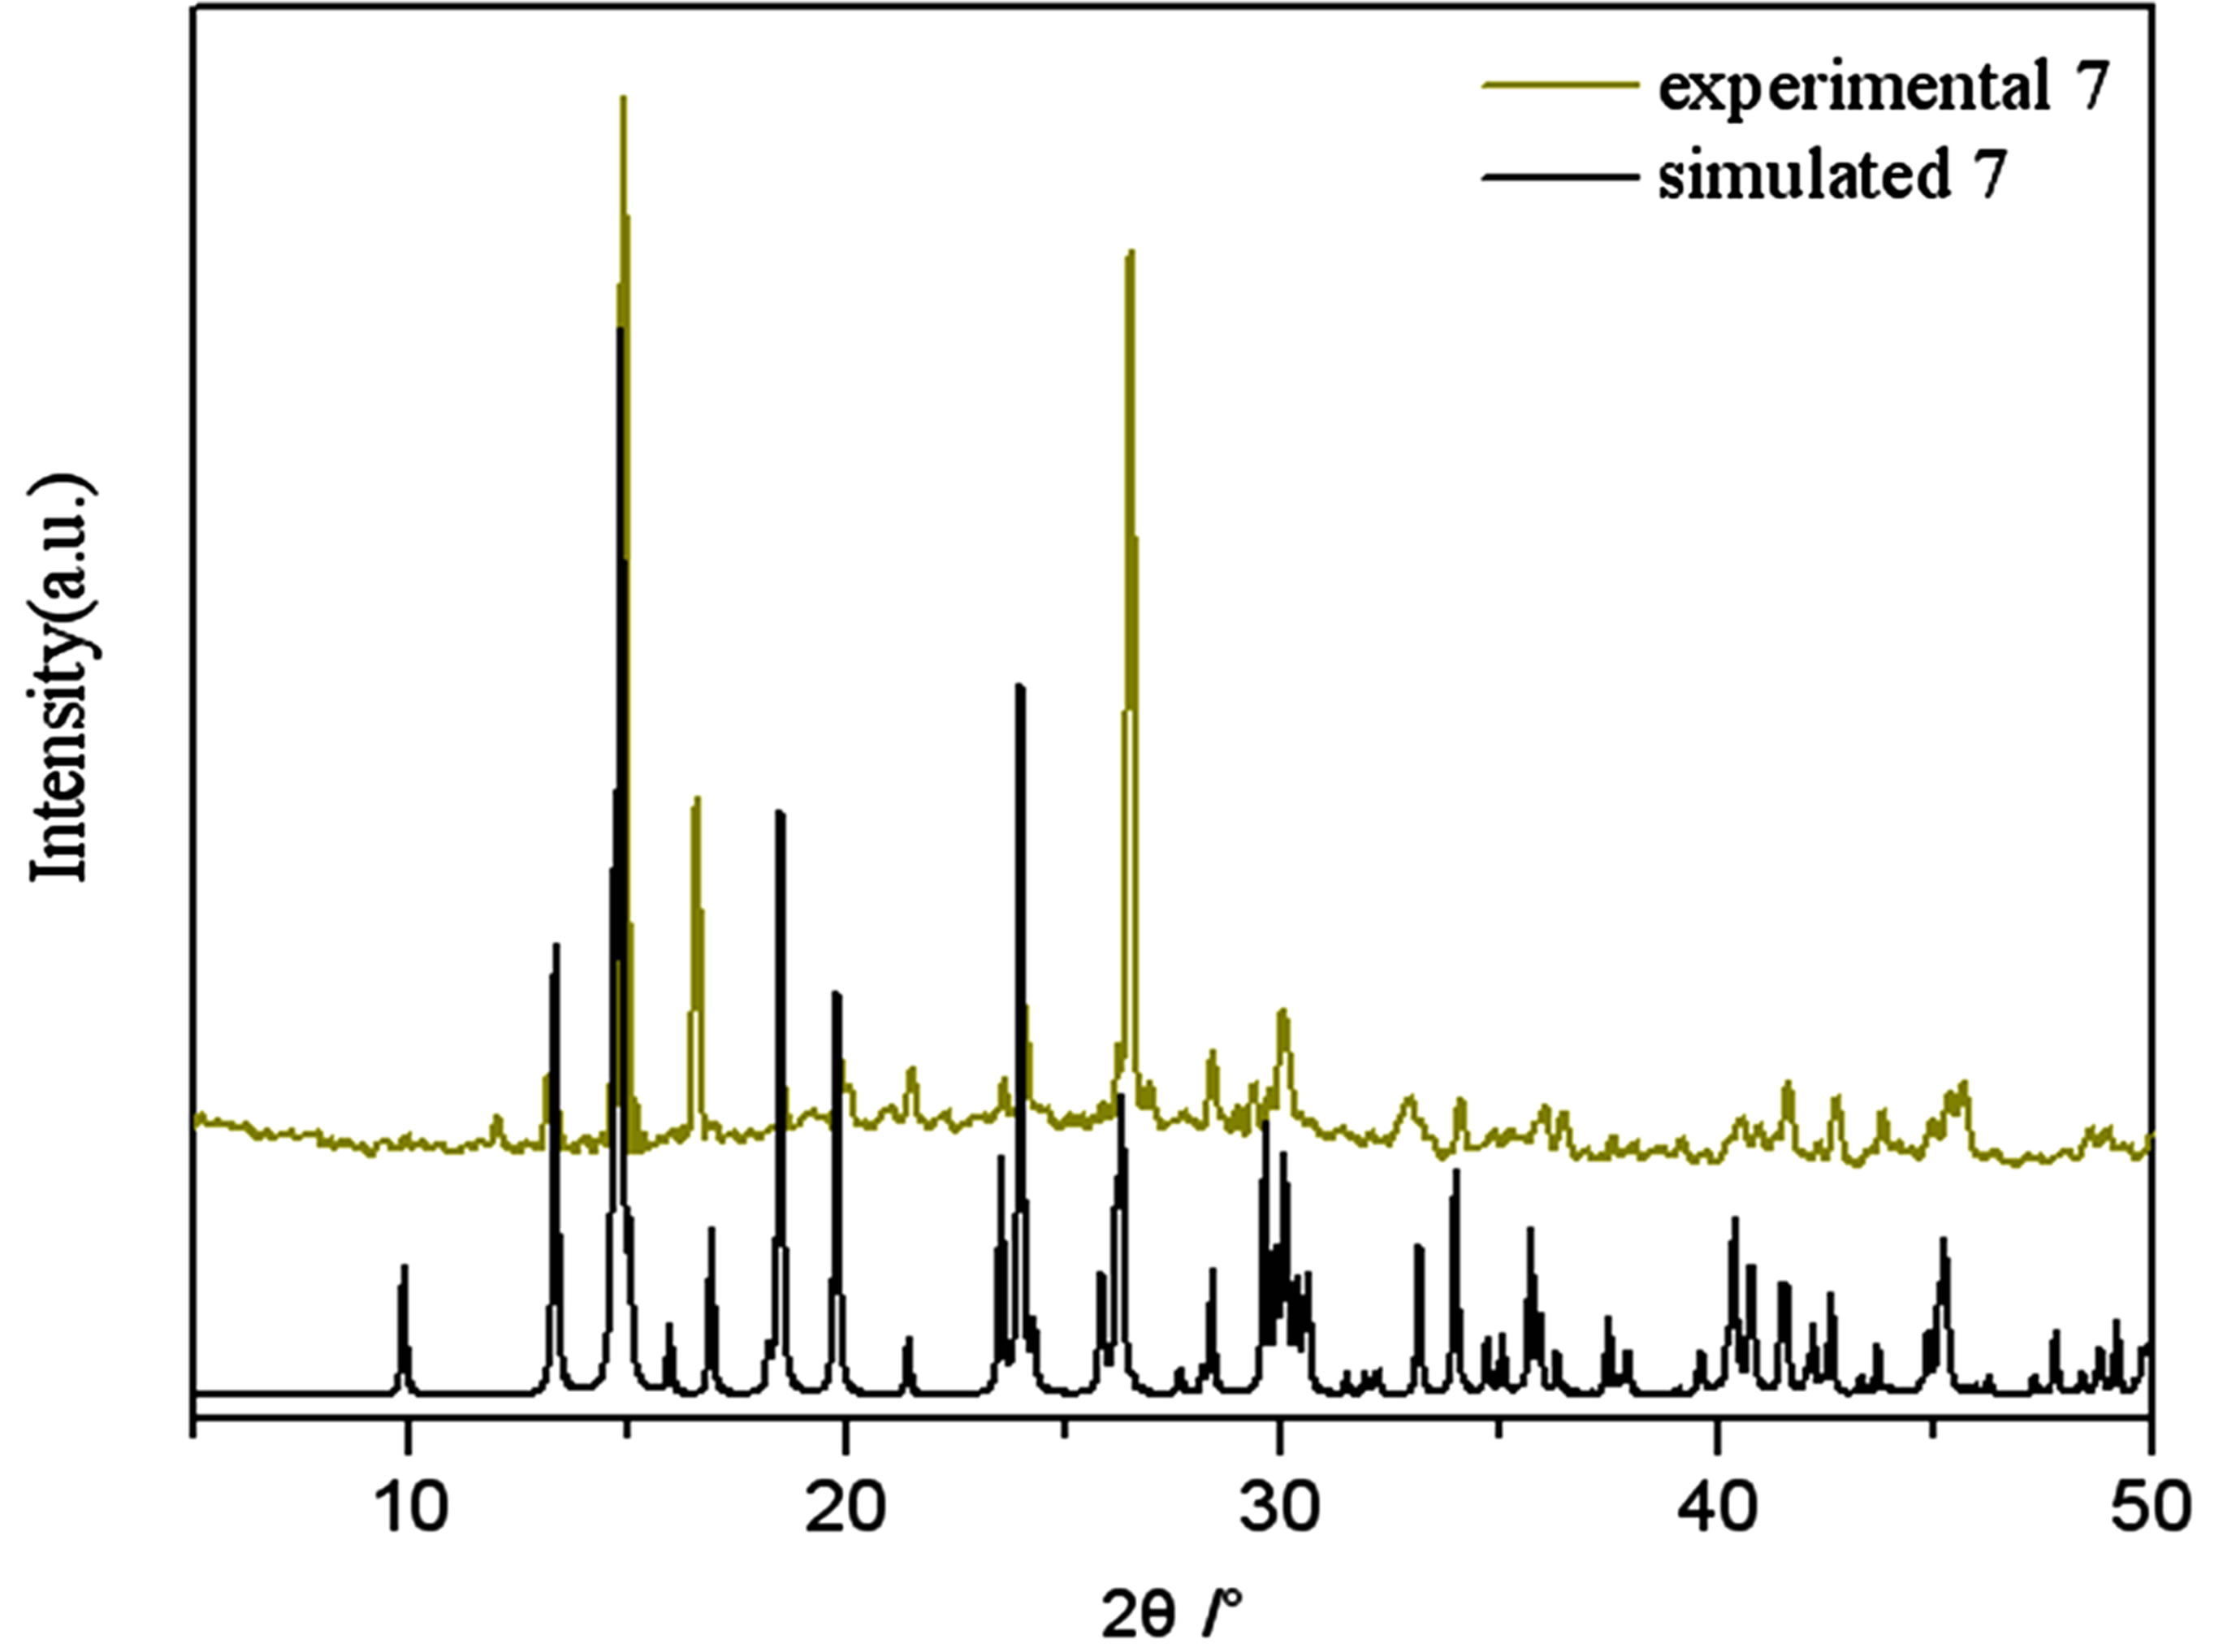
Figure S7. PXRD patterns for the simulated based on the x-ray single crystal diffraction and the experimental samples of complexes 7.
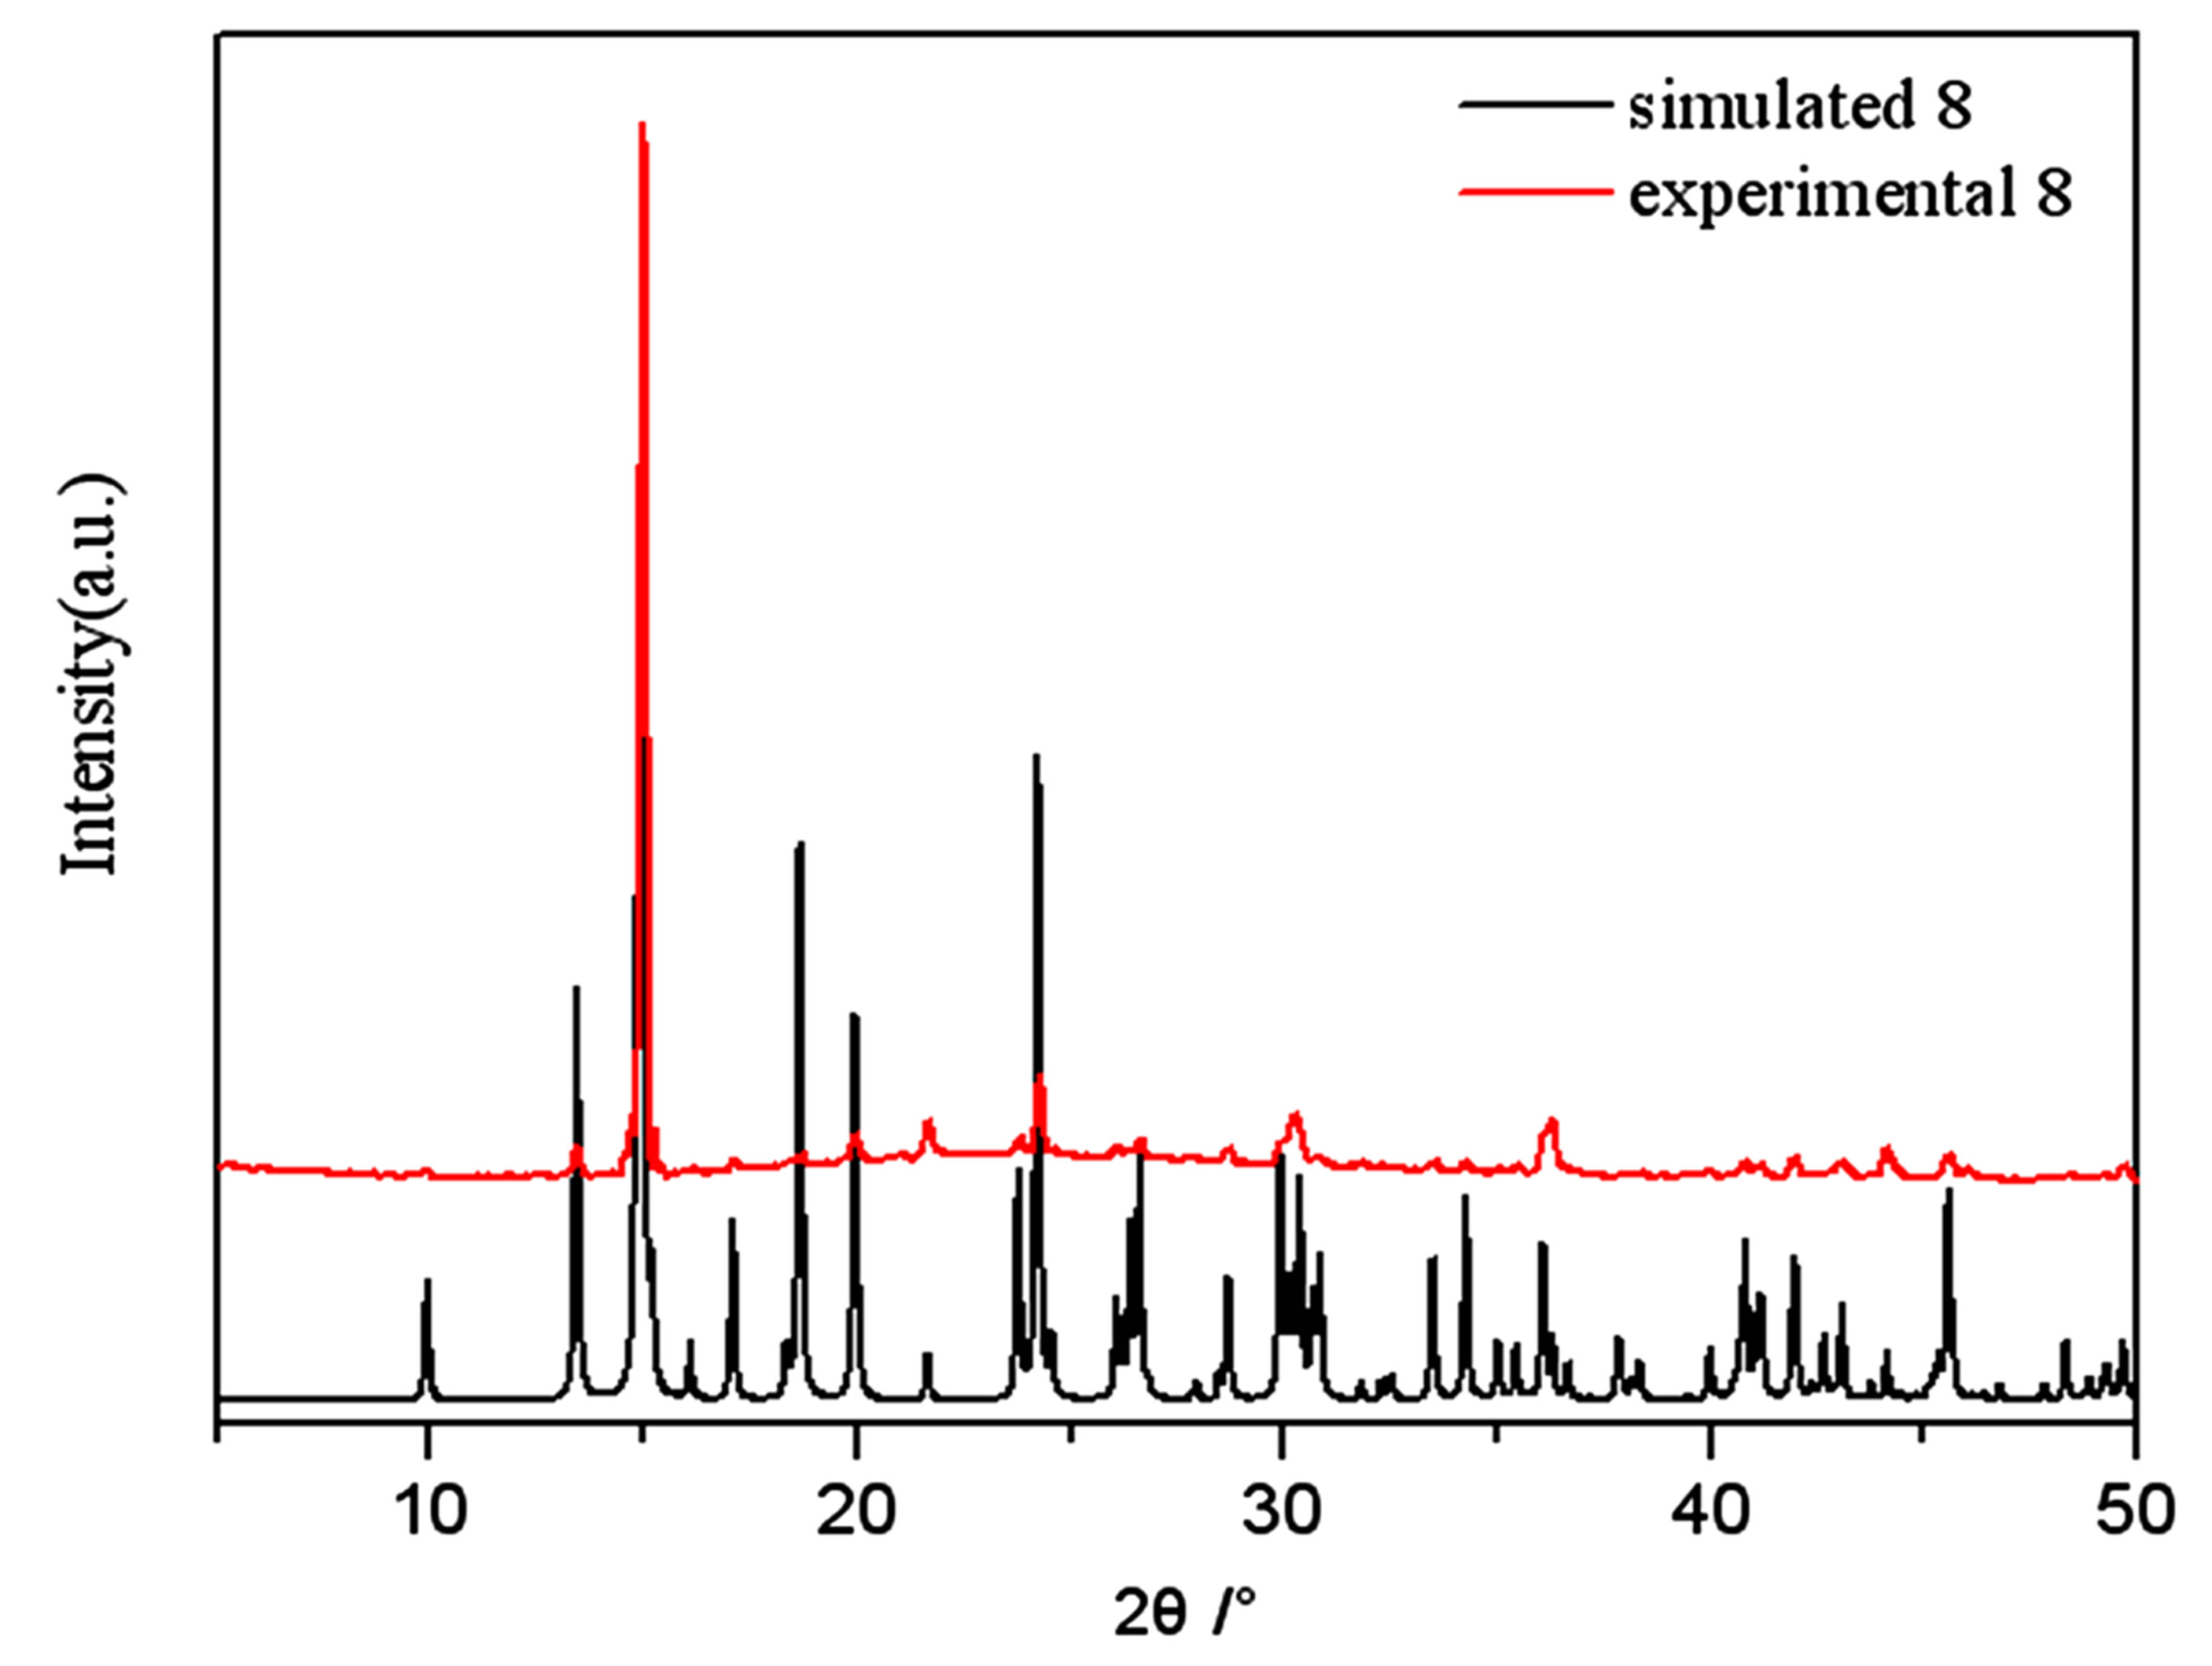
Figure S8. PXRD patterns for the simulated based on the x-ray single crystal diffraction and the experimental samples of complexes 8.
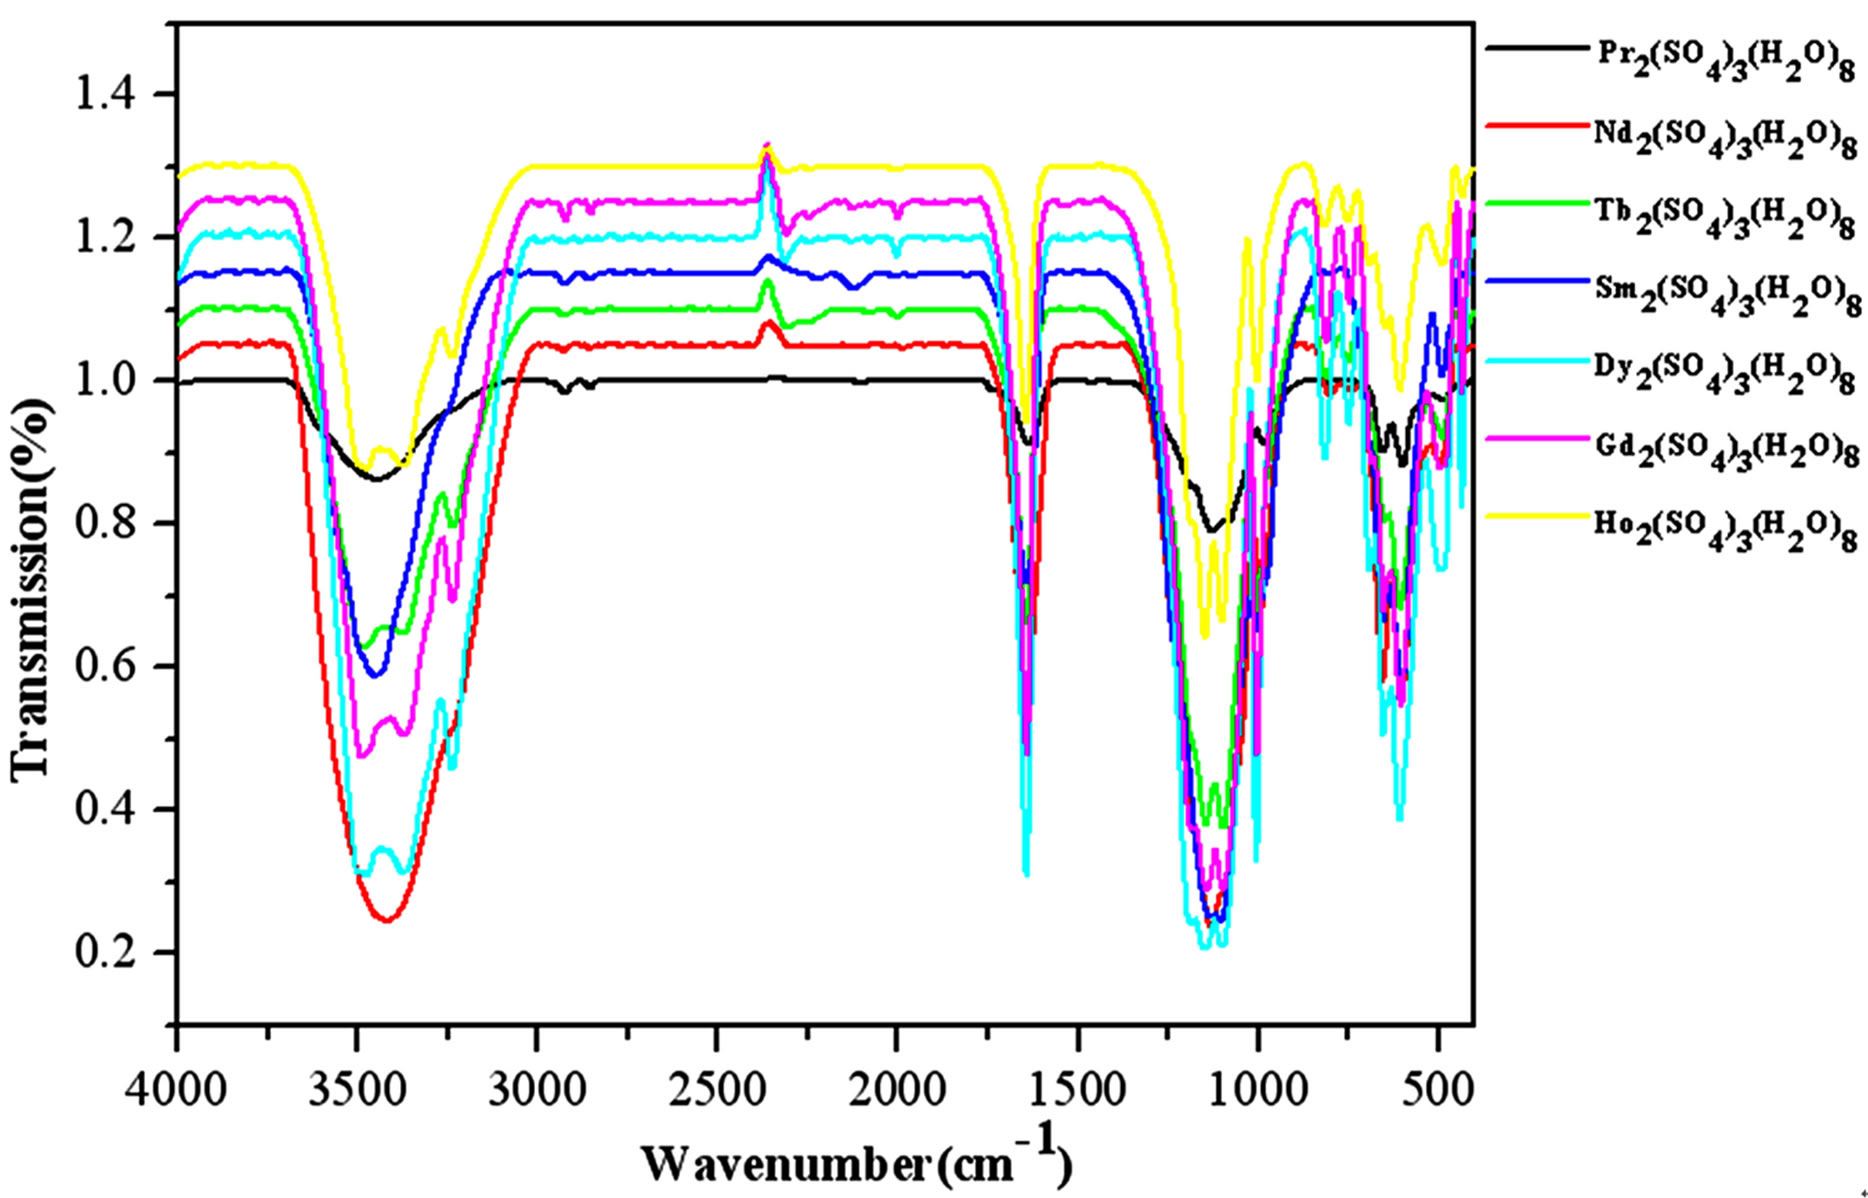
Figure S9. The IR spectra of complexes 1 - 5, 7 - 8.
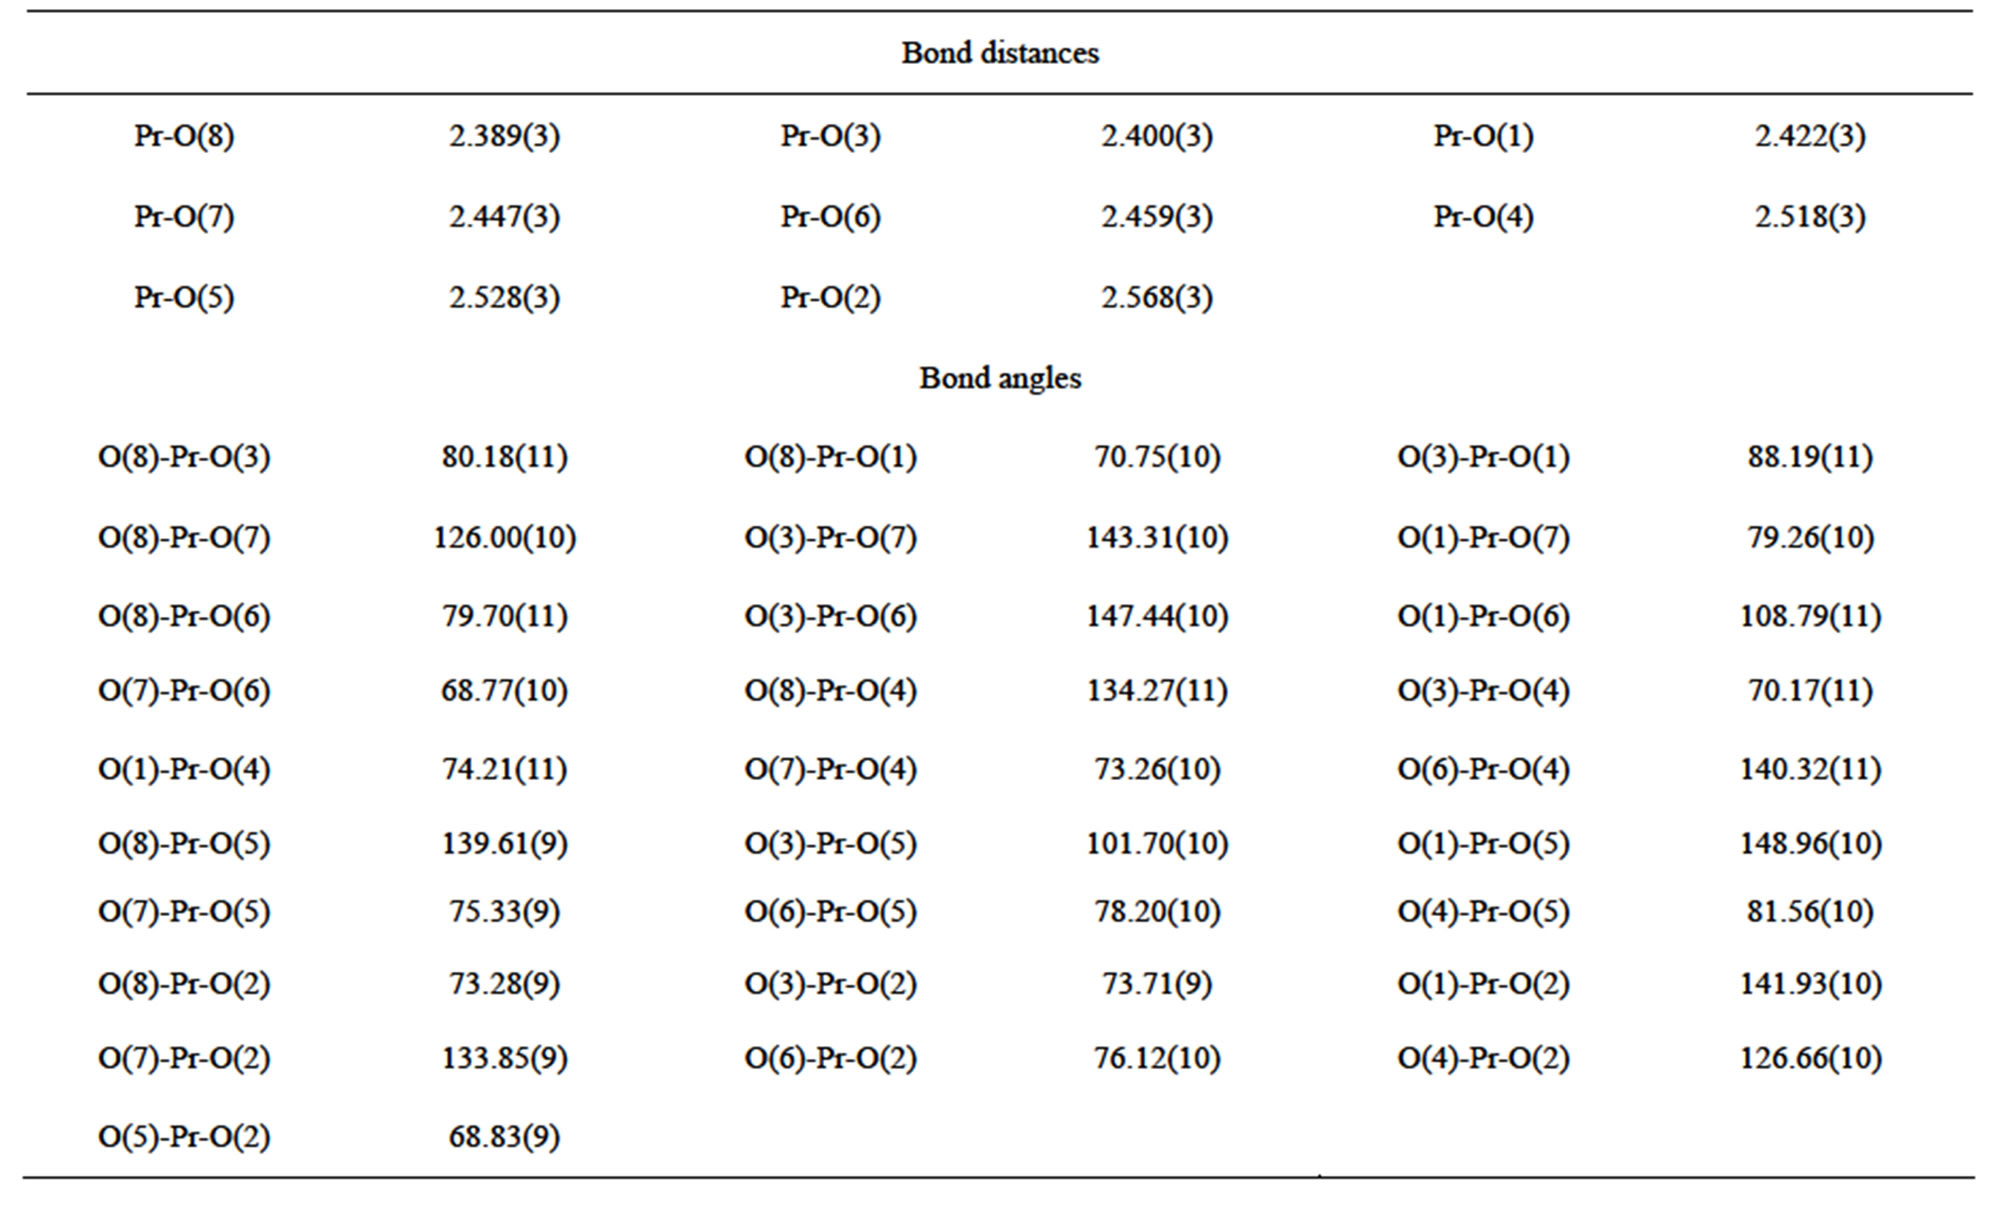
Table S1 . Selected bond distances (Å) and angles (deg) of complex 1.
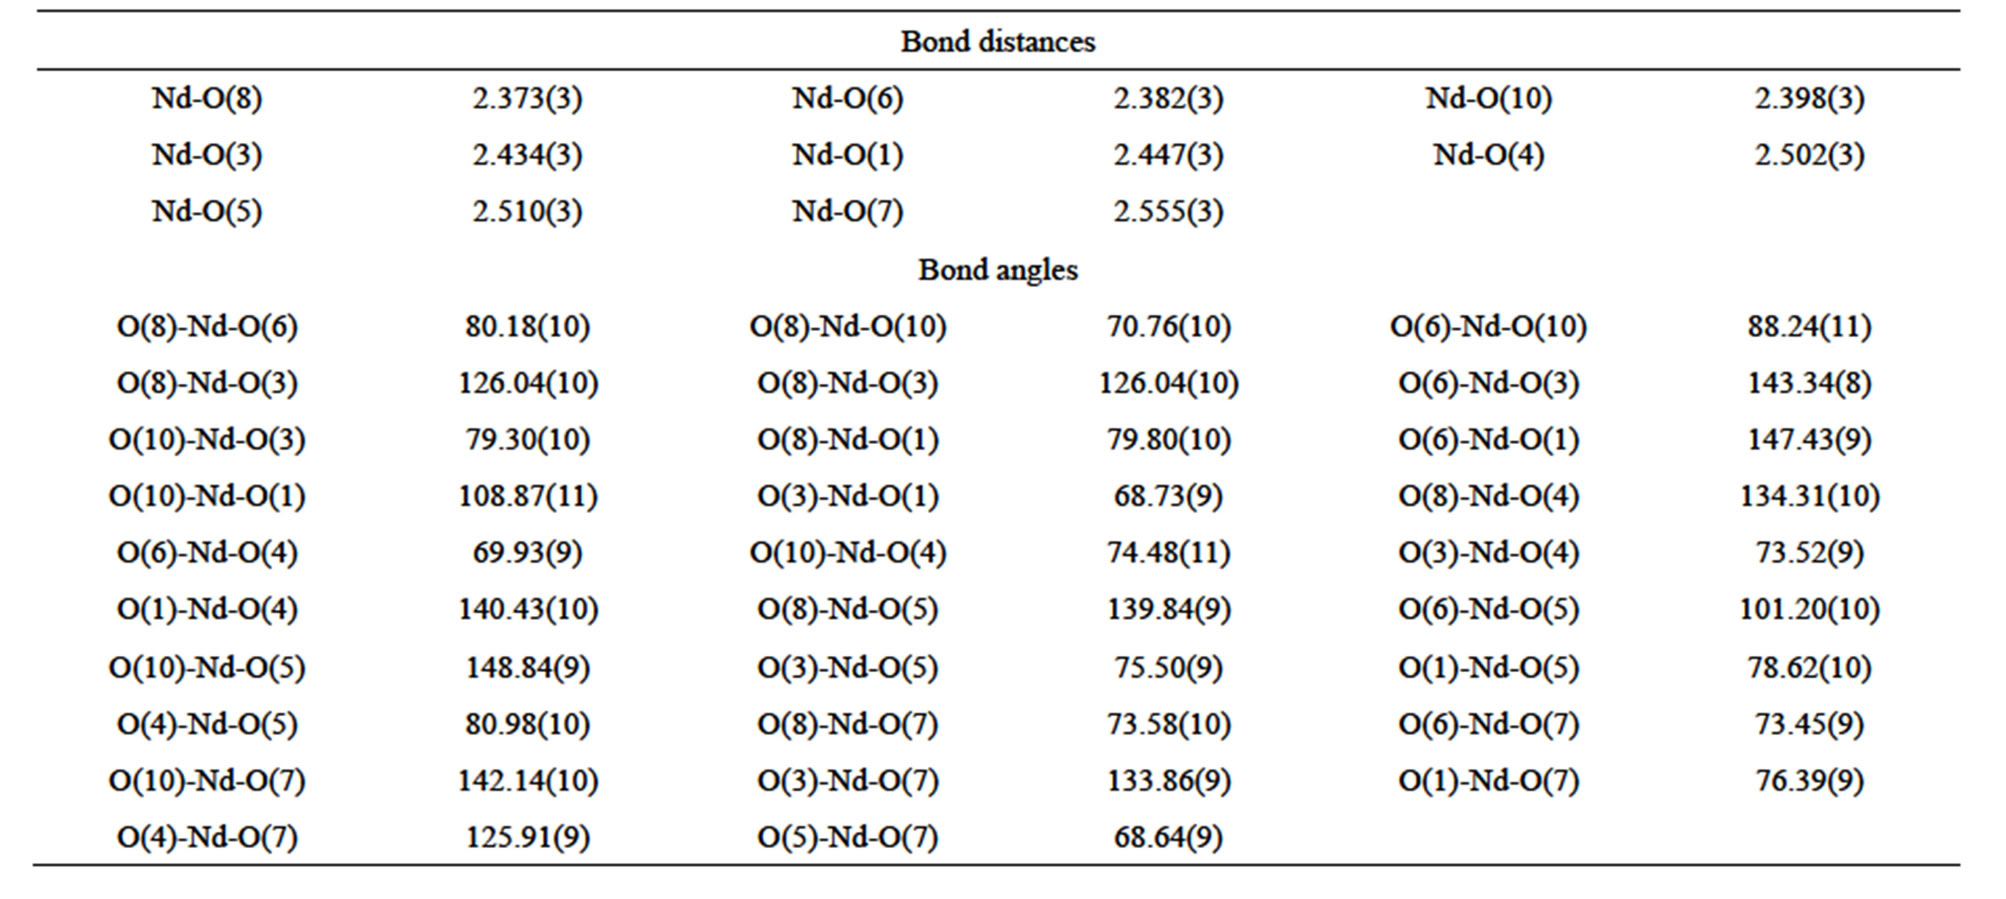
Table S2 . Selected bond distances (Å) and angles (deg) of complex 2.

Table S3 . Selected bond distances (Å) and angles (deg) of complex 4.
 (a)
(a)  (b)
(b)  (c)
(c)  (d)
(d)
Figure S14 . (a) The coordination environment of Dy in complex 5; (Symmetry codes: #1 −x + 3/2, −y − 1/2, −z + 1 #2 −x + 3/2, −y + 1/2, −z + 1 #3 −x + 2, y, −z + 3/2 #4 1.5 − x, −0.5 − y, 1 − z ); (b) The 2D polyhedron layer in complex 5, viewed along the a-axis; (c) Schematic representation of the 2D (42.6.82.10)2(42.6)2(8) topology network in complex 5. Purple, Dy; Lime, ; (d) A view of the 3D hydrogen bonding network structure of complex 5 (black dotted lines representing hydrogen bonding).

Table S4 . Selected bond distances (Å) and angles (deg) of complex 5.
 (a)
(a)  (b)
(b)  (c)
(c)  (d)
(d)
Figure S15 . (a) The coordination environment of Gd in complex 7; (Symmetry codes: #1 −x + 3/2, −y − 1/2, −z + 1#2 −x + 3/2,−y + 1/2, −z + 1 #3 −x + 2, y, −z + 3/2 #4 1.5 − x, −0.5 − y, 1 − z); (b) The 2D polyhedron layer in complex 7, viewed along the a-axis; (c) Schematic representation of the 2D (42.6.82.10)2(42.6)2(8) topology network in complex 7. Maroon, Gd; Lime, ; (d) A view of the 3D hydrogen bonding network structure of complex 7 (black dotted lines representing hydrogen bonding).
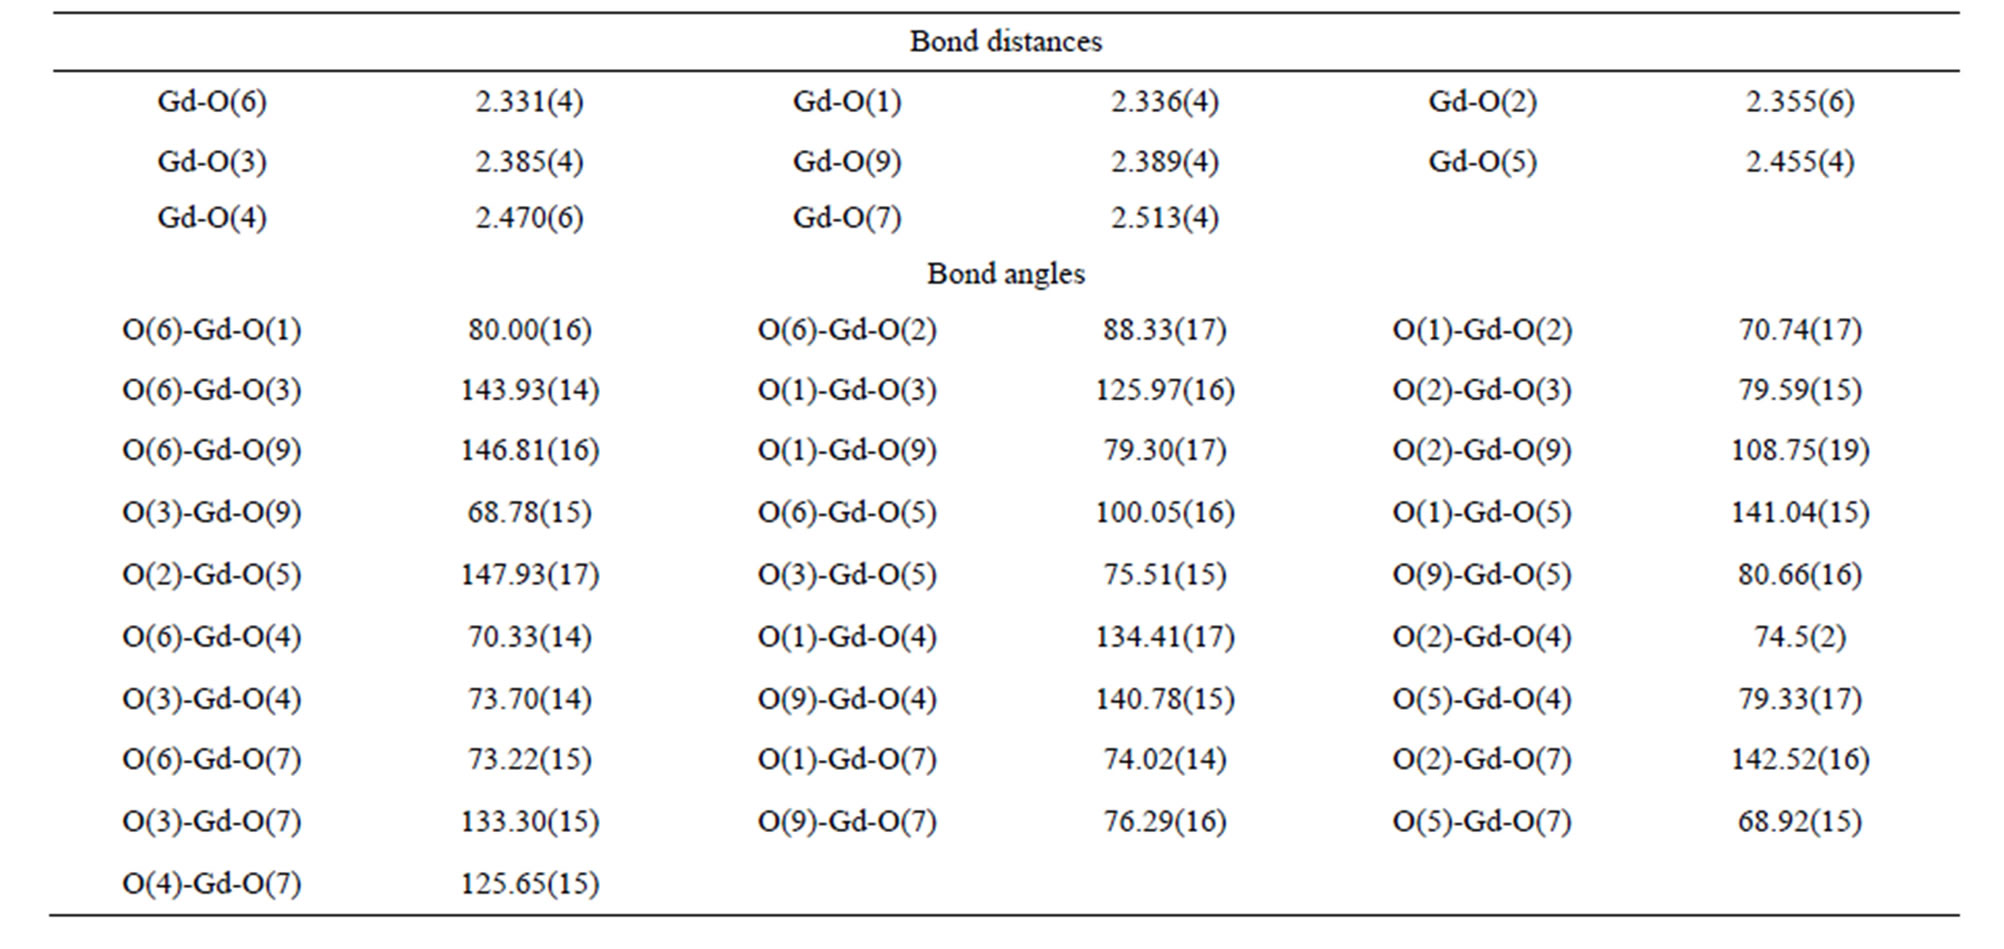
Table S5 . Selected bond distances (Å) and angles (deg) of complex 7.

Table S6 . Selected bond distances (Å) and angles (deg) of complex 8.

Table S7 . Hydrogen bonds of complex 1/Å and symmetry codes: j: 1/2 + x, 1/2 + y, z; k: 1/2 − x, 1/2 + y, 1/2 − z; e: 1/2 − x, 3/2 − y, 1 − z; d: 1/2 − x,1/2 − y,1−z; b: x, 1 + y, z; m: −1/2 + x, 1/2 + y, z.

Table S8 . Hydrogen bonds of complex 2/Å and symmetry codes: g: 1/2 + x, 1/2 + y, z; a: x, −1 + y, z; e: 1/2 − x, 3/2 − y, −z; d: 1/2 − x, 1/2 − y, −z; h: 1/2 − x,1/2 + y, 1/2 − z; i: −1/2 + x, −1/2 + y, z.
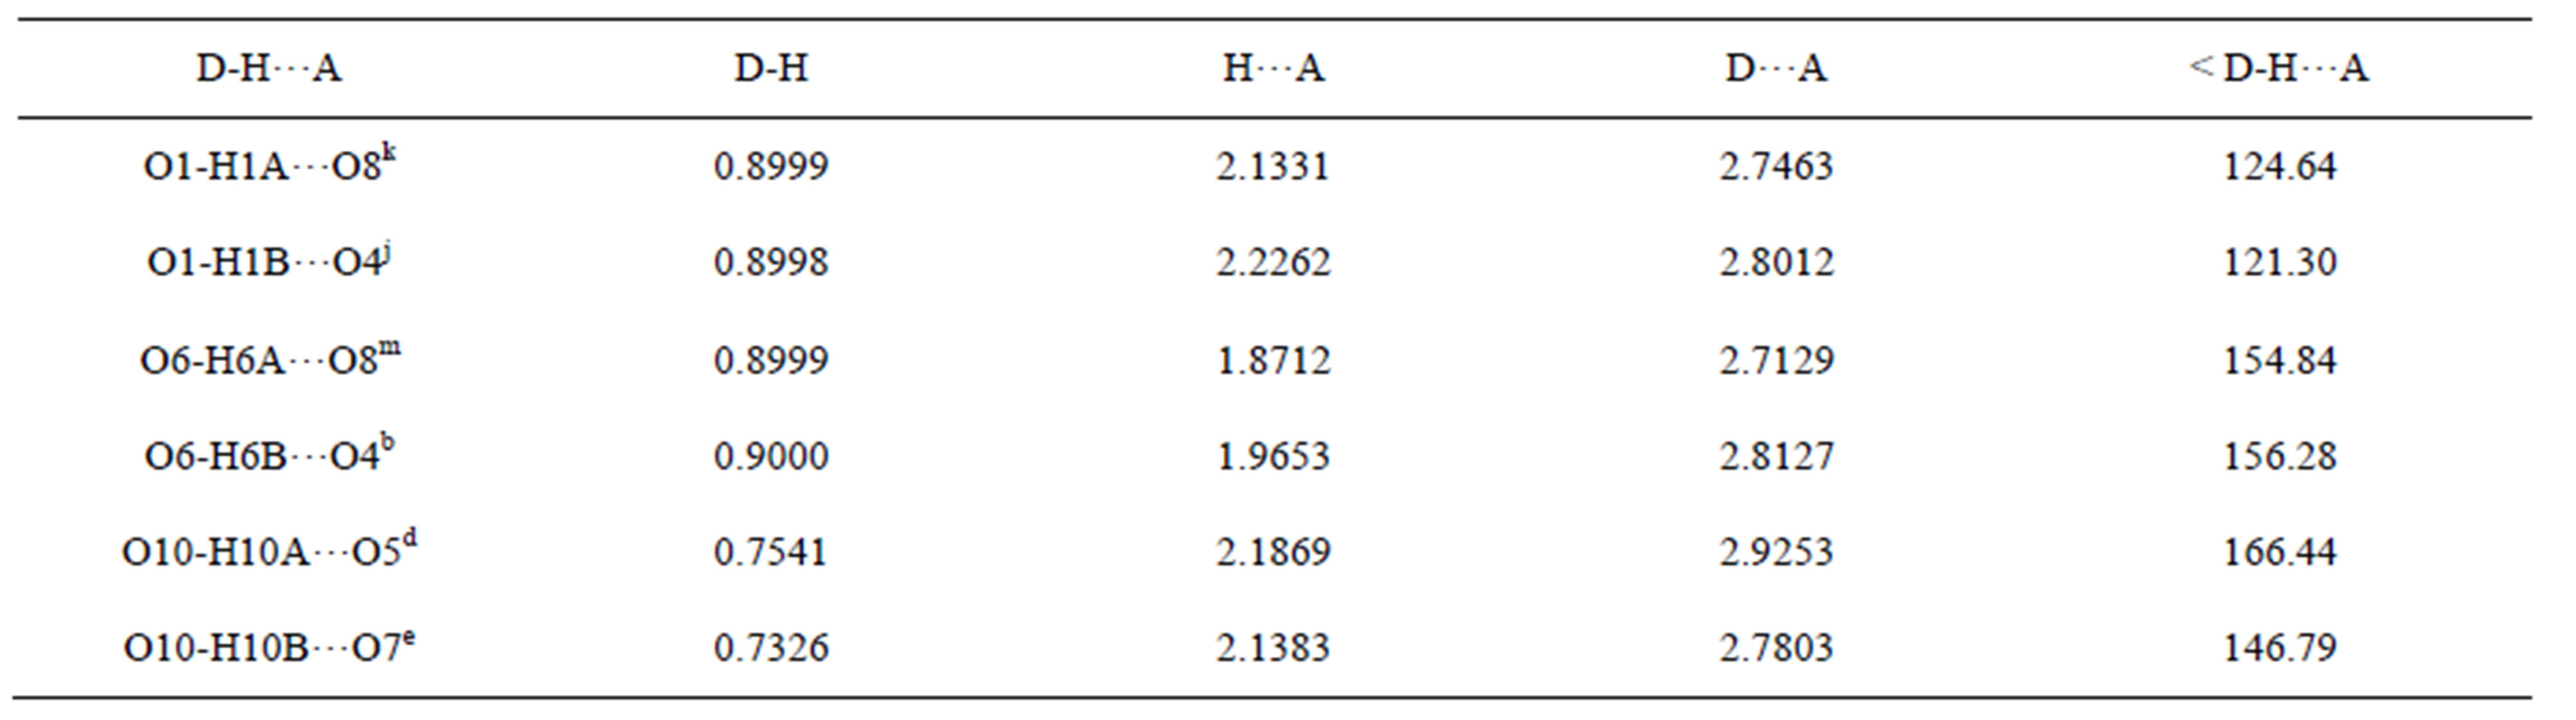
Table S9. Hydrogen bonds of complex 4/Å and symmetry codes: k: 1/2 − x, 1/2 + y, 1/2 − z; j: −1/2 + x, 1/2 + y, z; m: 1/2 + x, 1/2 + y, z; b: x, 1 + y, z; d: 1/2 − x, 1/2 − y, −z; e: 1/2 − x, 3/2 − y, −z.
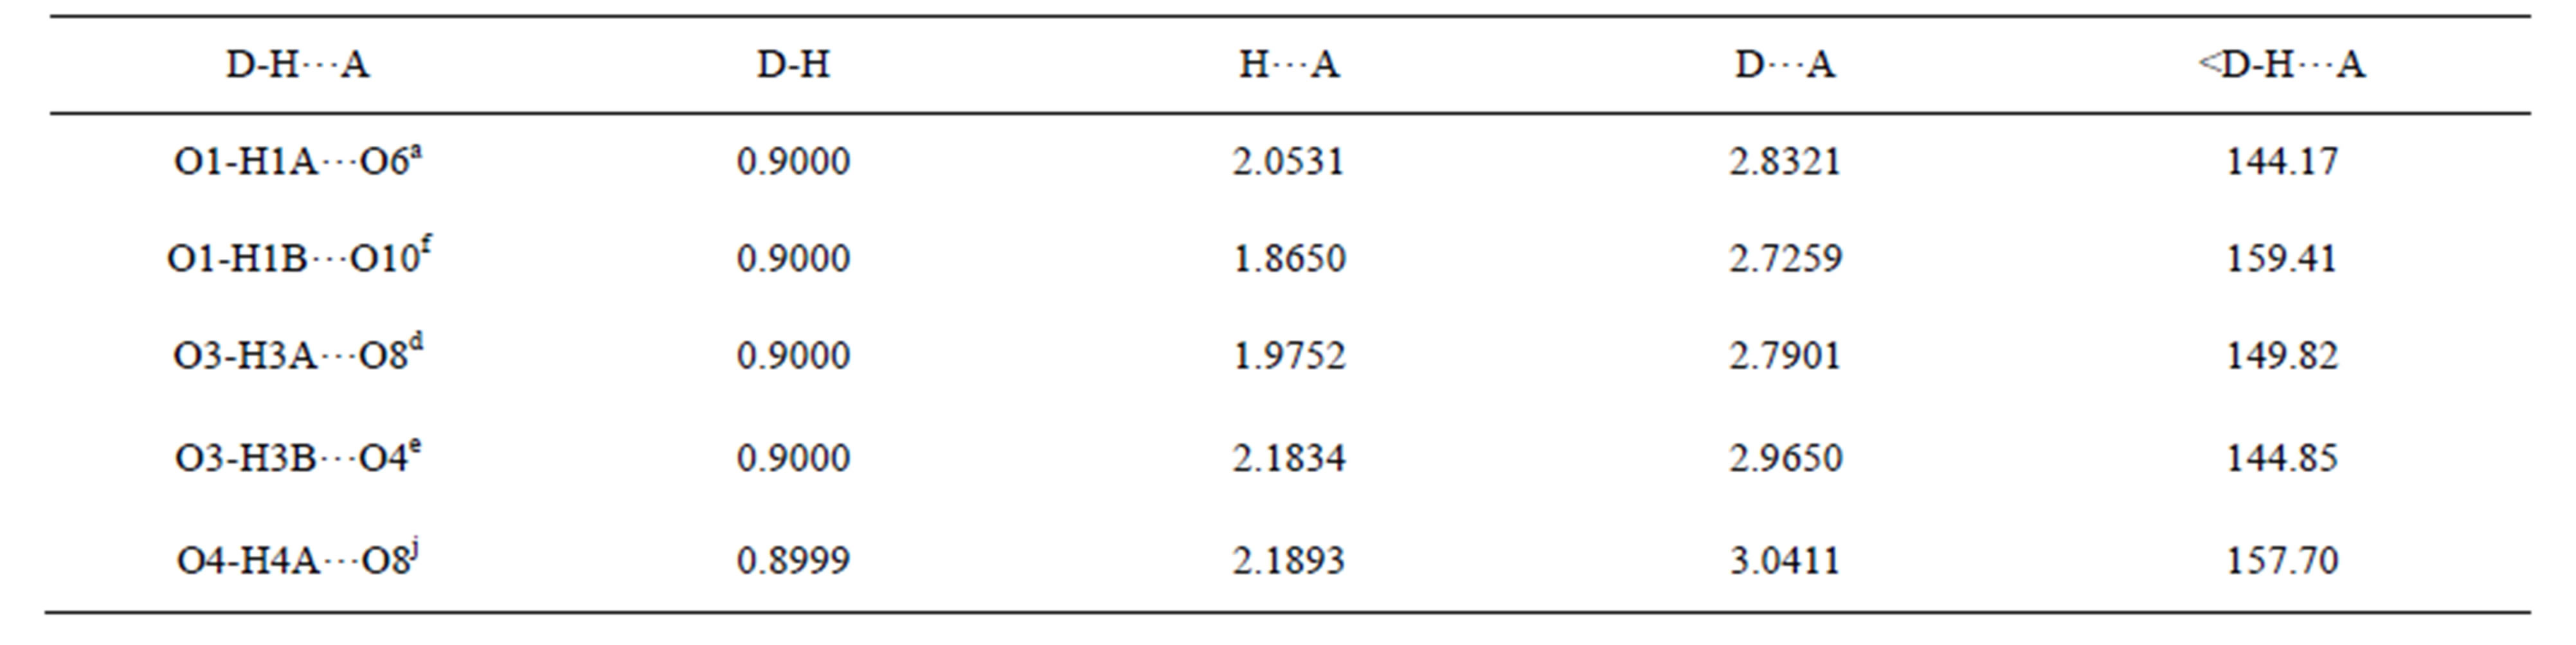
Table S10. Hydrogen bonds of complex 5/Å and symmetry codes: a: x, −1 + y, z; f: 1/2 + x, −1/2 + y, z; d: 1/2 − x, 3/2 − y, −z; e: 1/2 − x, 1/2 − y, −z; j: 1 − x, 1 − y, −z.
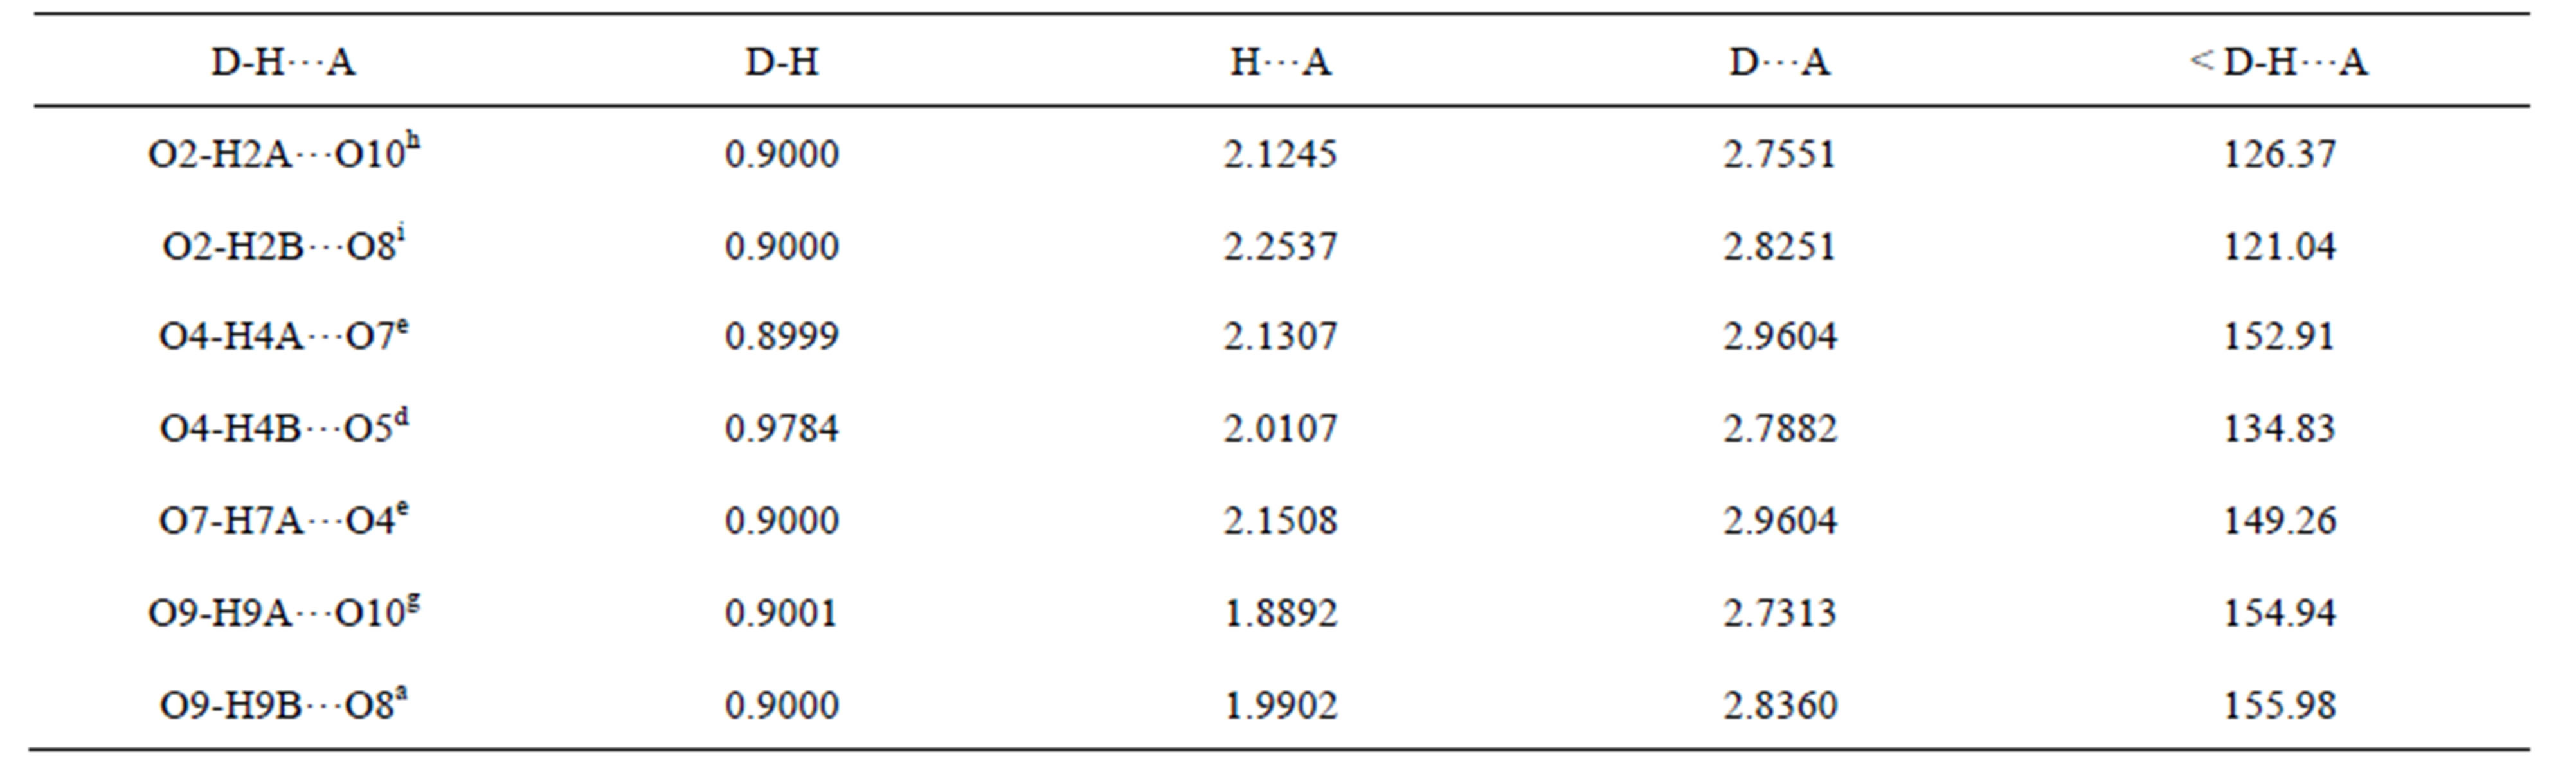
Table S11. Hydrogen bonds of complex 7/Å and symmetry codes: h: 1/2 − x, −1/2 + y, 1/2 − z; i: −1/2 + x, 1/2 + y, z; e: 1/2 − x, 1/2 − y, −z; d: 1/2 − x, 3/2 − y, −z; g: 1/2 + x, −1/2 + y, z; a: x, −1 + y, z.
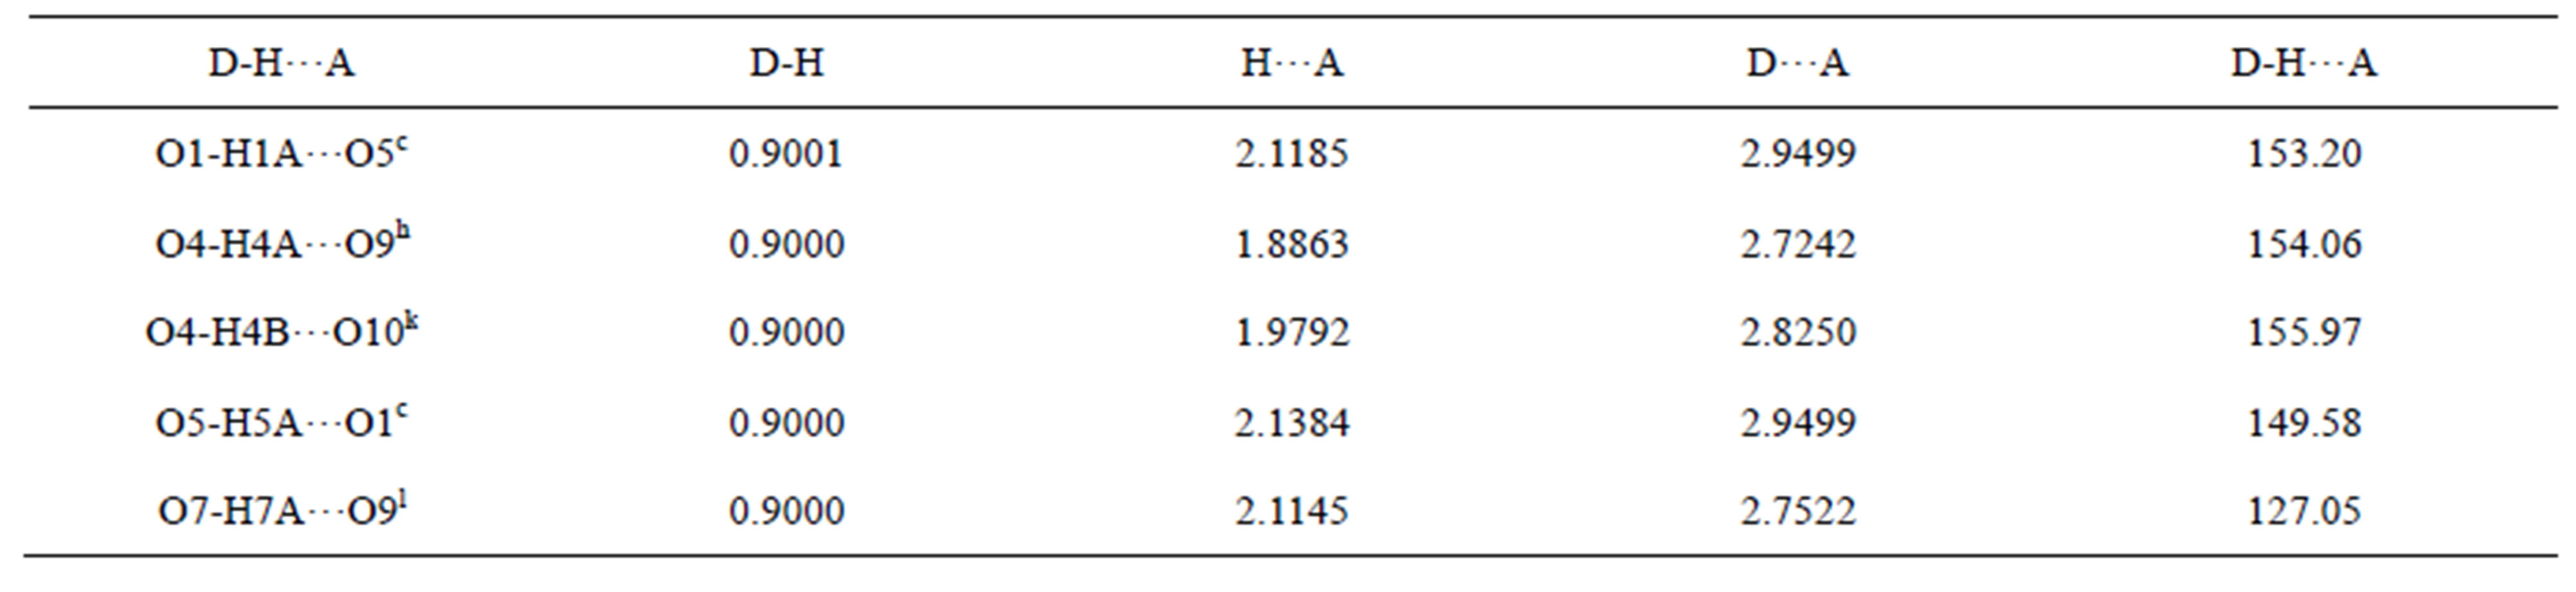
Table S12. Hydrogen bonds of complex 8/Å and symmetry codes: c: 1/2−x, 3/2−y, −z; h: 1−x, 1−y, −z; k: x, −1 + y, z; l: x, 1−y, 1/2 + z.
NOTES