Application of Ultrasonic Waves for the Improvement of Water Treatment ()
1. Introduction
Water is essential natural resources for the existence of life in the earth. However, sources of water are under crisis due to rapid urbanization and the increasing population, which demand more agricultural, industrial and domestic supplies. On the other hand, increasing anthropogenic activities in both developed and developing world have mounted heavy stresses on water quantity and quality [1].
An understanding that the water conservation at the source of drinking water rather than remediation and treatment is very important has been deepened. However, the water sources that have been already contaminated have to be treated to make safe drinking water. At present, the water purification treatment and its management have been fully carried out to respond citizens who require potable and tasty drinking water.
As a research theme of environmental engineering, numerous researchers are much interested in the development of new techniques to get a safe drinking water through purification of water resources [2]. But, development of a novel as well as sustainable and cost effective techniques for the removal of pollutants from drinking water is the challenging issue for environmental professionals.
The most widely applied water treatment processes, a combination of some or all of coagulation, flocculationsedimentation and filtration to reduce or eliminate turbidity and improve water quality [3]. Moreover, ion exchange, carbon adsorption, membrane processes and disinfection are generally used to remove contaminants in traditional water purification system. Above processes have some purification limitation and application problems such as high cost, ineffective for removal some pollutant, operation problems and generate toxic secondary pollutants [4]. Such a limitation can be eliminated by the application of innovative techniques such as semiconductor catalysts, forward osmoses, advances oxidation process and magnetic purification [5]. There are several applications of irradiation of ultrasonic waves into fluids [6,7]. It is reported that physical phenomena (effect) such as cleaning, emulsification, cavitation, promotion of reaction etc. happen when small amplitude and high-frequency waves (ultrasonic waves) are irradiated in the water with impurities. Ultrasound is cyclic sound pressure with a frequency greater than the upper limit of human hearing, which is approximately 20 kilohertz [8]. Among the numerous applications of ultrasound, the approach is used in the field of water treatment. The application of ultrasonic waves improves water treatment process efficiently.
Ultrasound waves were irradiated to water with impurities mainly to examine 1) a condition of ultrasonic waves to accelerate the reaction better and 2) a condition of the softenization of hard water and removal of other impurities from drinking water. Then the removal rate of impurities from drinking water has been shown when changing the amplitude and frequency of ultrasonic waves. Moreover, by changing the ultrasonic wave condition, fundamental investigation of the content of various water quality parameters such as calcium (Ca), sodium (Na), potassium (K), silicic acid (SiO2), sulphate ion ( ) and magnesium (Mg) etc. is conducted.
2. Experimental Procedures
2.1. Ultrasonic System
An ultrasonic cleaner used in this experiment is shown in Figure 1. A specification of the ultrasonic cleaner is as follows: Model: SC-320F, Output: 300 W, Power source: AC100 V, 50/60 Hz 6 A, Oscillated frequency: 28 KHz ± 10%, Date of manufacture: May 2010, Equipment number: 3Y0101, Maker: STM Co. Ltd., Japan.
2.2. Experimental Condition
In this study, the standpoint is to understand how the hardness and other contaminants are decreased in each water sample by irradiating ultrasonic waves. An irradiation experiment was carried out using an ultrasonic cleaner as shown in Figure 1 at a frequency of 28 KHz as mentioned above in this experiment. Here we confirmed that the influence on position of the samples is not relating to the result. An experimental condition is as follows:
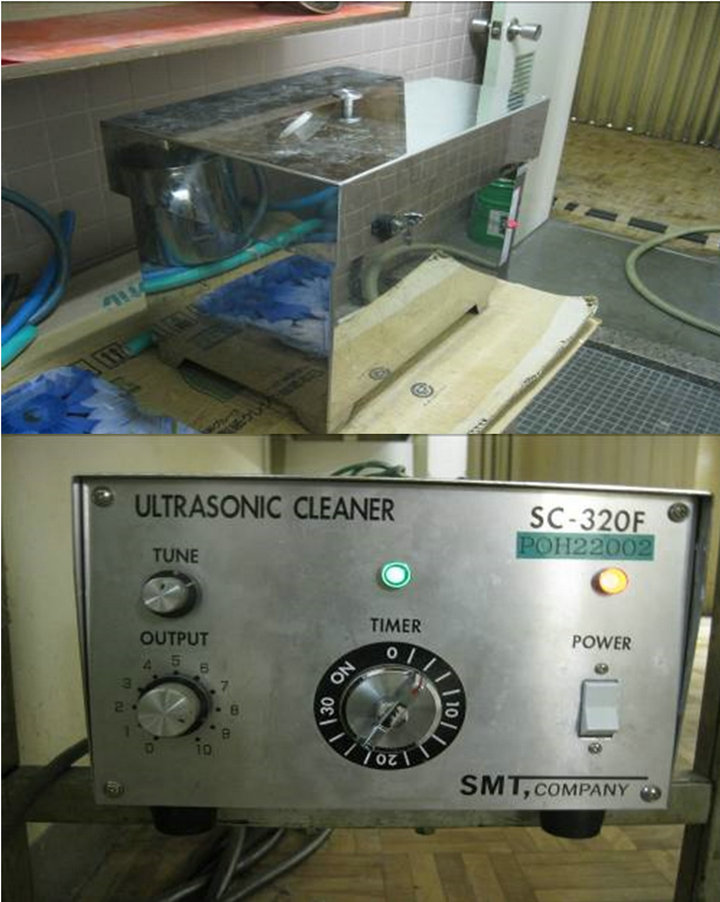
Figure 1. Photograph showing ultrasonic system.
Irradiation time: 30 min., 20 min. and 10 min. (3 phases).
Test sample of drinking water focusing hardness: 6 kinds (Table 1).
It is easy for us to get all drinking waters except for drinking water 2 because of a purchasing system in which only special contracted buyer can get. Items of water qualities centering “hardness” such as Ca, Mg, pH and those regarding drinking water indexes for healthy (Ca and Na) and/or tasty (Ca, K, SiO2, Mg and ) are picked up in Table 2. A theoretical calculation Equation (1) as mentioned below is well-known as an expression of hardness.
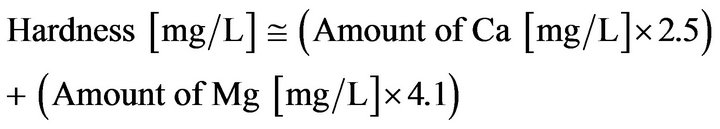 (1)
(1)
A calculation result of “hardness” using Ca and Mg is almost as same as the value expressed in the label of each drinking water, respectively. However, regarding drinking water 2, although Ca and Mg were expressed in the label, “hardness” was not expressed. Therefore, Hardness has been calculated using the Equation (1). As a result, we got the value of 59 (mg/L) as a theoretical one, which is quite higher than that of actual value 15 (mg/L). In addition, this value 59 (mg/L) is quite higher in comparison with that of other 5 drinking waters. Then we tried to measure the amount of Ca and Mg regarding the drinking water 2 once more. As a result, we confirmed a difference between the value of the label and actual measured value. In addition, water qualities parameters such as Na, K,  and BOD at irradiation time 30 min are shown in Table 2.
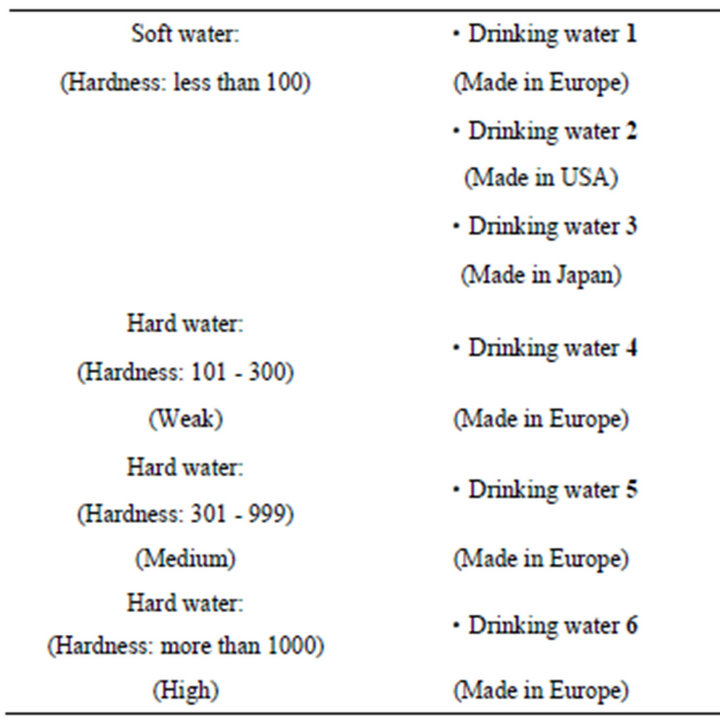
Table 1. Description of drinking water samples.
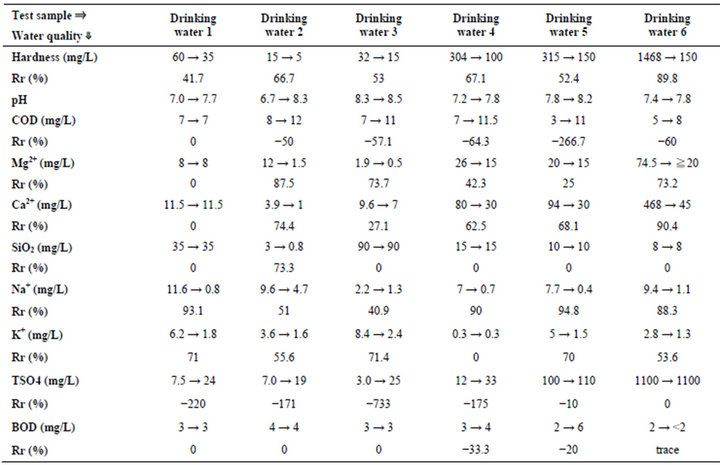
Table 2. Experimental results (Irradiation time: 30 min., water temp.: 22.7˚C (start) - 27.9˚C (end)).
2.3. Analytical Method of Water Quality
The analysis of the water quality was conducted in the laboratory. Simplified water quality analysis kit made by Kyoritsu chemical-check lab., corp., Japan was used for examining Hardness, pH, COD, Mg, Ca, SiO2. and ICP emission spectrometry for Na and K, and ion chromatography for , and diaphragm electrode method for BOD, respectively.
3. Results and Discussions
All measured results are shown in Tables 2-4. The pH value increases after irradiating in all cases. This estimates that sulfate ( ) decreases and combines with a chemical compound (neutralization). That is, it is suggestive of the occurrence of the following reactions.
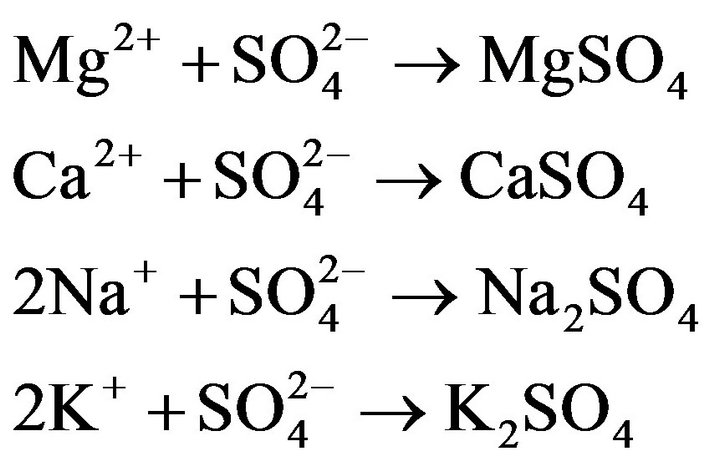
Therefore these reactions seem to be roughly appropriate (K+ ≒ Na+, Ca+, Mg+) in considering the decreasing trend of the concentration. In addition, we see that  does not increase in spite of the decrease of Ca in drinking water 5 and 6. It is probably due to a problem of the analytical precision exists. Furthermore, the question has been raised on why
  is originally high or where this ion comes from in drinking water 5 and 6. Figure 2 shows a comparison of changing hardness between irradiation time 0 min. and 30 min (immediately after experiment). It is understandable that hardness in each sample is decreasing. First of all, drinking water 6 is about one tenth compared with at 0 min. and next, about one second for drinking waters 1, 3 and 5, and then, about one third for drinking waters 2 and 4, respectively. In the experiment, a decreasing of concentration of Ca and Mg is observed in the water. It is thought that this is due to an effect of ultrasonic waves. It is estimated that this is due to the liberation of the solid and solidification of the same substances (Ca, Mg) because suspended solids are observed in the water (concentration drop in water). And a slight increase of the temperature by activation of molecular motion due to the irradiation of ultrasonic waves is also observed. It is known from the standpoint of property of water that a saturated concentration increases associated with the increase of water temperature. However, the reverse change is brought in this experiment (decrease of saturated concentration). In addition, it is thought that a possibility of undergoing any oxidation-reduction reaction
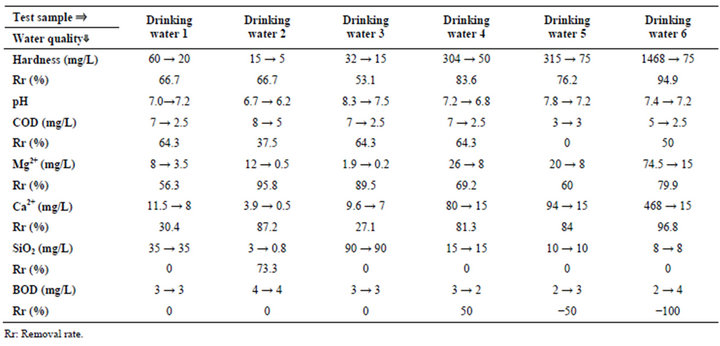
Table 3. Experimental results (Irradiation time: 20 min., water temp.: 29.0˚C (start) - 31.7˚C (end)).
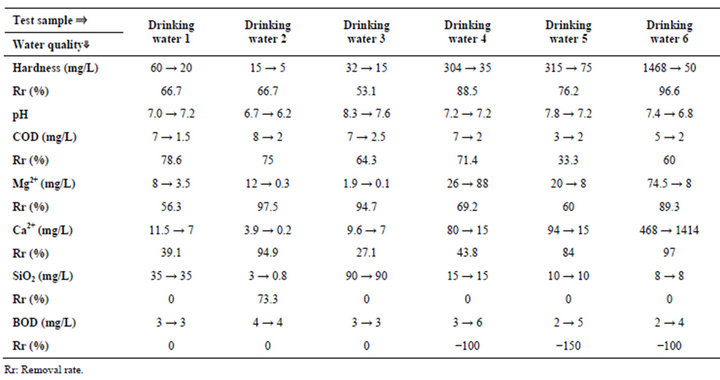
Table 4. Experimental results (Irradiation time: 10 min., water temp.: 30.6˚C (start) - 32.5˚C (end)).
as the change for pH and COD can be seen.
Figure 3 shows a comparison of hardness among irradiation time 30 min., 20 min. and 10 min. The experimental results confirmed an increase of about 5˚C with respect to the irradiation time 30 min.
Then we carried out an examination decreasing irradiation time (20 min. & 10 min.) and recorded the corresponding temperature. In irradiation time of 20 min. and 10 min., the increase of the temperature came to about 2˚C. Under this temperature, it was found lower value of many water quality parameters including hardness. It is observed in the experiment that the extent of suspended solid in the water after irradiating the time of 20 min. and 10 min. is almost equal to the case for 30 min. Therefore, it seems that the irradiation by ultrasonic waves is brought into the result in which many water quality parameters are shown lower tendency. However, at present it is very difficult to compare with the effect among irradiation times (30 min., 20 min. and 10 min.) quantitatively (for example, short irradiation time is more effec-
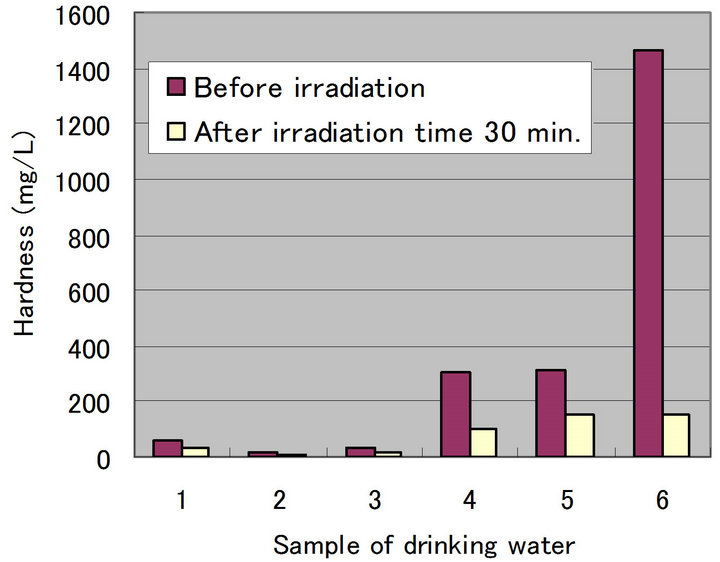
Figure 2. Change of hardness after irradiation time (30 min.).
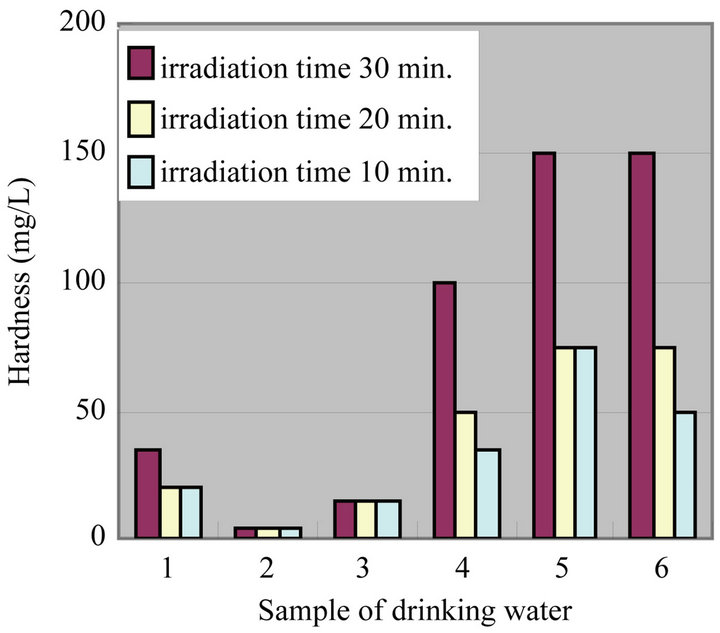
Figure 3. Comparison of hardness among irradiation time 30, 20 and 10 min.
tive than long one regarding the change of “hardness.”), which warranting further examination on this.
Figures 4-8 show a change of water qualities such as Ca, K, SiO2, Mg and  of drinking water at irradiation time 30 min. These items of water qualities are items on tasty water index (O Index) [9]. This O Index is shown in Equation (2), it is recognized that the value of more than 2 in O Index is tasty drinking water.
 (2)
(2)
In all drinking waters, there is not a large change in a denominator (Mg +  but large change in a numerator (Ca + K [except for SiO2]). Therefore, there seems to be a possibility that an irradiation by ultrasonic waves to drinking water increases the O-index which means that the taste of water is improved. Figure 9 shows a change of water quality of Na of drinking water at irradiation time 30 min. This water quality parameter together with Ca are related to taste of drinking water which is called K index and given in Equation (3). It is recognized that the value of K index more than 5.2 is wholesome drinking water.
Ca - 0.87 Na (3)
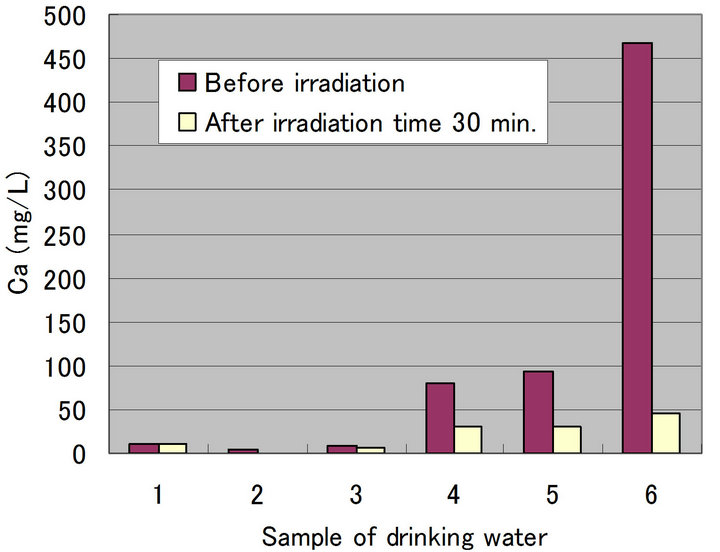
Figure 4. Change of Ca at irradiation time 30 min.
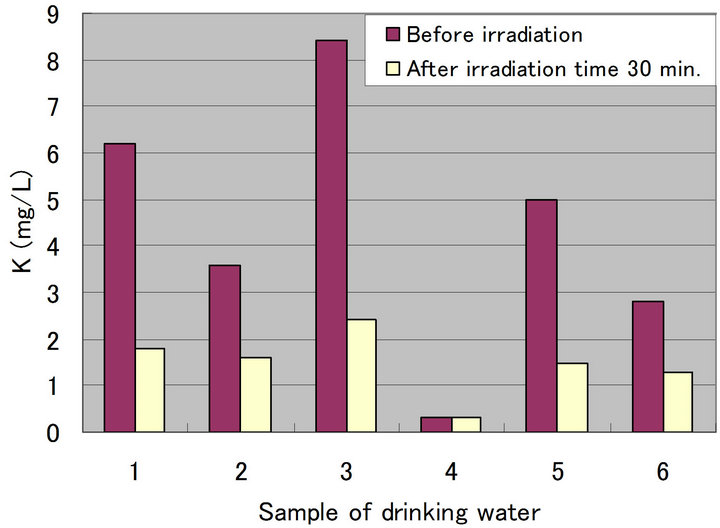
Figure 5. Change of K at irradiation time 30 min.
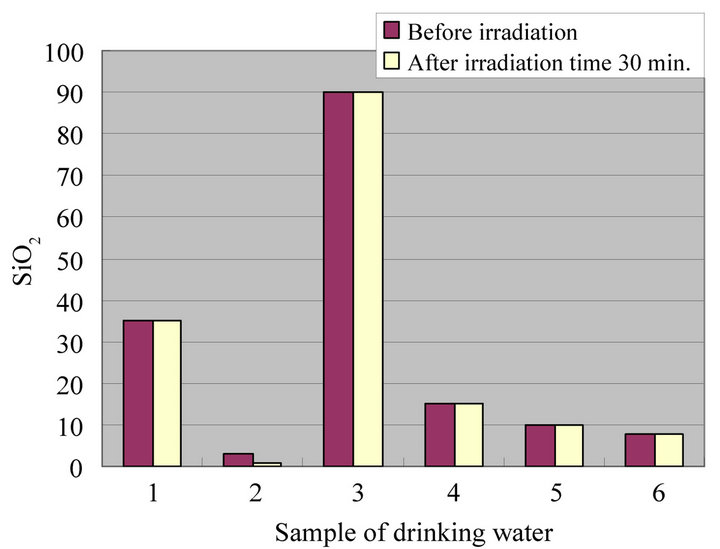
Figure 6. Change of SiO2 at irradiation time 30 min.
It does not exist large difference in the drinking waters 1, 2 and 3 for Ca, but exists large one in drinking waters 4, 5 and 6, respectively. In addition, there is a decreasing tendency for Na in all drinking waters. Especially, it is understandable that the drinking waters 2 and 3 have a large change. Therefore, there seems to be a possibility that an irradiation by ultrasonic waves improve the quality and taste of water significantly.
Figures 10-12 show a removal rate of Hardness, BOD
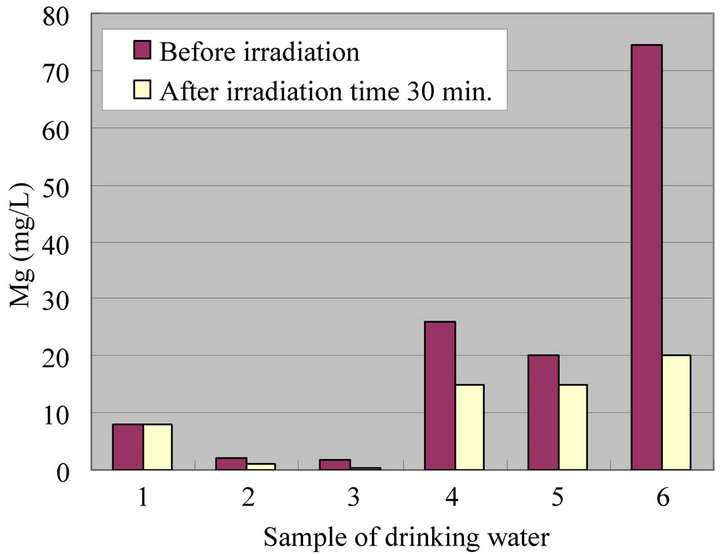
Figure 7. Change of Mg at irradiation time 30 min.
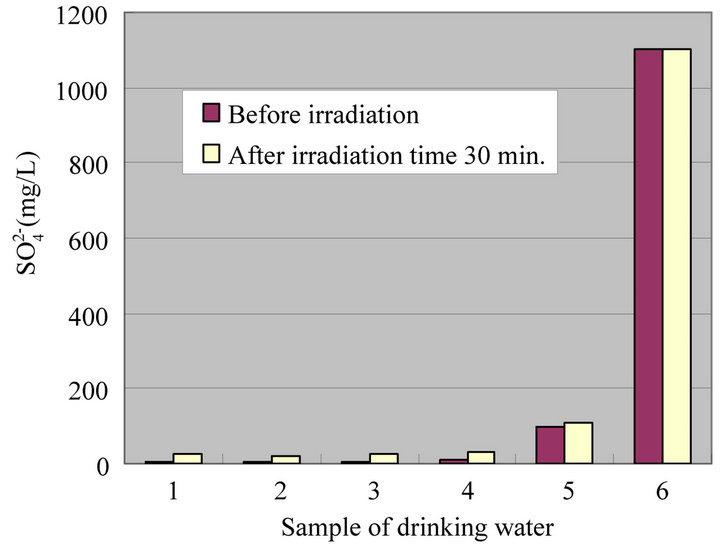
Figure 8. Change of  at irradiation time 30 min.
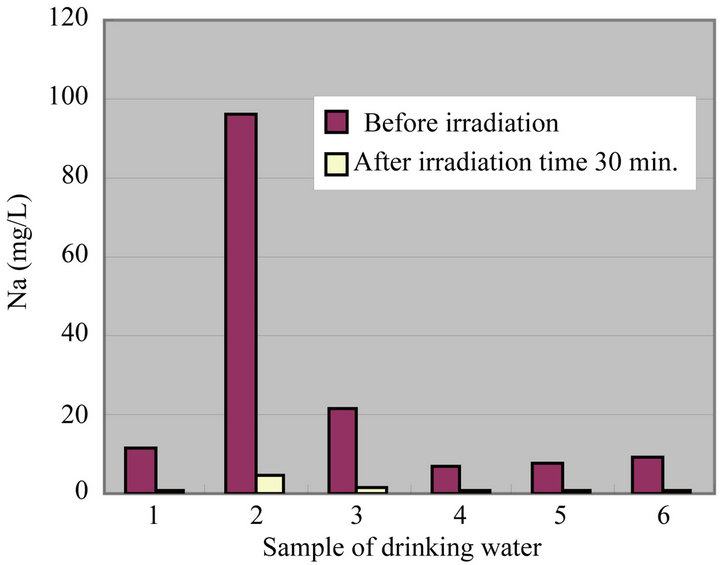
Figure 9. Change of Na at irradiation time 30 min.
and COD in different irradiation time (10 min., 20 min. and 30 min.), respectively. As can be seen from Figures 10-12, the removal rate of the hardness component showed about 42% - 90% in irradiation of 30 min., about 53% - 95%, 20 min. and about 53% - 97%, 10 min., respectively. All the values showed the positive ones (in
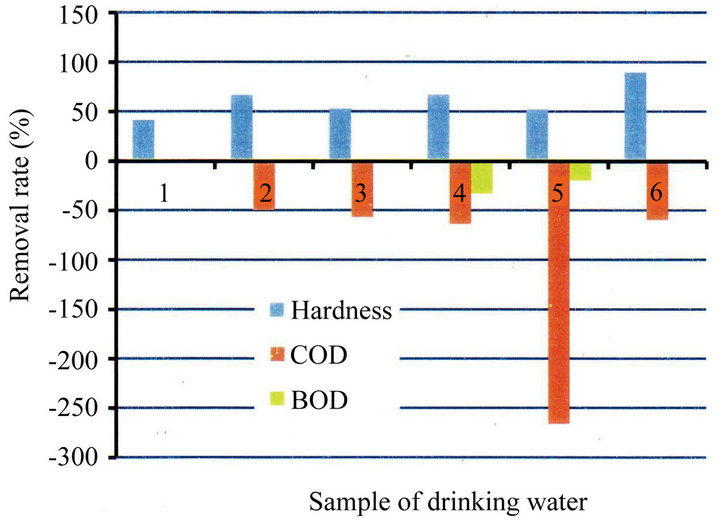
Figure 10. Removal rate of hardness, COD and BOD due to irradiation time (30 min.).
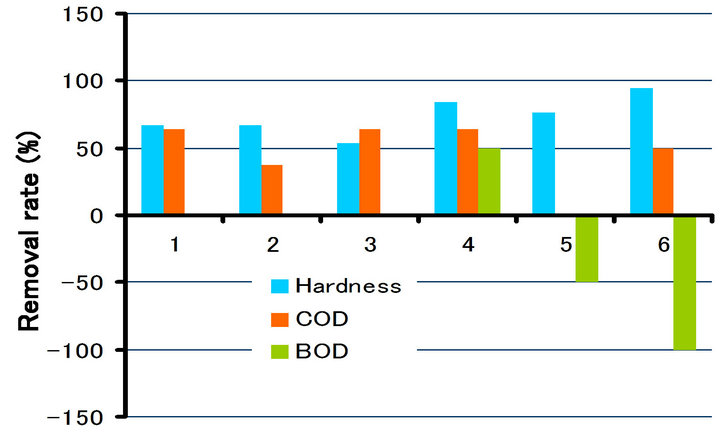
Figure 11. Removal rate of hardness, COD and BOD due to irradiation time (20 min.).
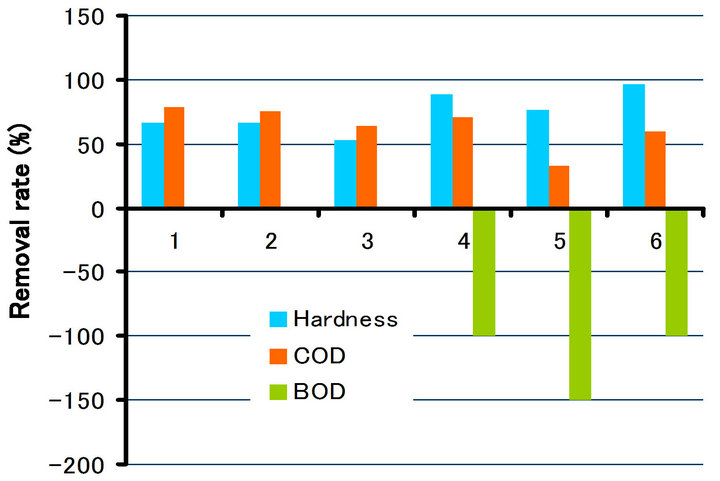
Figure 12. Removal rate of hardness, COD and BOD due to irradiation time (10 min.).
decrease). On the other hand, BOD and COD showed the negative ones (in increase) at approximately half of the samples. It can be seen from the change of the impurities (Tables 2-4) that the concentration of the impurities in drinking water decreases due to irradiation, and thereby the increase of the seeming rate of BOD and COD is considered. In that sense, it also can be thought that the impurities were removed completely.
4. Conclusions
In this study, an examination for the improvement of water treatment process using ultrasonic waves was carried out. As a result, frequency of ultrasonic waves affecting water quality describing hardness, especially the content of calcium (Ca), sodium (Na), potassium (K) and magnesium (Mg) was confirmed. There will be a possibility to make tasty, healthy and immune water if we could have water containing many of the ingredients such as Ca, K and SiO2.
Regarding the removal rate of the hardness, BOD and COD due to irradiation time, the removal rate of the hardness component showed high value of about 42% - 97% at each irradiation time. On the other, BOD and COD, the possibility of the complete removal of impurities is supposed at each irradiation time.
The experimental results confirmed that the ultrasonic waves accelerated the reaction better and improved the water treatment process as well as taste of water significantly. The experimental results also revealed that it is very difficult to compare the efficiency of water treatment process with the effect among irradiation times (30 min., 20 min. and 10 min.) quantitatively which warranting further examination on this.