Body Composition and Metabolic Risk Factors in Postmenopausal Women: Effects of a Dietary Weight Loss Program ()
1. Introduction
Menopause is one of the critical periods of a woman’s life during which weight gain is favored [1] and obesity prevalence is the highest across lifespan [2-4].
Epidemiological data suggest that weight gain during the menopausal transition is due to aging, decreased leisure-time physical activity, and hormonal changes [1,5]. Aging and reduced physical activity were associated to a gradual decrease of FFM (Fat-Free Mass) with consequent reduction on RMR (Resting Metabolic Rate) and increased body fat [6]. Furthermore the decline of endogenous estrogens induces the increase of visceral adiposity [7].
There is increasing evidence that weight gain and in particular visceral obesity are predictors of metabolic alterations including insulin resistance, glucose intolerance, lipid disorders and high blood pressure [8]. This cluster of risk factors identifies the metabolic syndrome (MS).
Data in literature showed that both nutritional status and postmenopausal status play an important role as determinant of MS. Case CC et al. [9] showed that MS was prevalent in 68% of a cohort of 185 obese individuals. Dietary patterns are associated with glucose intolerance, insulin resistance and other features of the metabolic syndrome. In particular scientific evidences recommended a healthy balanced diet, with Mediterranean diet characteristics (fruit and vegetables, legumes, whole grains, dietary fiber, fish, vegetable protein and vegetable fat from olive oil) as the main components of metabolic syndrome and chronic diseases prevention [10,11].
Studies performed on postmenopausal women showed that 13.7% to 41.5% had the MS [12-14]; moreover postmenopausal status according to years since menopause was identified as an independent risk factor for MS [15]. Finally epidemiological studies showed that prevalence of MS tended to increase steadily in parallel with a marked rise in BMI and waist circumference through the menopausal transition [16].
MS is associated to an increased cardiovascular risk. Epidemiological studies have shown that individuals with the MS have a three fold increase in cardiovascular diseases and a significant increase in cardiovascular mortality [17].
The management of MS is thus a necessary strategy to improve cardiovascular risk. At this purpose current guidelines (International Diabetes Foundation, 2005) propose weight loss as one of the first therapeutic goal to achieve [18]. For instance, Case CC et al. (2002) [9] showed that moderate weight loss with a very low calorie diet markedly improved all aspects of MS in obese individuals.
Although the relationship between nutritional status and MS [8,9] and between menopause and MS has been documented [7,19], no study focused on MS in postmenopausal women who seek a weight-loss program, nor the effects of a structured dietary intervention in this kind of individuals has been reported.
Therefore in this study we observed the prevalence of MS among postmenopausal in one center for the assessment of nutritional status and we examined the efficacy of a hypocaloric balanced diet on the improvement of nutritional status and on management of MS.
2. Methods
2.1. Study Subjects
The study was performed at the International Center for the Assessment of Nutritional Status (ICANS), University of Milan (Italy). Study subjects were recruited among Caucasian postmenopausal women who spontaneously came to ICANS for weight loses. Menopausal status was identified as the absence of menses for at least 12 consecutive months or as current hormonal replacement therapy after menopause diagnosis by a gynaecologist or as surgical menopause. Exclusion criteria comprised psychiatric disorders, cancer, severe cardiovascular events and chronic illness affecting nutritional status. The present study was carried out according to the guidelines of the Declaration of Helsinki and written informed consent was obtained from every patient before measurements were made. The institutional review board approved the study procedures.
2.2. Experimental Design
At the beginning of the study every woman underwent a clinical and nutritional status evaluation composed by medical examination, body composition assessment (anthropometry and ultrasonography of visceral abdominal fat), lifestyle and dietary habits investigation, indirect calorimetry for resting energy expenditure measurement, blood pressure measurement, examination of biomedical parameters related to MS.
Patients underwent check up every two months in order to evaluate the compliance to dietary intervention (by an interview with the dietician), and the effects on nutriational status (by anthropometry and blood pressure measurement).
In patients resulted affected by MS at the first visit, the diagnosis of MS was reassessed when 10% weight loss was achieved and visceral abdominal fat (VAT) and biochemical parameters were reassessed.
2.3. Anthropometry
Anthropometric measurements were taken by the same operator, according to standard criteria and measuring procedures [20].
With a subject wearing only underwear, weight (to the nearest 0.1 kg) and standing height (SH; to the nearest 0.1 cm) were measured using the same calibrated scale that had a telescopic vertical steel stadiometer (SECA 711, Hamburg, Germany).
BMI (Body Mass Index) was calculated as weight (kg)/stature (m)2. Waist circumference (Wc) was measured as proposed by Lohman et al. [20].
To measure Wc, the top of iliac crest and the end of the last rib were located. A measuring tape was placed in a horizontal plane around abdomen at level of the mean point between iliac crest and last rib. Before reading tape measure, we ensured that tape is snug but did not compress the skin and was parallel to floor. Measurement was made at the end of a normal expiration.
Skinfold thickness was measured as proposed by Lohman et al. [20] using a Holtain LTD calliper. Biceps, triceps, subscapular and soprailiac skinfolds were considered in analysis of body density and fat mass (FM) (%), which were calculated by the Durnin and Womersley method and by Siri’s formula, respectively [21].
Visceral adipose tissue (VAT) was measured by a physician using ultrasonography (US). All ultrasonographic procedures were performed by the same examiner using a 3.5-MHz probe located 1 cm from the umbilicus. Two US measurements of intraabdominal (“visceral”) and subcutaneous fat were taken. US-determined subcutaneous fat was defined as the distance between the skin and external face of the rectus abdominal muscle, and visceral fat was defined as the distance between the internal face of the same muscle and the anterior wall of the aorta [22].
2.4. Indirect Calorimetry
Resting Energy Expenditure (REE) was estimated by an open-circuit ventilated-hood system (Sensor Medics Wmax29, Anaheim, CA). All measurements were made in the post-absorptive state (12 - 14 h fasting) in a thermo neutral environment (24˚C - 26˚C) and with no external stimulations. The subjects were allowed to rest awake in the supine position for at least 20 min prior to the measurement. About 30 min of respiratory gas exchange data were then collected. The first 5 - 10 min of data were discarded, as recommended by Isbell et al. [23] This allowed the subjects to acclimate to the canopy and to the instrument noise. The average of the last 20 min of measurements was used to determine REE for 24 h according to standard abbreviated Weir equation [24]. The measured REE was compared with the predicted REE, according to the equations of Harris and Benedict [25].
2.5. Blood Pressure Measurement
Blood pressure (BP) was measured with a random-zero mercury sphygmomanometer by a physician after at least a 10-min rest.
2.6. Definition of Metabolic Syndrome
The Metabolic Syndrome was defined using criteria proposed by the International Diabetes Foundation (IDF) (2005). The IDF clinical definition makes the presence of abdominal obesity necessary for diagnosis: for women of European origin, such as the subjects of this study, the IDF specified thresholds for abdominal obesity to be waist circumference ≥80 cm. When such is present, two additional factors of the following listed are sufficient for diagnosis: triglycerides ≥150 mg/dl or drug therapy for elevated triglycerides, HDL cholesterol <50 mg/dl or drug therapy for reduced HDL, systolic pressure ≥130 mmHg or diastolic pressure ≥85 mmHg or antihypertensive drug treatment, fasting glucose ≥100 mg/dl or drug treatment for elevated glucose. On the basis of the presence or not of MS, the sample was divided in two groups: MS+ and MS−.
2.7. Dietary Intervention
After the first visit all women received a dietary program providing at least the 90% of resting energy expenditure and structured on the indications from Guides Lines for an Healthy Nutrition [26] and Recommended Assumption Levels of Energy and Nutrients for Italian Population [27]. The macronutrient composition of the dietary programs were balanced in macronutrient composition as indicated in Table 1. Three-five servings of fruit and vegetables were daily advised; the source of protein intake was dependent on the frequencies of consumption of meat (2 times/weeks), fish (4 times/week), legumes (4 times/week), eggs (1 time/week), low-fat cheese (1 - 2 time/week), low-fat ham (1 - 2 time/week). Olive oil is indicated as the main culinary lipid. Dietary cholesterol was lower than 200 mg/die and fibre intake was about 30 g, in agreement with Guide Lines for a Healthy Nutrition.
2.8. Statistical Analysis
Statistical analysis was performed using Statistix V. 7.0.
All data were expressed as mean ± sd for continuous variables and as % for categorical variables. Variable continuous and categorical in MS+ and MS− women were compared using Student’s t test and the X2 test respectively. Quartiles of VAT were indicated as median and range.
Univariate and multivariate logistic regression analysis were used to calculate the crude and adjusted odds ratios (ORs) considering age, years since menopause, surgical menopause, instruction level, obesity and VAT as potential risk factors associated with MS in menopause. ORs were expressed with 95% confidence intervals (CI).
All comparisons were made two-sided, and a p value < 0.05 (two-tailed) was considered significant.
3. Results
Between November 2010 and March 2011, 677 subjects spontaneously referred to ICANS to obtain dietary treatment. Among them, 161 were postmenopausal women, of which 10% normal weight (18.5 ≤ BMI ≤ 24.9 Kg/m2), 45% overweight (25 ≤ BMI ≤ 29.9 Kg/m2) and 45% obese (BMI ≥ 30 Kg/m2). One hundred fifty-five postmenopausal women showed a Wc ≥ 80 cm and among these, 70 showed at least two additional factors to make diagnosis of MS. Therefore the 43.5% of postmenopausal sample was suffering from MS.
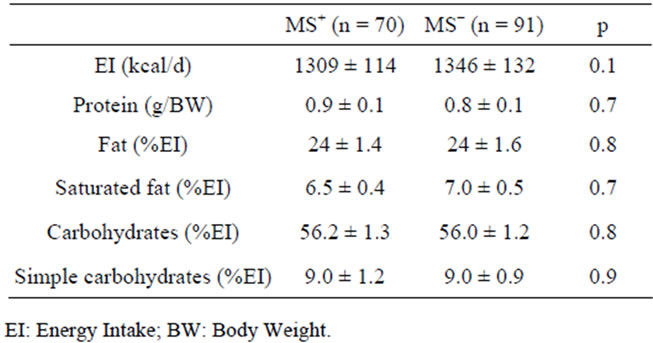
Table 1. Energy and Macronutrient composition of dietary protocols.
The distribution of MS in relation to BMI resulted: 67% among obese woman, 26% among overweight and 29% among normal weight.
3.1. Characteristics of the Study Sample at Baseline
The characteristics of the study sample at baseline, divided in MS+ and MS− groups, are presented in Table 2.
The MS+ sample resulted slightly older and with a greater duration of menopause than MS− sample. Moreover we observed in MS+ women a greater prevalence of surgical menopause and of low instruction level. Compared with MS− women, MS+ women had a greater weight, BMI, Wc, FM, VAT, BP, fasting glucose and a lower HDL cholesterol. REE, but not REE/BW, resulted greater in MS+ women (1392 ± 167 kcal vs 1452 ± 180 kcal, p = 0.01; 18.4 ± 1.9 kcal/kg vs 18 ± 1.8 kcal/kg, p = 0.1). No significance difference was observed between measured REE and predicted REE in both groups (MS+: +2% ± 8%, p = 0.1; MS−: −1% ± 7.5%, p = 0.1).
With respect MS−, MS+ women were more frequently obese (67% vs 27%, p = 0.01), less frequently overweight (24% vs 59%, p = 0.04) and similarly normal weight (9% vs 13%, p = 0.3).
VAT thickness was categorized in quartiles and related to relative MS frequency as shown in Table 3. Only the subjects in the highest quartile had significantly higher MS prevalence than subjects in the lowest quartiles.
Results of multiple logistic regression are summarized in Table 4.
Univariate analysis showed age, postmenopausal status since at least 5 years, low instruction level, obesity (BMI ≥ 30 Kg/m2) and VAT > 6.6 cm as predictors of MS in menopause; multivariate analysis showed the BMI ≥ 30 Kg/m2 and VAT > 6.6 cm as independent risk factors.
Table 5 describes the prevalence of individual components of MS at baseline. Among criteria for MS diagnosis, hypertension was the most frequently met followed by hypertriglyceridemia, altered fasting glucose and low HDL cholesterol. Although Wc ≥ 80 cm is the main and essential criterion for MS, however the difference between MS+ women and MS− women was marginally significant (p = 0.05).