Thermal Conductivity and Microstructure Properties of Porous SiC Ceramic Derived from Silicon Carbide Powder ()
1. Introduction
Porous SiC ceramic attracted much attention recently for their special structural properties, high strength and hardness, good mechanical properties and excellent chemical stability, particularly at high temperatures and hostile atmospheres. Porous SiC ceramic can be applied in many areas, such as for catalyst supports [1], hot gas or molten metal filters [2-4], high temperature membrane reactors [5], thermal insulating materials [6], gas sensors [7].
Many studies were about preparing porous SiC ceramic by different synthetic methods, or characterizing them on mechanical and structural properties. Dey et al. prepared porous SiC ceramic with good flexural strengths by an infiltration technique [8]. Bai et al. used Fe2O3 as pore-forming agent for preparation of SiC porous ceramic [9]. Maity et al. synthesized porous SiC with a mean fracture strength value of 303.9 MPa from cellulosic bio-precursor [10]. Li et al. studied the influences of molding pressures, bonding phase contents, and SiC particle sizes on the flexural strength of SiC-based porous ceramic [3]. Thermal conductivity is a key factor for the application of porous SiC ceramic at high temperatures. But the thermal conductivity of porous SiC ceramic was less studied [11,12].
Because thermal conductivity was affected by many factors, such as the sample porosity, microstructure, chemical composition, and manufacturing process, it is necessary to study the thermal conductivity of porous SiC ceramic. The focus of this manuscript is to prepare porous SiC ceramic with silicon carbide powder and silicone resin by the process of mixing, iso-static pressure molding, and calcinations. The microstructures, mchanical properties, and thermal conductivity of the samples were also studied.
2. Materials and Methods
2.1. Preparation of Porous SiC Ceramic
Green α-SiC powders and DC249TM silicone resin were as the starting materials. The solvent for DC249 TM silicone resin was acetone. All the chemicals were supplied by the Beijing Chemical Reagents Company (China).
The SiC powders and DC249TM silicone resin with various mass ratios (100:0 - 47:3) were mixed with acetone solvent. And after stirring the mixture for 1 h, the acetone was evaporated at 353 K for 24 h with a manual stirring every 6 h. The above powders were ground to a particle size 75 μm and then were pressed into cylindrical specimens (diameter 30.00 mm, height 4.20 mm) under 80 - 120 MPa. The specimens were fired in air at 1273 K for 2 h, with a heating rate of 20 K∙min−1.
2.2. Characterization
The phase analysis of the samples was performed by XRD (XD-3X diffraction meter, filtered CuKα radiation, 2θ: 10˚ - 80˚, scan step: 0.02˚, scan rate: 8˚ min−1). The compressive strength was measured using an Instron- 1195 universal testing machine with a cross head speed of 1 mm∙min−1. The microstructure was observed with a scanning electron microscope (SEM, JEOL JSM-6510A) at an acceleration voltage 10 kV. The pore distribution and average pore diameters of the samples were determined by mercury injection (AUTOSCAN-33). The thermal conductivity of the samples was measured with a thermal conductivity instrument (TC3000) made by the Xian Xiaxi company in China. The thermal conductivity of each sample was the average of three time measurements.
3. Results and Discussion
3.1. Mechanical Properties
The samples named SP0, SP2, SP4, and SP6 were prepared using 0:100, 1:49, 1:24, and 3:47 mass ratio of DC249TM silicone resin and SiC, respectively. The corresponding molding pressure was labeled after the sample name, such as SP0-80, meaning the molding pressure 80 MPa. The compressive strengths of the samples (Table 1) varied from 14.3 MPa to 19.4 MPa, and increased with increasing molding pressures, but decreased with increasing DC249TM silicone resin/SiC mass ratio. The compressive strength of porous SiC ceramics is mainly influenced by the porosity and the compositions. Chen et al. [13] reported the maximum compressive strength of SiC ceramic foam was only 2.48 MPa. The compressive strength of our samples (average 16.92 MPa) was about 6.82 times of the SiC ceramic foam, mainly due to the different porosity of the SiC ceramic foam (77%) and our samples (SP4-100 and SP6-100: average 35.76%).
3.2. Microstructures
The phases of the samples SP2-80, SP4-80, and SP6-80 are β-SiC and quartz, detected by XRD in Figures 1-3. The change of DC249TM silicone resin/SiC mass ratio did not cause obvious influence on the phases of the samples. The phases in our samples are in accordance with that given by Dey et al. [8]. But the quartz phase did not appeared, and the β-SiC phase was replaced by 4HSiC and 6H-SiC reported by Bai et al. [9], for a high sintering temperature at 2250˚C.
The SEM images of the samples SP2-100, SP4-100, and SP6-100 are shown in Figures 4-6. Scattered pores can be seen on the surfaces, and mainly inter granular pores. The pore diameters of inter granular pores are less than 20 μm, and the internal pores of the crystals about 2.0 μm - 2.5 μm.
Mercury injection results of SP4-100 and SP6-100 are
Table 1. Compressive strengths and thermal conductivities.
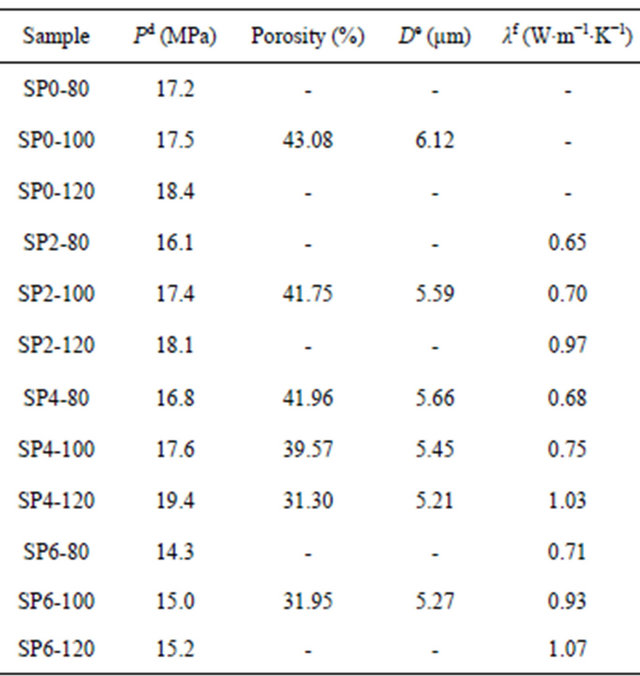
dCompressive strength; eAverage pore diameter; fThermal conductivity.
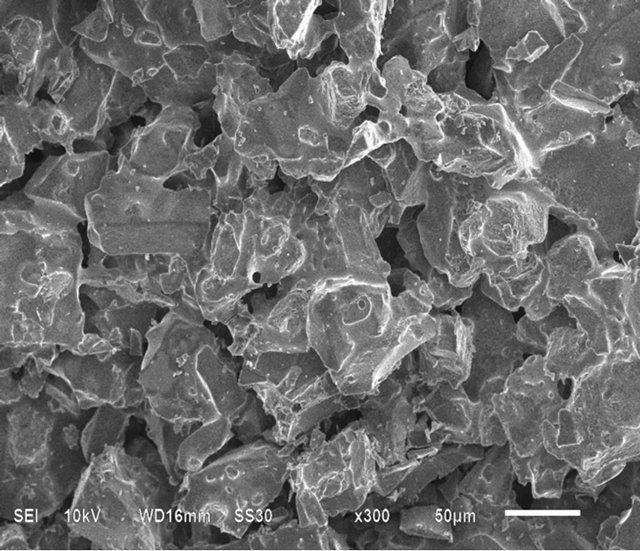
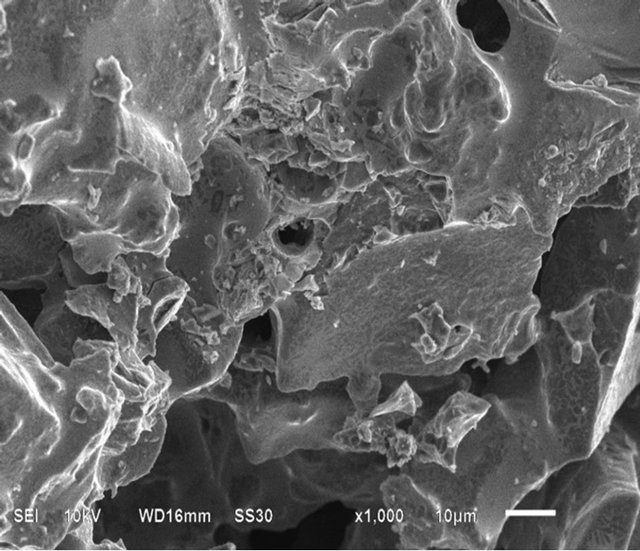
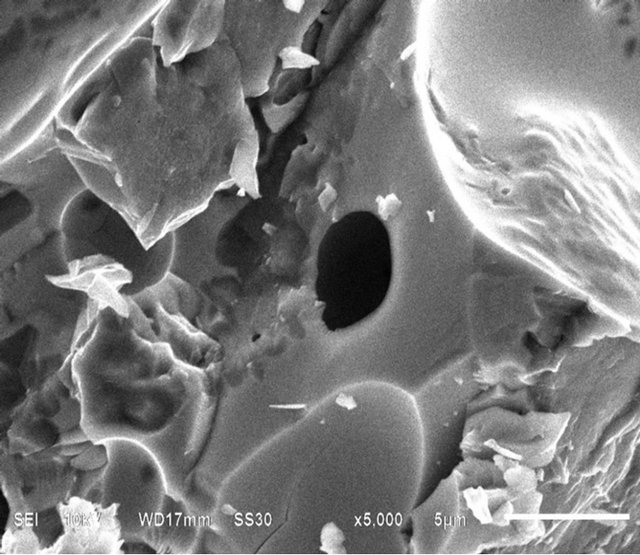
Figure 4. SEM imagines of sample SP2-100. (a) ×300; (b) ×1000; (c) ×5000.
shown in Figures 7 and 8. The peak pores formed in SP4-100 and SP6-100 are at 15.11 μm and 13.95 μm, respectively. The average pore diameters of SP4-100 and SP6-100 are 5.45 μm and 5.27 μm, respectively. The
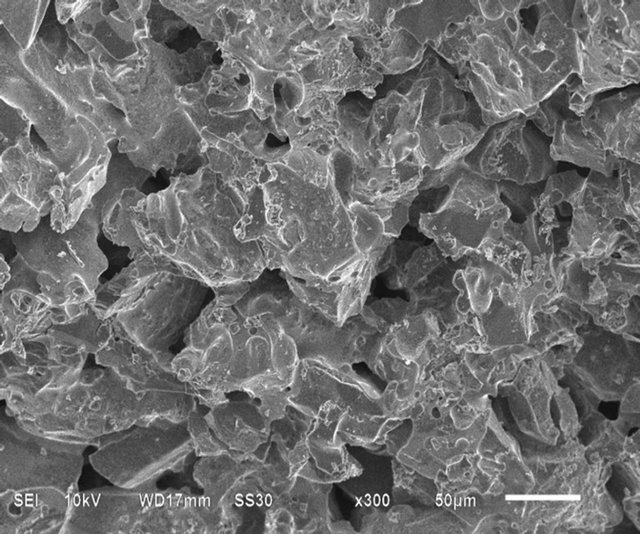

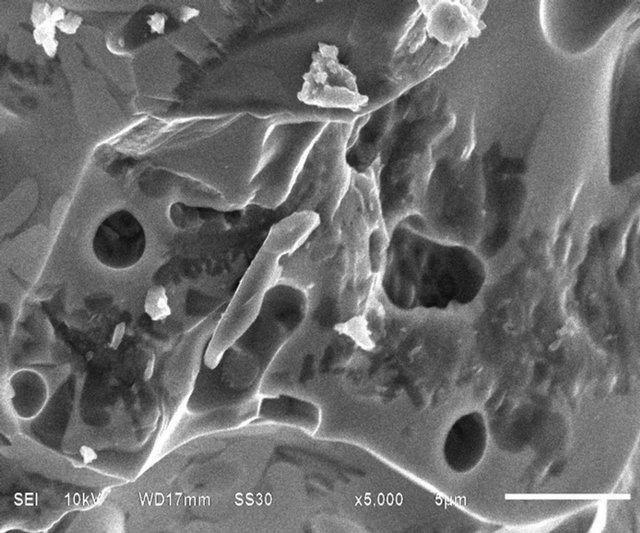
Figure 5. SEM imagines of sample SP4-100. (a) ×300; (b) ×1000; (c) ×5000.
peak pores and the average pore diameters decreased a little with increasing DC249TM silicone resin/SiC mass ratio. Because more DC249TM silicone resin lead to more closely stack of raw material granules. The pore diameters remained mainly between 10 μm and 25 μm for the both samples. The porosities of SP4-100 and SP6-100 are 39.57% and 31.95%, and the total pore areas of them are 0.151 m2∙g−1 and 0.134 m2∙g−1, respectively. The porosities and average pore diameters of other samples were presented in Table 1, instead of figures shown here, to avoid too many figures in this manuscript.
3.3. Thermal Conductivity
The thermal conductivities of SP2, SP4, and SP6 are listed in Table 1. The thermal conductivities changed from 0.65 W∙m−1∙K−1 to 1.07 W∙m−1∙K−1.
The thermal conductivities increased with increasing molding pressures and DC249TM silicone resin/SiC mass ratio. There are many different values published depending on SiC ceramic microstructure, composition

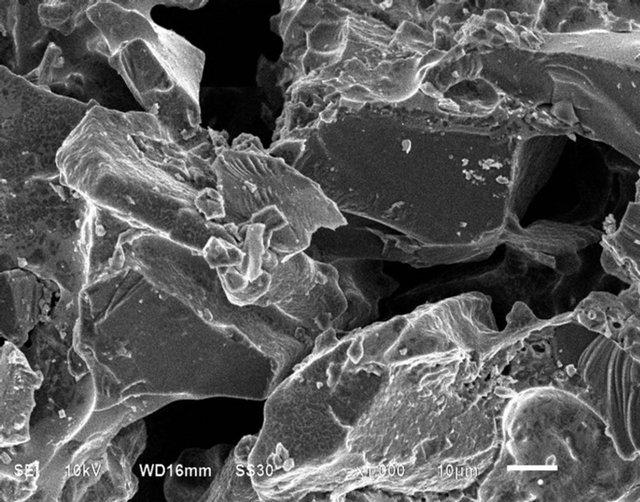
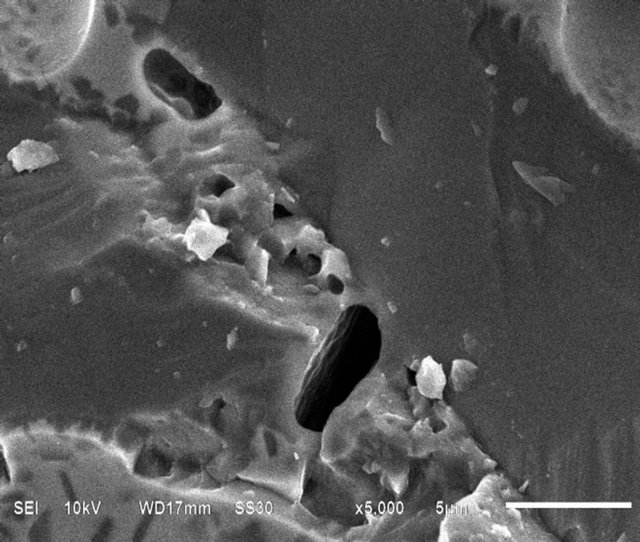
Figure 6. SEM imagines of sample SP6-100 (a) ×300; (b) ×1000; (c) ×5000.
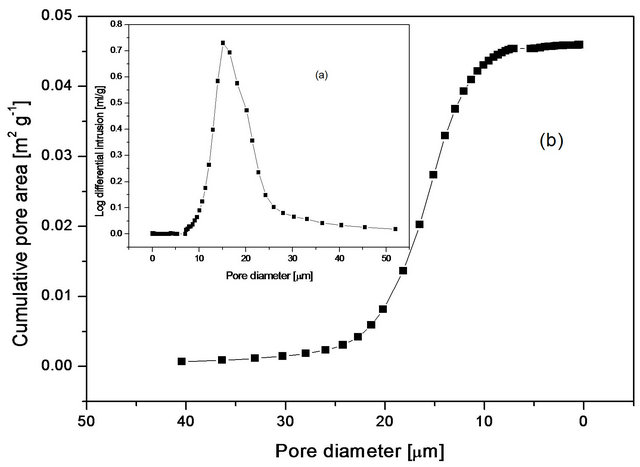
Figure 7. Mercury injection curves of sample SP4-100: (a) Pore distribution curve; (b) Cumulative Pore Area vs Pore size).
and processing method [11,14-16]. But in fact, the main factor to influence the thermal conductivities is the porosity of the samples. The thermal conductivities were increased from 0.68 W∙m−1∙K−1 to 1.03 W∙m−1∙K−1 with

Figure 8. Mercury injection curves of sample SP6-100 (a) Pore distribution curve; (b) Cumulative Pore Area vs Pore size).
the porosity decreasing from 41.96% to 31.30%, avoiding the molding pressures and the mass ratio factors, and reordering the porosities and thermal conductivities of all the samples in Table 1. And the thermal conductivities were also increased from 0.68 W∙m−1∙K−1 to 1.03 W∙m−1∙K−1 with the average pore diameter decreasing from 5.66 μm to 5.21 μm. This result is reasonable, for higher porosity meaning higher ratio of air phase in samples, and air having low thermal conductivity, ranking only second to vacuum.
4. Conclusion
Porous SiC ceramic were prepared with silicon carbide powder as the aggregate, silicone resin as the binder and pore agent by the process of mixing, iso-static pressure molding, and calcination. The compressive strengths of the samples were between 14.3 MPa and 19.4 MPa. The porosities reached up to 30%, and pore diameters ranged from 5.27 μm to 5.45 μm. The thermal conductivities changed from 0.65 W∙m−1∙K−1 to 1.07 W∙m−1∙K−1, and increased with increasing molding pressures and DC249TM silicone resin/SiC mass ratio. The thermal conductivities, mainly influenced by porosities, increased from 0.68 W∙m−1∙K−1 to 1.03 W∙m−1∙K−1 with the porosity decreasing from 41.96% to 31.30%.
5. Acknowledgments
The work was funded by the National Laboratory of Mineral Materials, China University of Geosciences, Beijing, People’s Republic of China (grant 06006, H03088 and H03122).
NOTES