Environmental Impact of Abandoned Asphalt Production Site on Soil, Water and Vegetables from Near Farmlands ()
1. Introduction
Roads are the most important medium of movement. Those finished with asphalt wearing course, are referred to as flexible pavement roads, while those finished with a reinforced concrete are referred to as rigid pavement roads. Morethan 90 percent of all the roads constructed in Nigeria are of the flexible pavement type [1] . The growing demand for road construction and expansion in Nigeria has led to a huge increase in asphalt production.
Bitumen, a dark brown to black cement-like semi-solid or solid or viscous liquid, plays a significant role in asphalt production as it acts as a binder to the aggregates. It is produced by the non-destructive distillation of crude oil during petroleum refining and consists of aliphatic and cyclic alkanes, aromatic hydrocarbons, heterocyclic compounds containing oxygen, nitrogen and sulphur as well as metals like nickel, vanadium and iron [2] .
Pollutants released into the air by the hot mix asphalt plants can be categorised as chronic toxicants, carcinogens and acute system toxicants [3] , which could result to irritation of the upper respiratory tract, headache, fatigue, wheezing and shortness of breath dizziness, and nausea [4] . Like other environmental pollution health effects, the possible health problems relating to asphalt plant pollution are dependent on the length of exposure and concentration of pollutants in the environment.
The environmental impacts of a proposed project are systematically collected, analysed and presented to inform a decision-making process [5] . The aim of this research is to assess the environmental impacts of asphalt production plants belonging to a construction company in Abinsin, Makurdi-Gboko, Road Nigeria. The research is limited tophysiochemical, biochemical and mineral analysis of soil, water and vegetable (plant) samples taken 500 m to 1200 m from the vicinity of the asphalt production plants (see Plate 1).
2. Study Area
Makurdi, with geographical coordinates 7.73˚N (latitude) and 8.52˚E (longitude), is the capital of Benue State located in the North-Central geopolitical zone of Nigeria. It is bordered in north by Guma Local Government Council Area
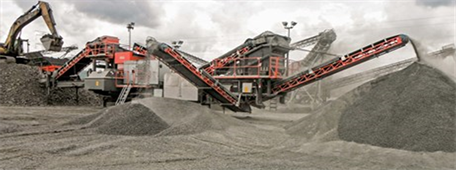
Plate 1. Asphalt Production Site [Anonymous].
(LGCA). The study area is located at Abinsin 29 Km north of Makurdi (Makurdi-Gboko road). The inhabitants are predominantly subsistent farmers.
3. Materials and Methods
Sampling: Water, soil and vegetable (plant) samples were collected in March, 2017.
Water Sample: Winchester bottles (amber, 2.5-L), thoroughly washed and rinsed with nitric acid (HNO3), was used in collection of water samples from three wells located in residential houses about 500 m away from the asphalt production. The beaker was rinsed three times with each of the well water to be sampled. The samples were thereafter combined into composite sample. Similar collection was done 1200 m away from the asphalt production plant and 5 mL nitric acid was added to each sample, transported in an ice bath to the laboratory and stored in a refrigerator at about 4˚C [6] [7] .
Soil: Sampling of the soil was carried out according to the method reported by Osuji et al. [2] . Samples were collected at (0 - 30 cm) depths from the vicinity at about 500 m from the asphalt production plant. Control samples were collected in similar manner at about 1200 m away from the plant at a site unlikely to have been affected by the post activities of the asphalt production plant. Three grab samples were collected cross-sectionals within the asphalt plant vicinity and thoroughly mixed to form a homogenous composite sample. The soil samples were transferred into aluminium foil formed bags, labelled accordingly and then transported to the laboratory.
Plants: Standard sampling method reported by Association of Official Analytical Chemists [8] was used. Edible parts (leaves) of Telfairiaoccidentalis were randomly collected from 500 m and Vernoniaamygdalina 1200 m away from the asphalt production plant. The plant samples were wrapped in brown envelop and properly labelled and taken to the Department of Botany, University of Agriculture, Makurdi, Nigeria, for identification and authentication.
Sample preparation: The samples were prepared following reports in standard procedures [6] [7] [8] . Soil samples were air dried for 96 hours. Clods were crushed and plant materials were removed. Using a clean porcelain mortar and pestle, each sample was ground to powder and sieved through a 2 mm mesh. Plant samples of Telfairia occidentalis and Vernonia amygdalina were washed and rinsed with distilled water before the edible stalk and leaves were detached and air dried. The air-dried leaves were transferred to electric oven and set to a temperature of 70˚C for 4 hours. After drying, each leaves sample was pound in a separate porcelain mortar and sieved through a 2 mm mesh before transferring into a transparent propylene container with appropriate label.
3.1. Digestion of Samples for AAS Analysis
Water: Digestion of water samples was carried out [9] . 50 mL of the acidified unfiltered water sample was mixed properly and transferred into a 250 mL beaker. 3 mL of concentrated nitric acid was added and covered with a watch glass and heat gradually on hot plate. Concentrated nitric acid was added continuously until digestion was completed. The solution was evaporated to near dryness and cooled. Small quantity of 1:1 concentrated hydrochloric acid was added and warmed. The watch glass and beaker walls were washed down with distilled water and filtered, and volume adjusted to 25 mL with distilled water for metal determination.
Soil: Digestion of soil was carried out using a method reported by Tukuraet al. [9] . 20 mL of HCl : HNO3 (3:1 v/v) was added to 5 g of the dried sieved soil sample and allowed to stand undisturbed for 24 hours. The mixture was then heated on a hot plate at 140˚C to near dryness but was not allowed to cake. The residue was filtered through Whatman No. 41, and the solution transferred into 50 mL volumetric flask, and made up to the mark with distilled water. This was preserved for heavy metal determination.
Plant: For the Digestion of vegetable leaves, 5 g of the sieved oven-dried sample was weighed into a porcelain crucible already washed with nitric acid and placed in a muffle furnace for 4 hours at 500˚C. The crucibles were removed from the furnace and cooled. After cooling, 10 mL of 6 M HCl was added, covered and heated on a steam bath for 15 min, and then 1 mL of water was added and was allowed to evaporate to dryness by continuous heating for 1 hour. 5 mL of 6 M HCl and 10 mL of water were added, and the mixture was heated on a steam bath to complete dissolution. The mixture was cooled and filtered through a Whatman no 41 filter paper into a 50 mL volumetric flask, then made up to mark with distilled water, ready for AAS analysis.
3.2. Extraction of Soil Samples for GCMS Analysis
In the extraction method [2] , 340 g of homogenised sieved soil samples were accurately weighed into clean dry Mayonnaise bottle and extracted three times with 200 mL of n-hexane after vigorous shaking for 4 hours’ interval. 4 mL of hexane was then added to the bottle and rinsed into a reagent vial. The sample extract was concentrated by allowing the hexane to completely dry off. The extracts were stored, and ready for GCMS analysis.
Data obtained were statistically analysed using one-way analysis of variance (ANOVA) and results presented as mean ± standard deviation (SD).
3.3. Impact Assessment
Geo accummulation Factor (Igeo): Igeo is generally used to compare the status of heavy metal concentration with the background (control) values. Igeo can describe the relationship between the measured element in the sediment fraction and the geochemical value in fossil argillaceous sediment or average shales. Geo-accumulation index was calculated [10] .
(1)
where Cn is the measured concentration of the element in soilor sediment and Bn is the geochemical background (control) value. The constant value, 1.5, is background matrix correction factor due to the lithological variations. Table 1 is a proposed descriptive classification [11] for the Igeo Values:
Contamination Factor: The contamination factor (CF) is expressed as
(2)
The CF ratio was estimated by dividing the concentration of each metal in the soil by the background/control value.
4. Results and Discussion
Visual Inspection of Samples and Sites (See Plate 2)
The textural classification of the study site and control site is sandy loam and loamy sand respectively. Particle size results in Table 2 shows higher values of sand followed by clay and then silt. The two different types of vegetable plant
![]()
Table 1. Classification of geo-accumulation index.
![]()
Table 2. Physicochemical parameters of soil samples from region around Abinsi asphalt production plant.
Subscripts 1 and 2 represent Analytical and Control samples respectively.
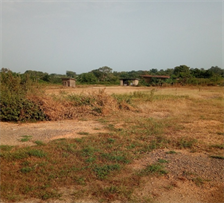
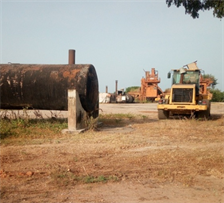

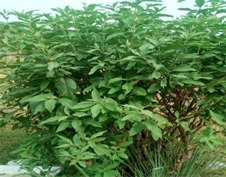
Plate 2. Photographs of Abinsi asphalt production site (Top left), Vicinity farmland (Top right), Vegetables; Vernonia amygdalina (Bottomn left) and T. Occidentalis (bottom right) cultivated on soil within Asphalt plant Vicinity.
used during this study were naturally green but stunted in growth. These changes in particle size of the soil are likely to cause the soil within the vicinity of the asphalt production plant to exhibit plasticity which allows water flooding and contamination [12] .
4.1. Physicochemical Parameter of Soil Samples
The physicochemical characteristics of soil samples from region around the asphalt production sites and those of control site are reported as mean values of triplicate analysis as presented in Table 2. The reported differences in values for each parameter unveiled the possible contribution by the asphalt deposits. More pronounced is the conductivity difference of 227 µS/cm when analytical sample (with more soluble salts contents) is compared with the control sample. Results were generally presented as mean values of triplicate analysis ± standard deviation computed via Microsoft office excel, 2007.
pH: From Table 2 the pH of the soil sample (S1) within the vicinity of the asphalt production plant is 6.81 ± 0.031 while that of the control (S2) is 7.10 ± 0.120. This suggests that asphalt production activities might have caused a slight increase in the acidity of the soil which is in line with other findings [12] , stating that acidic pH levels tend to have an increase in micronutrient solubility and mobility as well as increased heavy metals concentration.
Conductivity: the mean value of 467 μS/cm was recorded for the control site (S2) to 694 μS/cm for the study site (S1). The difference could be attributed to the increase in concentration of some soluble salts in the soil. This assumption is also in agreement with the work of Ezekiel et al. [13] that reported mean values of conductivity to be 1940 μS/cm at station 1, but very low conductivity of 70 μS/cm at station 3. They suggested that ionic content of station 1 might be responsible for its high conductivity.
Organic carbon: Table 2 shows an increase in mean value of organic carbon in soil from 0.90% (control) to 0.96% (sample). This increase suggests that the production activities at the asphalt production site may have brought additional amounts of organic carbon into the soil within the vicinity of the plant. This assertion seems to be in terms with GC-MS analysis results presented (not presented) which shows that searoyl-1H-imidazole (C2H38N2O), isobutylmethylketonebenzyloxime (C13H19NO), beta-1-Rhamnopyranoside (C21H25BO5), n-octyl chloride (C8H17Cl), n-heptylchloride (C7H15Cl) were absent in the control site (S2) but present in the study site (S1) some of which are in agreement with report already documented [14] .
Organic matter: Soil organic matter is the organic matter component of soil, consisting of plant and animal residues at various stages of decomposition, cells and tissues of soil organisms, and substances synthesized by soil organisms. Organic matter is important for revolving nutrient, improving soil structure and minimize erosion. Table 2 shows that the mean value of organic matter increased from 1.55% (control) to 1.66% (site), these values of organic matter generally characterize this soil as a mineral soil (0.0 < OM > 30). The higher OM value recorded for the soil sample within the vicinity of the asphalt plant suggests that the rate of OM addition is more than the rate of decomposition. Higher percentage nitrogen in this soil sample further suggests that the high OM value is as a result of fuel spills and discharges. The higher value of OM recorded in study site may also be due to the higher percentage of clay which could host organism.
4.2. Mineral Composition of Soil Samples
Results of the analyses carried out for the mineral composition of soil samples from region around the asphalt production are shown in Table 3. Cations such as K+, Na+, Mg2+ and Ca2+ value are shown in Table 3. All the micronutrients Ca, Mg, Na and K were higher in the control site than the study site which may be the reason for the higher CEC of 9.95 cmol/Kg recorded in the control site against the 8.94 cmol/Kg for the study site. The individual values for these cations give certain indications of fertility of the soil (micronutrients). Table 3 shows that calcium and magnesium dominates, having only minimal amounts of sodium and potassium. This is characteristics of normal soils, indicating normalcy in the micronutrients content of the soil within the vicinity of the asphalt production plant. Nitrate ion concentrations were higher compared to the control site(0.49 and 0.38) µg/Kg. while, Sulfate ion was lower in sample site compared to control site (0.49 and 0.51) µg/Kg the presence of these ions also contributed to TDS and conductivity measurements.
4.3. Physicochemical Parameters of Water
Figures 1-3 are graphical trends observed by some physicochemical parameters.
pH: values for water samples obtained from the sample site and control site are shown in Table 4 as 5.40 and 7.20 respectively. From the result of this study, lower pH of 5.4 was recorded for water from sample site, while control site
![]()
Table 3. Mineral composition of soil samples.
Subscripts 1 and 2 indicate Analytical and Control samples respectively.
![]()
Table 4. Physicochemical parameters of the water samples.
Subscripts 1 and 2 indicate Analytical and Control samples respectively.
![]()
Figure 1. Particle Size of the Soil Samples (Analytical sample; S1 and Control sample; S2).
![]()
Figure 2. Micronutrients in soil (Analytical sample; S1 and Control sample; S2).
![]()
Figure 3. Biochemical parameters of Analytical sample; S1 and Control sample; S2.
observed to be slightly basic with the value of 7.20. These imply that water from sample site is more acidic [15] . Results of the analyses carried out for the physiochemical parameters of water samples from region around the asphalt production are shown in Table 4.
Turbidity: The results of analysis are shown in Table 4 with water from control site observed to be more turbid compared to water from sample site with values recorded to be 20.00 and 13.60 NTU. The result show that turbidity values were above the recommended value of 5 NTU [16] .
Electrical conductivity: Table 4 showed that the electrical conductivity for both water samples exceeded the permissible limits of 250 uS/cm [16] . The value of sample site and control site implied that the low values of conductivity found in both the sample and control site was attributed to the ion species dissolved from the drainage sand.
Total dissolve solid: Table 4 shows the TDS result of the water from sample site and control site to be 591.00 and 816.00 mg/L respectively, which are within WHO limits of 1000 mg/L that is desirable for drinking. Water with high dissolved solids is generally of inferior palatability and may induce an unfavorable physiological reaction.
Total suspended solid: Results of total suspended solid is presented in Table 4. From the results, 281.00 and 68.00 mg/L was respectively reported for the asphalt site sample and the control sample. By implication, highconcentrations ofsuspended solidscan lowerwaterquality by absorbing light. High concentrations of TDS may also reduce water clarity, contribute to a decrease in photosynthesis, combine with toxic compounds and heavy metals, and lead to an increase in water temperature.
Total hardness: Results of total hardness are presented in Table 4 with 300.0 and 320.00 mg/L for sample site and control site respectively. The expected concentration of calcium ions (Ca2+) in freshwater is found in a range of 4 to 100 mg/L (10 - 250 mg/L of calcium hardness as CaCO3). Seawater contains calcium levels of 400 mg/L Ca2+ (1000 mg/L of calcium hardness as CaCO3). High levels are not considered a health concern; however, levels above 50 mg/L can be problematic due to formation of excess.
Calcium carbonate deposits in plumbing or in decreased cleansing action of soaps.
Textural classification of Soil: Figure 1 represents the particle size distribution of soil samples from region around Abinsi asphalt production plant.. From the study, percentage sand > clay > silt.
4.4. Chemical and Biochemical Parameter
Results of the analysis carried out for the chemical and biochemical parameters of water samples from region around the asphalt production were presented in Table 5.
4.5. Chemical Composition and Biochemical Parameter
Figure 2 represents some micronutrients (K, Na, Mg and Ca) in soil for analytical (S1) and control (S2) sample. Other chemical species estimated in this study are as follows.
Chloride ion: The results obtained are presented in Table 5. The chloride ion concentrations from sample and control site are 1871.20 and 2481.99 mg/L respectively. The results indicate that both sample and control site concentrations is above the acceptable limits which is 250 mg/L. Chloride ion were above the analytical detection limits. Similar trend were reported by Elbert et al. [17] . High chloride is not thought to cause health problems but high sodium levels that usually accompany it may cause health effects. The present of chloride ions in
![]()
Table 5. Chemical and biochemical parameters of the water samples.
Subscripts 1 and 2 indicate Analytical and Control samples respectively.
the water bodies is an indication that chloride is higher in the asphalt production plant site.
Nitrate ion: The results for nitrate ion in Table 5 varied slightly between the sample and control site (12.60 and 18.20) mg/L. The difference is responsible for variable dilution of the ion in solution. Nitrate (NO3) is highly soluble (dissolves easily) in water and is stable over a wide range of environmental conditions. It is easily transported in streams and groundwater. Nitrates feed plankton, aquatic plants, and algae, which are then eaten by fish. Nitrite (NO2) is relatively short-lived in water because it is quickly converted to nitrate by bacteria. Excessive concentrations of nitrate and/or nitrite can be harmful to humans and wildlife.
Sulphate ion: The result obtained indicates that sulphate ion in both sample and control sites (10.20 and 16.40 mg/L respectively) are within the analytical detection limits of 250 mg/L. Sulfate is a substance that occurs naturally in drinking water at various concentrations. Health concerns regarding high sulfate concentrations in drinking water have been raised because of reports that link it with an increased occurrence of diarrhea similar trend were reported by Wesset al. [18] .
Ammonia: The obtained results are presented in Table 5. The results from sample and control site (8.20 and 12.40 mg/L) implies that ammonia is present at a level, which is above the acceptable permissible limits. Ammonia concentration in drinking water is set as 0.3 mg/L [19] . The compositions of some mineral
Figure 3 is typical of the biochemical parameters estimated in this study. Observed trends are discussed as follows.
Dissolve oxygen: Dissolved oxygen of W1 was recorded to be 9.40 mg/L, lower than 13.40 mg/L in W2. Both water recorded values of dissolve oxygen higher than BOD values which were 6.40 mg/L and 11.00 mg/L respectively. This suggests that the two water sources did not contain too much loads of organic matter. As the temperature of water increases, a portion of oxygen converts from the liquid state to a gaseous state, as a result, cold water can potentially contain more dissolved oxygen than warm water [20] .
Chemical oxygen demand: The COD results of the sample and control site are above 5.0 ppm. Organisms that are more tolerant of lower dissolved oxygen levels may replace a diversity of natural water systems that contain bacteria, which need oxygen (aerobic) to survive.. This measure of the total quantity of oxygen required to oxidize all organic material into carbon dioxide and water. COD values are always greater than BOD values, but COD measurements can be made in a few hours.
Biochemical oxygen dissolved: Table 5 shows the results of BOD analysis of asphalt production site. BOD5 of sample site was recorded to be 6.40 mg/L compared to 11.00 mg/L in control site. Both recorded values are higher than the acceptable 5.0 ppm. BOD measurements take five days, hence presented as BOD5.
Heavy Metals Concentration: Mean concentration results of the analysis carried out for the heavy metals in soil, water and vegetable (plant) samples from region around the asphalt production are shown in Table 6.
4.6. Heavy Metal Level of Soils, Water and Vegetable Plant
The results of the analysis for selected heavy metals are presented in Table 6.
Zinc (Zn): The mean concentrations of heavy metals in soil sample and control, water sample and control, and vegetable plant sample and control show that zinc (Zn) in the soil and water sample (13.84 mg/Kg and 12.95 mg/L) respectively were lower than their respective controls (19.43 mg/Kg and 17.06 mg/L). For vegetables, the study site recorded a smaller value compared to the control site. These values were observed to be higher than those recorded elsewhere [21] , with a maximum value Zn as 0.7 mg/L for Susiani River, Kenya. These were no significant difference in mean Zn concentration in water, soil and vegetable between the study and control site samples. The contamination factor (Cf) of Zn showed that the soil and water were not contaminated by Zinc. The geo-accumlation of Zn in water and soil showed moderate contamination. Phytotoxicity by Zn may cause decreased crop yield and quality and likelihood of zinc transfer into the food chain.
Manganese (Mn): Mean concentrations of Mn in the samples ranged from 0.125 to 21.837 mg/Kg. Table 6 shows a steady state situation for the soil whereby sample and the control have equal mean value (3.728 mg/Kg) of manganese. The mean concentration of Mn in the water sample (0.125 mg/Kg) was lower than that of the control (0.289 mg/Kg) while the reverse was the case with the plant sample whose Mn mean concentration was highest (21.837 mg/Kg against 3.32 mg/Kg of the control). All these values are lower than the maximum permissible limit of 770 - 850 mg/Kg set as standards. The geo-accumulation of Mn in the soils showed that the soils were strongly contaminated since both soils exceeded the standard limit of 0.4 mg/Kg.
Cadmium (Cd): A similar trend reported for Zn was observed for Cd wherein the mean concentrations in the samples ranged from 0.012 to 0.028 mg/Kg with
![]()
Table 6. Mean concentrations (mg/Kg) of heavy metals in soil (S), water (W) and vegetable (V) from region around abinsi asphalt production plant.
Subscripts 1 and 2 indicate Analytical and Control samples respectively.
the plant sample having highest mean concentration (0.028 mg/Kg) of Cd. These mean concentration values are lower than the permissible maximum limit of 36.5 mg/Kg set by WHO and USEPA. The source of Cd could be anthropogenic [12] .
Lead (Pb): The lead content of the soil S1 was 0.011 mg/Kg and S2 was 0.050 mg/Kg, whereas the concentration of Pb in the vegetable (V2) was 0.225 mg/Kg. However, the Pb content of the vegetables from the control site was found to be higher. The Pb contents of the plants in this study are higher than the FAO/ WHO safe limit of 0.01 mg/kg. The higher Pb level in these vegetables could be attributed to loading of debris containing this element into the stream from the asphalt production plant, since water from this stream is used to irrigate the plants. Thus, the Pb level in these vegetables seems not to be alarming except in a case of excessive consumption.
Cobalt (Co) Nickel (Ni) and Chromium (Cr) were below detectable limits in all the samples as shown in Table 6.
5. Comparative Studies
Statistical significance for analytical and control samples from region around the asphalt production plant at P < 0.05 are presented. Results showed that there was no significant difference for Zn, Pb, Cd in soil and water for the study sites and control sites. However, there was significant difference for Zn in vegetable plants in study and control site. Other parameters such as soil pH, (%) sand, (%) clay, OC, OM, EA, CEC, K, Na, Mg, and Ca in both soils did not differ significantly except for conductivity, Nitrate and Nitrogen.
5.1. Impact Prediction and Assessment
Table 7: Shows the results for the Contamination Factor (Cf) and Geoaccumulation Index (Igeo) for water samples in predicting possible impacts.
Contamination Factors (Cf): In this study, Cf was calculated from the mean concentrations of the heavy metals in the study areas with an assumption that the control sampling sites represents the background values (Table 7). According to Akoto et al. [22] , Cf values between 0.5 and 1.5 indicate that the metal is entirely from crust materials or natural processes; whereas Cf values greater than
![]()
Table 7. Contamination factor (Cf) and geo-accumulation index (Igeo) for water.
1.5 suggest that the sources are more likely to be anthropogenic. The Cf revealed that water show contamination factor for Cd > Zn which ranged from strongly contamination to moderate contamination, while results for soil showed that Cd, > Mn > Zn all on strongly contamination scale. Zinc had a moderately contamination factor. High Cf scale (>1.5) indicates significant contribution from anthropogenic origins.
Geo-accumulation Index (Igeo): The geo-accumulation index (I-geo) for the soils are also presented in Table 7. The pollution status of the metals in the environment expressed in terms of this index showed that the soil contained some level of Mn, Cd and Zn, while water contains Cd, Zn and Mn for Pb, Co, Ni and Cr. However, the samples or environment for now remains unpolluted by these selected metals in the asphalt production plant site.
5.2. Environmental Impact Summary
In order to have a comparative idea about the levels of contamination, data from this work was compared with those from the control sampling point taken to be the unpolluted or background value.Generally, there are low levels of variation in the investigated soils, water and vegetable with small standard deviations. Wells containing drinking water located close to the asphalt production plant in Abinsi, Guma Local Government Area of Benue State are contaminated by both organic and inorganic pollutants but yet unpolluted except for cadmium whose concentration exceeded the threshold concentration. The source of this substance may be from fertilizers, fungicides etc. The organs of the body that this metal could affects are kidney and liver. Other parts of the body that could be affected include brain and bones. Similarly, plants from Abinsi region should be placed under proper screening for cadmium as they find way to the food chain.
6. Conclusion
Results from the post project monitoring of Abandoned Asphalt Production Sites in Abinsi vicinity soil showed four dominating metals (Cd > Mn >Zn > Pb) among others that were considered. Pb was only detected in soil and vegetable plant from the control site. Vegetable plant from study site recorded the highest values in all the heavy metals detected. Geoaccumulation index of all the heavy metals determined showed S1 and S2 were strongly contaminated with Mn, Cd but moderately contaminated with Zn. W1 and W2 were only strongly contaminated with Cd.