Delineation of Shallow Stratigraphy and Aquifer Formation at Kahe Basin, Tanzania: Implication for Potential Aquiferous Formation ()
1. Introduction
Groundwater is an important and limited resource in many parts of Tanzania and the world at large, and is approximately 50 to 70 times more plentiful than surface water [1] . It is the principal source for drinking water as it is free from the impact of numerous anthropogenic activities. Groundwater is one of the valuable natural resources whose exploitation requires knowledge and proper management for sustainable development. The climate change and population growth in both rural and urban areas in Tanzania make sources of water no longer adequate. Therefore, understanding the occurrence of aquifers and delineating shallow stratigraphy is essential for the management of water resources in particular the rural areas. In rural area, most of the people depend on surface water and shallow dug wells or ponds, which are sometimes very far from residential areas. Surface water mostly is not enough and in some cases, it may not be suitable for human consumption and may as well not be adequate for economic activities such as irrigation.
The lack of required data in various parts of Tanzania has hindered thorough study of the hydrogeology leading to lack of ground water resources quantification and owing to that existing borehole data have been the only information available in many areas [2] . For domestic use, the focus has only been on shallow wells in various parts of the rural areas. Groundwater occurrences in Tanzania are not well known due to limited substantial investigations on groundwater location. The possible way to develop groundwater location is by using geophysical methods to provide valuable information about its distribution, thickness and depth of groundwater bearing formation.
Due to limited extensive studies on groundwater occurrences in Tanzania, the government has established nine basins based on the water utilization (control and regulation) Act No. 42 of 1974 and its subsequent amendments. The roles of the established basins are to undertake water resource monitoring and assessment, water allocation, water control and management. The Pangani basin is one of the big established basins, which comprises Kilimanjaro, Arusha and Tanga regions and 5% of its area being located in Kenya [3] . This study therefore focuses on the Kilimanjaro region particularly Kahe-Mtakuja basin for assessing the potential of the basin as a source of groundwater, by studying the stratigraphy and delineating the aquifer formation using resistivity data from Pangani Basin Water Office collected in August to September 2008.
2. Geological and Hydrological Background
2.1. Geological and Hydrological Setting
The Kahe basin area is formed as a large-scale structural basin. The basin is filled by Quaternary superficial deposits including alluvium deposits chiefly composed of sand, gravel and clay, along with calcareous deposits with some lava and pyroclastic volcanic rocks. The pyroclastic are inserted between new alluvial deposits, which consist of gravel, sand, silt and clay [4] . The clay is predominant in most part of the plain and the gravel bed is formed as a fan deposit in some areas. The thickness of the alluvial deposits on the plains of the southern slopes of Kahe-Mtakuja is estimated to be roughly more than 130 m [5] . The depth of the basement below the alluvial zone is not accurately known.
To the northwest of the basin, a N-S trending fault is observed that marks a boundary between alluvial and Neogene volcanic rocks. Also there is NW-SE fault trending to the west that slightly changes to NNW-SSE striking direction a few meters before entering the basin. At the eastern side there is spread of boulder bed and conglomerates as well as brown tuffuraceous and agglomerate deposits. Most of the areas surrounding the basin are largely covered by red soil derived from volcanic rocks and locally calcareous. At the northern and northwestern parts are Neogene volcanic rocks and volcanic sediment, which include rhomb porphyry and lahar (Figure 1).
The Kahe-Mtakuja basin is filled by alluvium deposits, which seem to become thicker toward northeast. There are two major types of geological materials, which constitute the alluvial deposits in the basin. The first type consists of basalt flows and pyroclastic products from Kilimanjaro volcanic [5] . The second type encompasses erosion products (landslide blocks) and alluvial sediments (boulders, pebbles, gravel, sand, silt and clay) transported by rivers. The basin filled materials therefore exhibits a large heterogeneity in both their origin and nature and in their grain size forming unconsolidated and porous materials for groundwater occurrences. The aquifer formation of the basin has been suggested as unconfined aquifer [6] . The base of the structural basin is covered by Precambrian gneiss, which is distributed at the depths exceeding 200 m in the northern area of the basin and becomes shallow at the Nyumba ya Mungu along the Pangani river, where the outcrops of the Precambrian rocks are observed. The basement rocks are impermeable [5] .
In understanding the recharge of the basin, water balance calculations were obtained after simulation using the ZONEBUDGET programmed. The computation shows that a total recharge of 170 × 106 m3/day enter the Kahe basin from the mountains at an average infiltration rate of 515 mm/year [7] [8] . This indicates that the Kahe basin is recharged through inflow from the mountain and adjacent aquifer, direct rainfall and snow melting.
2.2. Groundwater Occurrence
Groundwater is mainly controlled by the geology of the area. Porosity and geological structures such as fractures, faults, and shear zones control groundwater occurrence and distribution [1] [9] [10] . Porosity and permeability of the rocks are important parameters for groundwater location and flow in the ground. The porosity of earth materials is the percentage of the rock or soil that is void of material while the permeability refers to the size of openings, the degree of interconnection, and the amount of open space within the rocks. In sedimentary
![]()
Figure 1. Geological map of Kahe-Mtakuja basin. (Modified from geological maps QDS 56 and 72.) The bold rectangular outline indicates the study area enlarged as Figure 2.
basins such as Kahe-Mtakuja basin, groundwater is mainly controlled by porosity and permeability of the rock.
Porosity in sedimentary rocks can be either primary or secondary porosity. Primary porosity is the porosity formed during deposition of sediments while secondary porosity is the porosity that formed after the deposition of sediments mainly due to digenesis, cementation or deformation such as fracturing and faulting of the rocks. Clay tends to have high porosity but poor permeability hence poor groundwater reservoir. Sand, gravel and boulders tend to have high porosity and permeability forming good groundwater reservoirs. Materials, which are well sorted and free from silt and clay, are good for aquifer formation [1] .
2.3. Borehole Lithological Logs
The stratigraphy of an area can be known using data from borehole lithological
![]()
Figure 2. A map showing the location of the VES stations at Kahe-Mtakuja basin. This map is enlarged from Figure 1. Diamonds symbols indicate VES stations.
logs. In Kahe basin many boreholes have been drilled and six of the boreholes were drilled for groundwater exploration, with maximum depth of penetration < 110 m as shown in Figure 3. These include two at TPC farms and others at Samanga, Mawala, Kahe and Mikocheni.
The stratigraphic sequence of one of the boreholes at TPC farms with their depth range in brackets intersects unconsolidated clay and silt (0 to 20 m), then boulders, pebbles and cobbles (20 to 30 m), clay (30 to 33 m), basalt (33 to 70 m) and clay (70 to 80 m) as shown by borehole R3 (Figure 3). The other borehole (R6) at TPC farms shows stratigraphic sequence that consists of clay (0 to 15 m), gravel (15 to 20 m), boulders, pebbles and cobbles (20 to 25 m), basalt (25 to 35 m), clay (35 to 40 m), basalt (40 to 70 m), clay (70 to 75 m), pyroclastic (75 to 80 m) and clay (80 to 90 m) (Figure 3).
The borehole at Kahe village intersected silt from 0 to 2 m depth followed by clay, gravel and sand that are alternating with different thickness from 2 to 68 m depth. The borehole at Mikocheni intersected clay from 0 to 6 m depth, and then boulders, pebbles and cobbles from 6 to 14 m depth, followed by clay and sand from 14 to 44 m and 44 to 60 m depths respectively. The borehole drilled at Samanga intersected silty loam from 0 to 6 m depth followed by sand from 6 to 62 m depth. Lastly the borehole at Mawala intersected clay and sand from 0 to 38 m and 38 to 94 m depths respectively.
Generally, lithological logs from most of the boreholes drilled in the basin in-
![]()
Figure 3. The borehole lithological logs at TPC farm (R3 and R6), Samanga (KL/543), Mikocheni (KL/726), Mawala (KL/728) and Kahe Farm (KL/Kahe).
dicate alternation of clay, silt, fine sand to courser sand, boulders, pebbles to cobbles, pyroclastic and basalt. These materials were deposited in the basin from volcanic weathering and lava flow from Mount Kilimanjaro, and their ages are of Neogene to Quaternary [11] .
3. Data and Methodology
Data
Equipment
This study uses data from Pangani Basin Water Office, which was collected in August-September 2008 using the ABEM SAS 300C Terrameter. The instrument measures and displays the resistance of the subsurface materials. Other instruments used include; metal electrodes, measuring tape, labelled tag (used in locating station position), hammer (used in driving the electrodes into the ground), compass, and connecting cables. The ABEM Terrameter is capable of controlling external transmitter with the output of 1 - 1000 mA, maximum output voltage of 400 V or an external 12 V D.C source and output power up to 100 W. The instrument was easily operated using four electrodes. The first two electrodes are for transmitting currents and the other two electrodes are for measuring the resistance of the ground.
Choice for the Sounding Station
The quality of Vertical Electrical Sounding (VES) data is highly controlled by the nature of sounding station. The VES data were carried out in the location identified by magnetic profile, which were the points with low magnetic anomaly among the linear magnetic value. The linear magnetic profiles were designed to strike the groundwater flow in order to detect the linear features that tend to control groundwater flow. This was designed by considering the topography that result in an uneven and linear distribution of VES station as shown in Figure 2.
Data Acquisition
1) Resistivity Measurements
In this study Electrical Resistivity Method has been employed in data acquisition. The method has been widely adopted in groundwater exploration [12] [13] [14] . This is due to the fact that the field operation is easy, the equipment is portable, less filled pressure is required, it has greater depth of penetration, and it is accessible to modern communication systems (i.e., computer). A total of fifty- eight (58) Vertical Electrical Sounding (VES) data was acquired within the study area on the established different traverses as shown in Figure 2.
The resistivity measurements were collected using Schlumberger configuration with a maximum current electrode spacing ranging from 150 to 250 m. Schlumberger configuration is based on four electrode array where the four electrodes A, B, M and N were arranged in AMNB sequence. The electrical current I, is applied to the outer A and B electrodes and potential difference ∆V is measured between the inner M and N electrodes [15] [16] .
The measurements were done by keeping the distance between potential electrodes small and increasing progressively the current electrodes separation until the potential difference becomes too low/weak to be measured. Then, in order to increase the values/strength of the potential difference, the MN distance was increased and thereafter the distance AB was again increased progressively until the maximum current electrodes separation is 150 - 250 m.
2) Sources of Errors
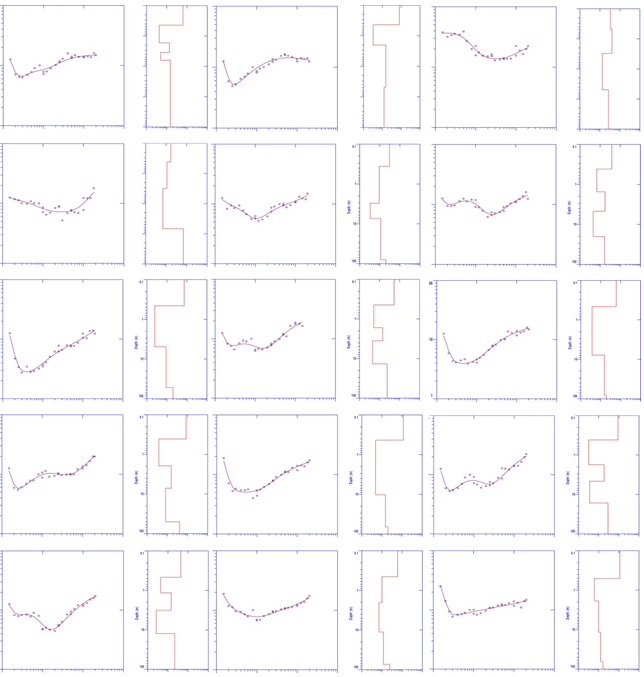
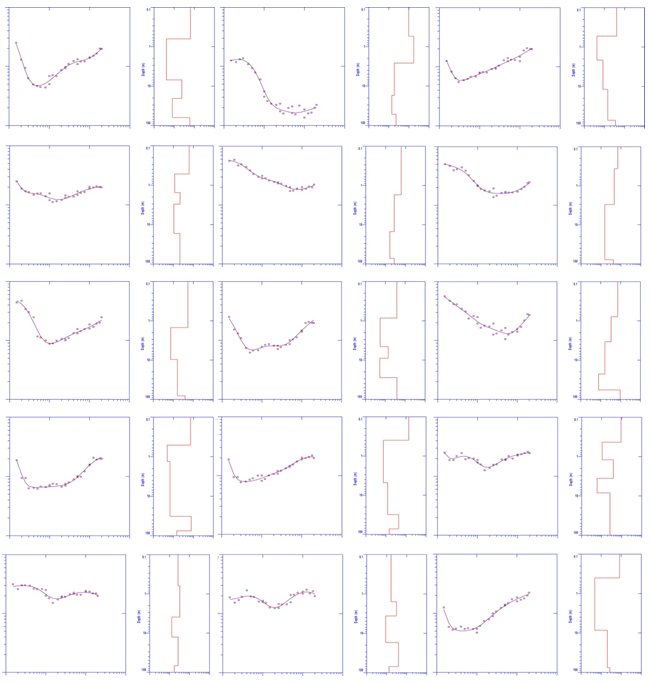
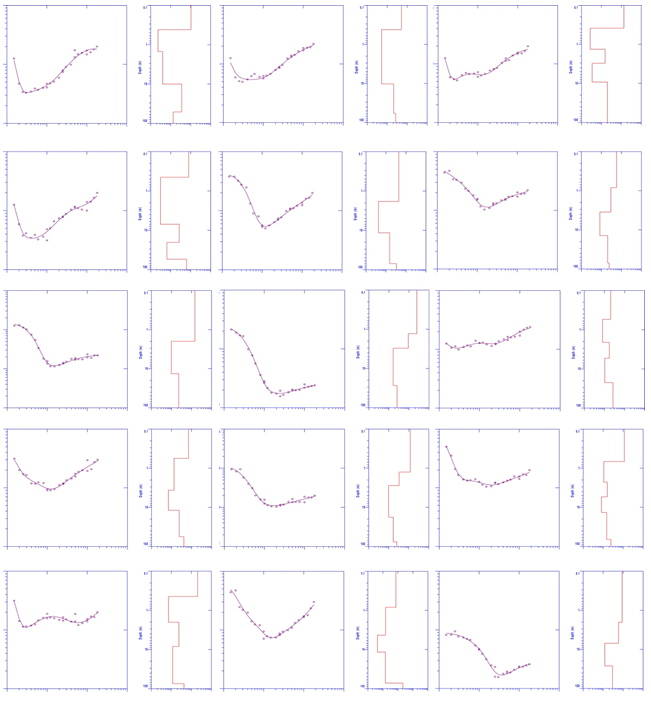
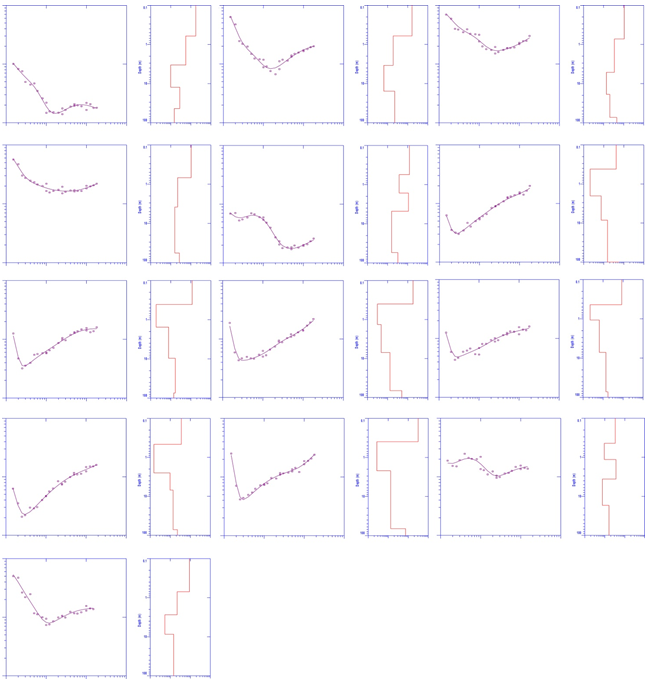
The resistivity measurements were conducted during the dry season, the signal to noise ratio was low due to leakage of current that caused by poor electrodes contact with the ground. Leakage of primary current into the MN-circuit caused cusps on sounding curves and in some cases led to general distortion of the sounding curve as shown by most of sounding curves presented in Supplementary Figure S1. The vegetation cover and land uses also affected the surface soil moisture and hence topsoil resistivity variation of the area. In order to obtain field data of high quality, electrodes were hammered so that to increase the depth of penetration of current electrodes and contact with ground.
4. Results and Interpretation
4.1. Results of Vertical Electrical Sounding (VES)
From resistivity measurements, the apparent resistivity values were calculated by multiplying the resistance with corresponding geometrical factor. Then the apparent resistivity, ρa, values were plotted against the electrode spacing (1/2 AB) on a log-log scale to obtain the VES sounding curves using an appropriate computer software ix1Dv3CD.
4.1.1. Lateral Variation of Apparent Resistivity at Kahe
The lateral variations of apparent resistivity in the study area show that there is decrease in resistivity from 30 Ωm to 10 Ωm. The top most layer has slightly high resistivity as compare to the layer beneath it. The apparent resistivity values slightly rise from 10 to 60 Ωm as the depth of penetration increases.
4.1.2. Resistivity Contour Maps at Different Depth Levels
The resistivity contour maps at depths of 5, 50 and 150 m were prepared to show lateral variations of apparent resistivity (Figures 4(a)-(c)). A resistivity contour map at a depth of 5 m shows that the resistivity values range from 0 to 90 Ωm. Generally a large part has resistivity values between 0 to 30 Ωm as shown on Figure 4(a) and in some areas the resistivity values increase from 30 to 60 Ωm. The map also shows negative resistivity values, which are attributed to uneven distribution of VES data on the study area, hence representing the missing data.
At a depth of 50 m below the earth’s surface, the resistivity ranges from 0 to 40 Ωm, and a large part on the map is dominated with resistivity values between 10 to 30 Ωm (Figure 4(b)). These small lateral variations in apparent resistivity at a
![]()
Figure 4. Resistivity map showing lateral variation of resistivity at (a)
(b)
and (c)
depth of 50 m, indicate that the layer is likely to be homogeneous. A resistivity contour map at depth of 150 m below the earth’s surface shows that the resistivity values range from 0 to 25 Ωm and a large area is being dominated by resistivity between 5 to 25 Ωm (Figure 4(c)). However the resistivity variation is too small which could suggest that the layer is homogeneous in term of lithological characteristics. Generally the resistivity contour maps show that the area has low resistivity values between 10 to 60 Ωm from the upper surface to hundred meters. This indicates that possibly the area is highly saturated with groundwater.
4.2. Nature of the Sounding Curves
The Vertical Electrical Sounding (VES) curves for this study are presented in Figure 5(a) and Figure 5(b). The Schlumberger sounding curves obtained from resistivity measurements show displacement of the data values at each change in the potential electrode segment (MN-segment) at MN = 2.5, 5, 10 and 25 m and
, 50 and 100 m, respectively. The displacement is due to increase in current electrodes spacing
which decreases the current signal as the
depth of penetration increases. The degree of displacement caused by the lateral effects differs from one MN-segment to the other and from one VES station to another depending on the heterogeneity of the formation. The sounding curves of most VES are smooth to slightly smooth (Figure 5(a) and Figure 5(b)), but a few of the VES are not smooth (Supplementary Figure S1). The smooth sounding curves are due to errors introduced during the resistivity measurements and also variations in the lithology of the area.
4.3. Interpretation
4.3.1. Vertical Electrical Sounding Interpretation
The resistivity value at the depth of <4 m is higher in most of the sounding curves presented. This is due to the fluctuation in soil moisture within the study area that indicates the uppermost ground is dry giving rise in resistivity values. However, this effect varies differently depending on the rock type. The effect is high on clay sediments due to the nature of clay, which tend to absorb moisture and retain, the situation, which is different when comparing to sand and silt.
However, at the northern part on the location of VES 40 to VES 50 of the study area, the upper ground has higher resistivity values due to presence of gravel and sand while at the southern part on location of VES 1 to VES 29, the resistivity values are low due to the presence of silt and clay as intersected by borehole lithological logs. The resistivity values at a depth of 4 m to 25 m range from 5 to 15 Ωm; at the depth range of 25 to 100 m the resistivity values slightly rise from 15 to 30 Ωm for most of the VES (Table 1). The apparent resistivity values for most of the VES are in the range of 5 to 50 Ωm, which indicate that the lithology of the area is more conductive to electric current. The implications to this finding suggest that the area is potential for groundwater occurrences.
4.3.2. Resistivity Cross Section
The geological sections were drawn to show the variation of apparent resistivity
![]()
Figure 5. Typical vertical electrical sounding curve types from the study area (a) Station 36 (VES 36); (b) Station 38 (VES 38).
![]()
Table 1. Interpreted layer parameters of the geophysical sounding curves of Kahe-Mtakuja. Included in the table are number of layers, apparent resistivity (ρa1 - ρa6) and depths.
with depth as a function of rock type change and structural features (Figures 6(a)-(f)). The sections are drawn for one profiling to another profiling; while others are combined due to one profile differ from another by a few meter distances. Six sections are drawn: first section involves VES 1 to VES 8, second section concerns VES 9 to VES 19, third section displays lithology for VES 18 to VES 29,
![]()
![]()
Figure 6. Cross sections showing lithological unit for (a) VES 1 to 8; (b) VES 9 to 17; (c) VES 18 - 29; (d) VES 30 to 39 and 45; (e) VES 40 to 44 and 44 to 50; (f) VES 51 to 58. Numbers beside the column indicate apparent resistivity values.
fourth section shows lithology for VES 30 to VES 39 and VES 45, fifth section indicates lithology for VES 40 to VES 44 and VES 46 to VES 50 and the last section is for VES 51 to VES 58.
5. Discussion
The Kahe-Mtakuja basin has generally low resistivity values in the range of 2 to 100 Ωm. From interpretation of Vertical Electrical Sounding (VES) data shows that the area has three to five layers with different thickness and apparent resistivity values. Also from lithological logs of the borehole indicate that the area has two to five layers composed alluvial deposits alternating with different thickness of one lithology to another. It seems that these layers are unconsolidated and more porous for groundwater occurrences.
The first layer is very thin with relatively high apparent resistivity value (>30 to 100 Ωm) mostly dominated by top red soil and fine sands with thickness of <2 m, similar to an interpretation reported in South of Zahedan City, Iran [17] . However, this layer shows variation in thickness and apparent resistivity from one VES station to another. The second layer has apparent resistivity values between 2 and 10 Ωm with thickness ranging from 2 to 25 m likely suggesting the layer is porous and saturated with water. This layer is composed of clay and extends to <25 m depth. Some of the VES curves indicate that this layer is alternating with sand as interpreted in VES 1, 8, 12, 23, 27, 33 and 57. A study by [17] obtained similar depth range and resistivity values and interpreted as a saturated layer. The third layer is very thick extending from the depth of 30 to >70 m with apparent resistivity values between 10 and 60 Ωm, which could be interpreted as mainly composed of sand. However, in some cases this layer is split into two layers depending on apparent resistivity values. The apparent resistivity of sand is ranging from 10’s to 100’s Ωm, due to variation in porosity and permeability as they are controlled by the degree of compaction and fracturing [1] . In this layer groundwater is mainly occurring and most of the boreholes were drilled to <90 m depth. However, beneath this layer there is an increase in apparent resistivity > 100 Ωm to a depth > 80 m, indicating that there is a decrease in porosity due to increase in compressibility of the materials.
The groundwater occurrence in some areas is found at very shallow depth due to very low apparent resistivity of <10 Ωm shown by existence of shallow well on the area. The formation is porous from 2 to 20 m depth as in some areas is characterized by alternation of clay and sand. From 25 to 80 m depth the apparent resistivity is low (10 to 60 Ωm) and the layer is composed of sand, where groundwater formation is found. Hence aquifer formation of Kahe-Mtakuja basin is unconfined mainly found in sand formation.
6. Conclusions
The electrical resistivity method has been used in the identification of shallow stratigraphy of Kahe-Mtakuja basin by estimating the thickness and apparent resistivity of the contrasting layers. The VES curves indicate that the basin is generally characterized by relatively low apparent resistivity values in the range of 0 to 100 Ωm suggesting the presence of clay, silt to sand layers. The interpretation of resistivity data using computer software (ix1Dv3CD), revealed three main geo-electric layers. The first layer has resistivity values ranging from 40 to 230 Ωm with thickness ranging from 0.4 to 2 m. This layer is mainly composed of top red soil. The second layer has resistivity values in the range of 2 to 10 Ωm and thickness 2 to 25 m, composed of mainly clay and in some area with alternating sand. The third layer has slightly high resistivity values ranging from 10 to 60 Ωm and thickness in the range of 30 to 70 m. This layer is mainly dominated with sand.
Results from resistivity cross-sections indicate that the Kahe-Mtakuja basin has shallow stratigraphy. The stratigraphy of the basin from the surface to a few meters depth is characterized by clay. Beneath the clay, there is sand formation that holds the groundwater and this layer is very thick ranging from 30 to 70 m depths. These layers differ from one VES to another, due to topography variation from one place to another as VES were carried out.
The integration of results from this study and previous studies indicates that the hydrogeology of Kahe-Mtakuja basin is found in alluvial sedimentary deposit; hence the basin is potential source for groundwater occurrence. Boreholes drilled for domestic supplies and for irrigation purposes at Kahe-Mtakuja basin show high yield of >300 m3/h [3] . The groundwater flow is controlled by linear features such as fractures, fissures and faults below the surface, thereafter, the Kahe-Mtakuja basin as a structural basin is potential for groundwater occurrences and distribution.
The broad implication of this study lies to the groundwater scientific community as it advances the understanding on the subsurface deposition of the shallow aquifer systems. The potentiality of this area for groundwater occurrence is vital for providing additional baseline data on the aquifer characteristics and will assist in reducing water scarce in the area. The findings also constitute background information or useful guide to the Government agency or organization(s) dealing with groundwater drilling and development programmes in the area.
Acknowledgements
The Government of Tanzania under the practical training of students has funded this study. We extend sincere appreciation to PANGANI Basin and the University of Dar Es Salaam for assisting in the logistics and fieldwork. Figures were produced using Arc-GIS and Surfer® Golden software package (Golden Software, LLC). We also thank two anonymous reviewers for helpful comments.
Supplementary Figure S1: Vertical Electrical Sounding Curves of Kahe-Mtakuja