Accuracy Assessment of Land Use/Land Cover Classification Using Remote Sensing and GIS ()
1. Introduction
Land use and land cover information is required for policy making, business and administrative purposes. With their spatial details, the data are likewise crucial for environmental protection and spatial planning. Landuse classification is vital because it gives data which can be used as input for modeling, especially the one dealing with environment, for instance models deals with climate change and policies developments [1] . Hence the combined LULC grant a comprehensive means of understanding the interaction of geo-biophysical, socioeconomic systems behaviors and interactions [2] . To provide more useful information in land cover, Remote Sensing is often paired with Geographic Information System (GIS) technique.
Remote sensing is the main source for several kinds of thematic data critical to GIS analyses, including data on landuse and landcover characteristics. Aerial and Landsat satellite images are also frequently used to evaluate land cover distribution and to update existing geospatial features. With the introduction of remote sensing systems and image processing software, the importance of remote sensing in Geospatial Information System (GIS) has expanded significantly [3] . The accelerated usage of remote sensing data and techniques has made geospatial process faster and powerful, although the increased complexity also creates increased possibilities for error [4] . Previously, accuracy assessment was not a priority in image classification studies. However, because of the accelerated chances for error presented by digital imagery, accuracy assessment has become a very vital process [5] .
Accuracy assessment or validation is a significant step in the processing of remote sensing data. It establishes the information value of the resulting data to a user. Productive utilization of geodata is only possible if the quality of the data is known. The overall accuracy of the classified image compares how each of the pixels is classified versus the definite land cover conditions obtained from their corresponding ground truth data. Producer’s accuracy measures errors of omission, which is a measure of how well real-world land cover types can be classified. User’s accuracy measures errors of commission, which represents the likelihood of a classified pixel matching the land cover type of its corresponding real-world location [5] [6] [7] . The error matrix and kappa coefficient have become a standard means of assessment of image classification accuracy. Moreover, Error matrix have been used in numerous land classification studies and were a crucial component of this research.
The objective of this research was to classify and map land-use/land-cover of the study area using remote sensing and Geospatial Information System (GIS) techniques and to carry out accuracy assessment in order to find out how well the classification procedures was undertaken and also to understand how to interpret the usefulness of the classification.
Study Area
The study area map was prepared from Limpopo province map. The area falls under latitude 23˚0'31.0956"S, 29˚30'48.5697"E and longitude 24˚2'48.3007"S and 29˚32'16.9088"E. The total study area is 7138 km2. The rainfall (average) ranges from 290.565 mm to 1410.24 mm. The study area is shown in Figure 1.
2. Materials and Methods
This paper covers two sections: 1) Landuse/Landcover (LULC) classification and 2) accuracy assessment. The landuse/cover classification of the study area and accuracy assessment were carried out as per the methodology presented in Figure 2.
Landuse/Landcover Classification
Image Pre-Processing
Classification process and analysis of the different LULC classes were done using two Landsat satellite images covering the Landsat 8 OLI/TIS acquired on 16 September 2015. These images includes; L8 OLI/TIRS (path 170, rows 68) and L8 OLI/TIRS (path 170, rows 77) (Table 1). The Landsat images were downloaded from United States Geological (USGS) Earth Explorer (https://earthexplorer.usgs.gov/). The selection of the Landsat satellite images dates was influenced by the quality of the image especially for those with limited or low cloud cover. Each Landsat was georeferenced to the WGS_84 datum and Universal Transverse Mercator Zone 35 North coordinate system.
An intensive pre-processing such as geo-referencing, mosaic, and layer-
![]()
Figure 2. Schematic of work flow for LULC and accuracy assessment.
![]()
Table 1. Details of Landsat 8 OLI/TIS used for classification.
stacking were carried out in order to Ortho-rectify the satellite images. The image was then processed in ERDAS IMAGINE 2015 software. The satellite image of each band was stacked in ERDAS Hexagon within interpreter main icon utilities with layer stacked function. Then, from the stacked satellite image the study area image was extracted by clipping the study area using ArcGIS 10.3 software.
Landuse/Landcover (LULC) Classification: Supervised
For this study, only supervised classification was performed. Supervised classification according to [8] is where “the user develops the spectral signatures of known categories, such as urban and forest, and then the software assigns each pixel in the image to the cover type to which its signature is most comparable”. “Supervised classification is the process most frequently used for quantitative analyses of remote sensing image data” [9] . The supervised classification was applied after defined area of interest (AOI) which is called training classes. More than one training area was used to represent a particular class. The training sites were selected in agreement with the Landsat Image, Google Earth and Google Map (Figure 3). The basic sequence operation followed on supervised classification was;
・ Defining of Training Sites: The first step in undertaking a supervised classification is to define the areas that will be used as training sites for each land cover class. This is usually done by using the on-screen digitized features. The created features are called Area of Interest (AOI).The selection of the training sites was based on those areas clearly identified in all sources of images. In this study, one hundreds training sites were been identified.
・ Extraction of Signatures: After the training site (AOI) being digitized, the next step was to create statistical characterizations of each information. These are called Signatures editors in ERDAS Imagine 2015. In this step, the goal was to create a signal (SIG) file for every informational class. The SIG files contain a variety of information about the land cover classes described. After the entire signature have been created, then the SIG file saved as dialog (Table 2).
・ Classification of the Image (Supervised classification): The supervised classification has been applied after defined training classes. One or more than one training area was used to represent a particular class. During the supervised classification process, the entire Signature editor was selected in order to be used on the classification process. Then the classify was selected from the
![]()
Figure 3. Identification of training sites using Landsat image (Erdas Imagine 2015), Google earth and Google map.
![]()
Table 2. Signature editor table for classified image.
![]()
Table 3. Landcover classification scheme.
Editor Menu bar, classify/supervised. Non Parametric Rule was used in this classification. The Image was classified into six classes namely; Waterbody, Built up areas, Barren/bare land, shrubs, Mixed forest and Agriculture (Table 3).
Classification Results and Discussion
Supervised classification was carried out at study area. The area of each class was calculated taking into account the pixel count and total area (study area). Thus allocations of each classified area, (percentage) are tabulated in Table 4. The percentage of areas as classified are; Agriculture (65.0%), water body (4.0%), built up areas (18.3%), mixed forest (5.2%), shrubs (7.0%), and Barren/bare land (0.5%) (See Figure 5). Agriculture was found to be the dominant type of Land use classified which covers about 65.0% of the total study area, followed by Built-up areas while the least classified was Barren/bare land which accounts for 0.5%. During the classification, among the water body classified were rivers (sand river and Houtriver).
3. Classification Accuracy Assessment
One of the most important final step at classification process is accuracy assessment. The aim of accuracy assessment is to quantitatively assess how effectively the pixels were sampled into the correct land cover classes. Moreover the key emphasis for accuracy assessment pixel selection was on areas that could be clearly identified on both Landsat high resolution image, Google earth and Google Map. A total of 307 points (locations) were created in the classified image of the study area. The Accuracy Assessment Cell Array Reference column was filled according to the best guess of each reference point. Hydrogeological
![]()
Table 4. Classified area under different Landuse classes in study area.
![]()
Figure 5. Pie chart showing distribution of classified area in percentage.
![]()
Figure 6. Landsat (classified) image of the study area covered with 307 points from random sampling.
![]()
Table 5. Theoretical error matrix of LULC classification.
map series of the republic of South Africa, Topographic map, Google earth and Google Map were used as reference source to classify the selected points.
Table 5 shows the relationship between ground truth data and the corresponding classified data obtained through error matrix report.
The overall classification accuracy = No. of correct points/total number of points .
.
Table 5 shows a theoretical confusion matrix (error matrix) of a LULC classification. The columns of the confusion matrix show to which classes the pixels is in the validation set belong (ground truth) and the rows show to which classes the image pixels have been assigned to in the image. The diagonal show the pixels that are classified correctly. Pixels that are not assigned to the proper class do not occur in the diagonal and give an indication of the confusion between the different land-cover classes in the class assignment.
Furthermore, the off-diagonal elements in the rows of the confusion matrix, divided by the total number of pixels assigned to the landsat image class corresponding to the row, represent the commission errors and describe the confusion between that image class and describes the other land-cover classes. The commission errors describe the chance that a pixel that has been assigned to a particular class actually belongs to one of the other classes.
Moreover, this study considered other metrics derived from the error matrix to further describe accuracy assessments including; commission and omission error, sensitivity and specificity, positive and negative predictive power and Kappa statistics. For thorough information of these concepts, refer to [10] and [11] .
In this research, various statistics related with classification accuracy as well as overall Kappa statistic are computed based on [12] formulation as indicated below:
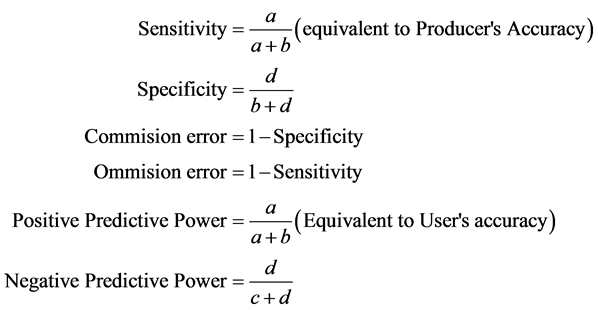
where:
a = number of times a classification agreed with the observed value
b = number of times a point was classified as X when it was observed to not be X.
c = number of times a point was not classified as X when it was observed to be X.
d = number of times a point was not classified as X when it was not observed to be X. Total points = N = (a + b + c + d)
KAPPA analysis is a discrete multivariate technique used in accuracy assessments [13] . KAPPA analysis yields a Khat statistic (an estimate of KAPPA) that is a measure of agreement or accuracy [5] . The Khat statistic is computed as;

where;
r = number of rows and columns in error matrix, N = total number of observations (pixels)
Xii = observation in row i and column i,
Xi+ = marginal total of row i, and X+i = marginal total of column i
A Kappa coefficient equal to 1 means perfect agreement where as a value close to zero means that the agreement is no better than would be expected by chance. As per [14] categorization of Kappa statistic is widely referenced which is reproduced in Table 6.
![]()
Table 6. Rating criteria of Kappa statistics.
![]()
Table 7. Category wise accuracy assessment statistical parameters.
![]()
Table 8. Category wise accuracy assessment statistical parameters.
Results and Discussion on Accuracy Assessments
Using the formulae furnished on section 3.0, various accuracy evaluating parameters were computed and tabulated in Table 7 and Table 8.
The results from accuracy assessment showed an overall accuracy obtained from the random sampling process for the image of 81.7%. User’s accuracy ranged from 57.1% to 97.1% while producer’s accuracy ranged from 26.7% to 93.6%. The broad range of accuracy indicates a severe confusion of Barren/bare land with other land cover classes. Moreover, the measure of producer’s accuracy (Sensitivity) reflects the accuracy of prediction of the particular category. The User’s accuracy reflects the reliability of the classification to the user. User’s accuracy is the more relevant measure of the classification’s actual utility in the field. Agriculture was found to be more reliable with 97.1% of user accuracy.
The commission error reflects the points which are included in the category while they really do not belong to that category. For instance, the commission error is highest in case of built - up areas which meant that more number of points (31) which do not fall under this category are classified as built up areas. Equally, the omission error reflects the number of points which are not included in the category while they really belong to the category. The omission error in case of Barren/bare land is more (0.7333) with 33 points which actually belong to this category not being categorized in this class. In this study an overall Kappa coefficient of 0.722 was obtained which is rated as substantial. Apart from overall classification accuracy, the above individualized parameters give a classifier a more detailed description of model performance of the particular class or category of his field of interest or study.
4. Conclusions
Remote sensing is very important for the production of Land Use / Land Cover maps which can be done through a method called image classification. This method had made huge improvements over the past decades in the following four areas for example; LULC maps production at any scale, improvement and use of advanced classification process such as pre field and sub pixel, classification procedures using knowledge base process and incorporation of auxiliary data into classification procedures; such data includes, digital elevation model (DEM), road, soil, landuse and census data. Moreover classifying landsat imageries in order to obtain accurate and reliable LULC information still remains a challenge that depend on several factors for example the imageries selected, landscape complexity, image processing techniques and classification process itself.
The accelerated usage of remote sensing data and techniques has made geospatial process faster and powerful, although the increased complexity also creates increased possibilities for error. The objective of this paper was to classify and map land use - land cover (LULC) of the study area using Remote Sensing and GIS techniques and also to carry out accuracy assessment in order to assess how well a classification worked.
The supervised classification was performed using Non Parametric Rule. The image was classified into six classes; Agriculture (4638 km2), water body (283 km2), built up areas (1309 km2), mixed forest (372 km2), shrubs (499 km2), and Barren/bare land (37 km2). Agriculture was the dominant type of Landuse classified which covers about 65.0% of the total study.
In addition classified image need to be assessed for accuracy, before the same could be used as input for any applications. Individual accuracy assessment parameters are useful to assess the model performance in respect of a particular category/class of specific interest for the study. In this study, accuracy assessment was performed using error matrix. The study had an overall classification accuracy of 81.7% and kappa coefficient of 0.722. The kappa coefficient is rated as substantial and hence the classified image found to be fit for further research.