Pollution Potential Ranking of Industries Using Classical TODIM Method ()
1. Introduction
In developing country, the development of nation depends on industrial growth. The numbers of industries are increasing, which will help in economical growth of nation. If we look other side, increasing in numbers of industries will also increase the pollution of air, water and soil. We should think about the emission from the different industries. There are a number of pollutants emitted by different types of industries in surrounding environment. It may happen that the emission of pollutants will exceed the norm provided by government. For some typical industry, it may happen that out of total pollution load, only some pollutants emission may exceed norms but others are within the prescribed limits. It may be the case in the industrial sector that primary industry may not emit any harmful pollutants in the environment but compared to those small scale or secondary industries, emission load will be closed to norms but more harmful. If the pollutant load will be more than prescribed limit, it will be always considered in the category of polluting industries. It is very difficult to judge the potentiality of pollutants in terms of different emission load. In proposed method, impact of each pollutant treated separately and later on ranking of industry will be calculated after combining impact of all pollutants together for each industry.
The sections in this paper are arranged as follows. Section 2 describes environment pollution associated with the industries. Section 3 gives brief introduction of the classical TODIM method. In Section 4, two examples are evaluated with the help of the proposed method. Lastly, the conclusion of this paper is presented in Section 5.
2. Environment Pollution
Industrial growth is required for every nation in this 21st century to be with recent technology and also for human comfort. Industrial growth is directly connected with environment pollution. As the growth in industries increasing rapidly the pollution of environment also increase in proportion. Before few decades there were less number of industries and the working hours of industries were also less. In present scenario industries are increasing in number and majority of industries are operated for 10 - 12 hours in day. Finally all these affect environment pollution. The issue of industrial pollution has taken on grave importance for agencies trying to fight against environmental degradation. Nations facing sudden and rapid growth of such industries are finding it to be a serious problem which has to be brought under control immediately.
Pollution is mainly related to air, water and land. Surrounding environment of any industry is depending on emission of that industry. Some industries may pollute air and water more compare to land. In this paper we are considering few industries which are only responsible for air and water pollution emission. To analyze proposed method the data has been collected data of three chemical industries and three thermal power plant units from consultant who are doing the regular monitoring of the industries for environmental audit purpose.
There are many pollutants emitted from above said industries. Among all those considerations have been given to pollutants which are more hazardous to living things. Pollutants like SOx, NOx, SPM and Cl2 emitted in air and SS, TDS, COD, BOD, Chlorides, Sulphates, Phosphates, Oil & Grease, Total Chromium and Total Iron emitted in water are more harmful to living things are considered for calculating the pollution potential.
Proposed method is used to rank all such industries which described in next section, and accordingly government can take the strict action against this type of industries.
3. The Classical TODIM Method
There are number of methods by which we can solve the multiple attribute problems [1] [2] [3] [4] . Almost all methods used expected utility theory to solve MADM problems, in which the strict assumption of the decision maker (DM) is required regarding complete rationality, but behavioral experimental of DM is bounded in such decision process [5] . So in such a case DM’s psychological behavior is used to solve the MADM problem in ongoing research topic.
Many useful multiple attribute methods are available to researchers in decision aiding at present. These methods are based on different mathematical assumptions. A number of accomplishments have been achieved since the late 1970s and new developments and application fields are constantly emerging. Behavioral decision theory is considered to have formally begun with Ward Edwards in Psychological Bulletin, although it went through some major advances in the 1970s and 1980s [6] [7] [8] .
TODIM (Interactive and Multiple Attribute Decision Making, acronym in Portuguese) was first introduced by Gomes and Lima. Later on it was applied on many practical MADM problems, like residential properties evaluation, selection of the destination of natural gas and so on [9] [10] [11] [12] . The classical TODIM method, based on Prospect Theory, is used to select best alternative among all available alternatives. In this method the dominance degree of each alternative over the others are measured first, which reflects DM’s behavioral characteristic like reference dependence. Then after by calculating the overall score of each alternative ranking can be assign to each alternative. TODIM is used to solve the MADM problem by considering DM’s behavior.
The main idea behind the classical TODIM is to calculate the dominance degree of each alternative over all the others alternatives by considering a multi-attribute function based on Prospect Theory [13] [14] [15] [16] [17] . The ranking of alternatives will be observed by this obtained dominance degree. The classical TODIM method used to solve only MADM problem which crisp numbers. The TODIM method does not deal with risk directly, the way the decision maker evaluates the outcomes of any decision can be expressed by their risk attitude: for instance, a cautious decision maker will undervalue a superior result more than a braver one. The algorithm for the TODIM method is described as follows.
Step 1: Decision matrix
 is normalized into
  by normalizing method
where  = crisp number,
  ,
, .
.
Many methods are available for normalizing the matrix. But here we use the following method for normalizing the decision matrix.
 . (1)
. (1)
Step 2: Now relative weight  of each attribute
  calculated by taking
  as a reference attribute.
 (2)
(2)
where .
.
Step 3: Now the dominance degree of alternative  over alternative
  is calculated by concerning attribute
 .
.
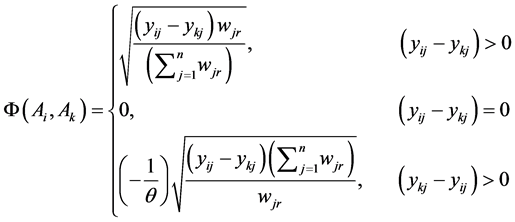 (3)
(3)
where θ = losses attenuation factor.
 = gain of alternative
  over alternative
  concerning attribute
 ![]() if
if ![]() and the loss if
and the loss if![]() .
.
Apart from parameter θ, the attenuation factor of the losses, function Φc does not offer other parameters to delineate the behavior of diverse decision makers, therefore a generic formulation is proposed.
Step 4: Now the overall dominance degree of alternative ![]() over alternative
over alternative ![]() is calculated.
is calculated.
![]() . (4)
. (4)
Step 5: Now the overall value of alternative ![]() is calculated.
is calculated.
![]() . (5)
. (5)
Step 6: Now give rank to all alternatives and select the most suitable one(s) according to the overall scores of alternatives. The higher ![]() the better alternative
the better alternative![]() .
.
Obviously value of ![]() is between 0 and 1 (
is between 0 and 1 (![]() ). Therefore arranging overall values of all the alternatives in descending order, we can obtain the ranking of given alternatives or we can select the most suitable alternative(s).
). Therefore arranging overall values of all the alternatives in descending order, we can obtain the ranking of given alternatives or we can select the most suitable alternative(s).
4. Numerical Examples
In this section, two examples are used to explore the use of the extended TODIM method and finally to rank industries.
Example 1. On the basis of weight established for the sub criteria, the Environmental Pollution Potential Hazard Index was developed for three chemical industries having monitored emission data are taken for study analysis. The three industries are Industry 1, Industry 2, and Industry 3. Here analysis of data is divided in two parts. 1) Score using attributes of air 2) score using attributes of water. Using the TODIM method the calculations are carried out in following manner.
Score using attributes of air: First decision matrix is formed and is shown in Table 1. Here the attributes are the emission of SOX, NOX, SPM and Cl2. Increase in the values of the attributes will increase the air pollution potential. Attribute weight vector provided by the DM is ω = (0.222, 0.203, 0.221, 0.187). To rank the industries, the method proposed in this paper is used and the procedure is summarized below.
Step 1: The decision matrix is normalized using Equation (1) and is shown following Table 2.
Step 2: Relative weights of each attributes are calculated using Equation (2) and shown below.
![]()
Here, in the calculation process,![]() .
.
Step 3: Using Equation (3) the dominance degree matrices concerning attributes SOX, NOX, SPM and Cl2 are constructed, respectively, i.e.
![]()
![]()
Here θ = 1 is taken which indicates that the losses are equally contribute with their real value to the global value [13] .
Step 4: Using Equation (4) the overall dominance degree matrix ![]() built, i.e.
built, i.e.
![]()
![]()
Table 2. The normalized decision matrix.
Step 5: Using Equation (5) the overall value of each alternative can be obtained, i.e., ξ(industry 1) = 0, ξ(industry 1) = 1, ξ(industry 3) = 0.1431.
Step 6: According to the overall values, the ranking order of the three industries is determined, industry 2 > industry 3 > industry 1. Obviously, industry 2 is the most desirable industry.
Score using attributes of water: First decision matrix is formed and is shown in Table 3. Here the attributes are the emission of SS, TDS, COD, BOD, Chlorides, Sulphates, Phosphates and Bio-assay. Increase in the values of the attributes will increase the water pollution potential. Attribute weight vector provided by the DM is ![]() . To rank the industries, the method proposed in this paper is used and the procedure is summarized below.
. To rank the industries, the method proposed in this paper is used and the procedure is summarized below.
Step 1: The decision matrix is normalized using Equations (1) and (2) is shown in Table 4.
Step 2: Relative weights of each attributes are calculated using Equation (2) and shown below.
![]()
Here, in the calculation process, ![]() .
.
Step 3: Using Equation (3) the dominance degree matrices concerning attributes SS, TDS, COD, BOD, Chlorides, Sulphates, Phosphates and Bio-assay are constructed, respectively, i.e.
![]()
![]()
![]()
Table 4. The normalized decision matrix.
![]()
![]()
Here θ = 1 is considered.
Step 4: Using Equation (4) the overall dominance degree matrix ![]() built, i.e.
built, i.e.
![]()
Step 5: Using Equation (5) the overall value of each alternative can be obtained, i.e., ξ (industry 1) = 1.0000, ξ(industry 1) = 0.3797, ξ(industry 3) = 0.
Step 6: According to the overall values, the ranking order of the three industries is determined, industry 1 > industry 2 > industry 3. Obviously, industry 1 is the most desirable industry.
Here the attributes of air and water are calculated separately. But finally ranking of any industry will be combination of both, attributes of air and water. And then we can get final score. Based on that final score we can give the rank to industries. And so it is calculated and shown in Table 5.
It can be seen from Table 6 that the ranking orders of alternatives are:
Example 2. On the basis of weight established for the sub criteria, the Environmental Pollution Potential Hazard Index was developed for three Thermal Power Station Units having monitored emission data are taken for study analysis. The three Thermal Power Station Units are Unit 1, Unit 2, and Unit 3. Here analysis of data is divided in two parts. 1) Score using attributes of air 2) score using attributes of water. Using the TODIM method the calculations are carrying out in following manner.
Score using attributes of air: First decision matrix is formed and is shown in Table 7.
Here the attributes are the emission of SOX, NOX, and SPM. Increase in the values of the attributes will increase the air pollution potential. Attribute weight vector provided
![]()
Table 5. Overall Score of attributes of air and water.
by the DM is w = (0.329, 0.317, 0.355). To rank the industries, the method proposed in this paper is used to rank thermal power station units.
Step 1: The decision matrix is normalized using Equations (1) and (2) is shown in Table 8.
Step 2: Relative weights of each attributes are calculated using Equation (2) and shown below.
![]()
Here, in the calculation process,![]() .
.
Step 3: Using Equation (3) the dominance degree matrices concerning attributes SOX, NOX, and SPM are constructed respectively, i.e.
![]()
![]()
Step 5: Using Equation (5) the overall value of each alternative can be obtained, i.e., ξ(industry 1) = 0.6419, ξ(industry 1) = 1, ξ(industry 3) = 0.
Step 6: According to the overall values, the ranking order of the three industries is determined, industry 2 > industry 1 > industry 3. Obviously, industry 2 is the most desirable industry.
Score using attributes of water: First decision matrix is formed and is shown in Table 9.
Here SS, TDS, BOD, Phosphates, Oil & Grease, Total Chromium, Total Iron are attributes. Attribute weight vector provided by the DM is w = (0.151, 0.118, 0.209, 0.135, 0.113, 0.134, 0.140). To rank the industries, the method proposed in this paper is used to rank thermal power station.
Step 1: The decision matrix is normalized using Equation (1) and is shown in Table 10.
Step 2: Relative weights of each attributes are calculated using Equation (2) and shown below.
![]()
Here, in the calculation process,
![]()
Table 8. The normalized decision matrix.
![]()
Table 10. The normalized decision matrix.
![]() .
.
Step 3: Using Equation (3) the dominance degree matrices concerning attributes SS, TDS, BOD, Phosphates, Oil & Grease, Total Chromium and Total Iron are constructed respectively, i.e.
![]()
![]()
![]()
![]()
Here θ = 1 is considered.
Step 4: Using Equation (4) the overall dominance degree matrix ![]() built, i.e.
built, i.e.
![]()
Step 5: Using Equation (5) the overall value of each alternative can be obtained, i.e., ξ (industry 1) = 1.0000, ξ(industry 2) = 0.9592, ξ(industry 3) = 0.
Step 6: According to the overall values, the ranking order of the three industries is determined, industry 1 > industry 2 > industry 3. Obviously, industry 1 is the most desirable industry.
Here the attributes of air and water are calculated separately. But finally ranking of any industry will be the combination of both, attributes of air and water. And then we can get final score. Based on that final score we can give the rank to industries. The final score of industries are calculated and shown in Table 11. And then rank is assigned to all industries.
It can be seen from Table 12 that the ranking orders of alternatives are
5. Conclusions
The whole study demonstrates the use of classical TODIM method for the ranking of the industries based on their appraisal score, here Pollution Potential, with the case studies. The classical TODIM method, used in this study, can effectively capture Decision Maker’s psychological behavior, to solve this type of problems under hesitant fuzzy environment. Following conclusion has been derived from the case studies.
As the pollution level is increasing, it is suggested that the issue of pollution tax must be studied and evaluated by behavior of decision makers of developing countries to control the pollution levels in the environment. However in this method, all method all attributes considered as equally. It means whether attribute is benefit/beneficial or non-benefit/cost/non-beneficial, all will be treat same. This limitation has impact on considering this method in area of different attributes which include both categories.
![]()
Table 12. Ranking of 3 Thermal Power Station Units
Acknowledgements
This work was partly supported by Prof. Paresh Solanki, Ex. Student, ECED, SVNIT, Surat.