A Decision Support Framework for the Choice of Languages and Methods for the Design of Real Time Embedded Systems ()
Received 14 January 2016; accepted 26 July 2016; published 29 July 2016

1. Introduction
The development of software systems usually starts with the requirements specification, and goes up to the executable code, passing by an architectural model of the system. This is done most of the time, starting from a context diagram. During design, the information contained in the context diagram and the requirements of the specification must be converted to produce the architecture model. A method is then needed to enable designers to move from a state of needs to a system architecture, through a decomposition of the problem, and the identification and specification of system components. This is also true for Real Time Embedded Systems (RTES). However the RTES have other features and constraints [1] that are not found in conventional software systems. One can cite: interaction with their environment, real-time constraints (execution time, period, etc.), real-time control, concurrent processing, limited resources, etc. Their design therefore requires the use of particular methods taking into account these specificities.
Different methods and languages have been developed for the analysis and design of real-time systems [1] [2] , each with a particular focus on some aspects of the system. Each designer will therefore have to choose the method or language to use depending on the specificities of the application domain, and the level of detail he deems important for his model. Therefore it is necessary to know the existing approaches, their strengths and weaknesses, and the major aspects they deal with. This task is not obvious, given the number of approaches and the particularities of each of them. This study is the beginning of the cogitation towards a solution to this difficulty to which the designers are faced. It is firstly done through an overview of the main approaches, then by facilitating their appropriation/understanding on an example, and finally by offering a comparison of the approaches according to some criteria. A separation is made between methods which always include a process and languages which offer notations but do not have processes. This difference already allows making a first choice, depending on whether one favours the availability of a process or not.
In the remainder of this article, the second section gives an overview of the works carried out by other authors on the comparison of approaches to design real-time and embedded systems, and positions our work compared to the latter. The third section specifies the criteria and rating scale used for qualitative and comparative analysis of approaches. The fourth section describes the system which serves as example to illustrate the operation of the different approaches presented. The fifth section is devoted to the presentation of the approaches highlighting the aspects related to the proposed criteria. The sixth section is dedicated to tables providing the ratings of the approaches according to the comparison criteria, to the corresponding graphics for a better appreciation of approaches. A discussion on the results obtained from this study followed by some perspectives concludes this article in Section 7.
2. Related Work
Many works which have been done in the last decade focused on the study and comparison of languages, methods and design processes of Real Time and Embedded Systems (RTES). Some of them examine languages and methods for software architecture in general without restriction on RTES.
STAINES [2] examines and compares several methods of designing real-time systems. He defines a set of comparison criteria, and a mark scheme going from 1 to 5. Then he builds a comparison table in which a score between 1 and 5 is assigned to methods for each criterion defined. A graphic is then constructed from the tables.
SHIRAISHI [3] performs a qualitative comparison of two different approaches of model-based development of real-time embedded systems. The first approach uses the AADL language and the second combines the languages SysML and MARTE. His objective is to compare the two approaches on the phases covered by each of them in the development cycle. He defines seven requirements that an ADL (Architecture Description Language) should meet, then among the ADL identified, he selects those that best meet these requirements. Finally, he combines them into the two approaches mentioned above.
MEDVIDOVIC et al. [4] present a classification of architecture description languages (ADL), and propose a framework to compare them on a set of criteria. They begin by presenting the difference between ADL and other languages (e.g. Programming languages), follow by the definition of three characteristics that ADL must have (components, connectors and configuration), and then address the elements that ADL tools should meet. This study ends with a table for each element of comparison. These tables explain how each sub-element of a criterion is implemented by the languages.
BENDRAOU et al. [5] conducted research on the comparison of six languages based on UML for software process modelling. The authors begin by defining a set of criteria to be met by a software modelling process. Among them, one can cite: semantic richness, modularity, models executability, the compliance with UML standard and formality. Then they perform an evaluation of the overall relevance of languages on software process modelling. They present approaches, by structuring them in paragraphs corresponding to the defined criteria. Each approach is presented alone in a table which analyses its expressiveness. A rating scale is defined as follows: the approach receives 0 if the criterion is not taken into account, 1 if it is partially supported, 2 if it is fully supported. The scale is then used to construct a table summarizing the evaluation of approaches according to the criteria.
CLEMENTS [6] makes a taxonomic study of ADLs. He characterizes these languages in terms of: class of systems they support, properties inherent to languages themselves, processes and technological supports that they provide to represent, refine, analyze and build systems from an architecture. He based himself on the results of a questionnaire produced and distributed to the owners of ADL, and which has allowed to characterize each ADL in terms of type of systems and architectures it supports, types of analysis that it facilitates or offer and of intrinsic qualities. The results of this survey are summarized in a table containing all the ADL considered.
The works presented above deal with the comparison of approaches to design real-time systems, but some of them ( [2] [6] ) do not take into account recent languages such as SysML, AADL, MARTE, others ( [3] - [6] ) focus on languages and do not address methods. Some of the works presented ( [2] ) have a scoring method based on the authors’ experience. Although this scoring method has the advantage of allowing to benefit from the experience of the authors, their disadvantage is to be quite subjective. Indeed, the scores based on authors’ experience can quickly vary from one experiment to another. Furthermore, dependability that is an important property in the majority of real time and embedded systems, is not taken into account in almost all of these works ( [2] [4] [5] ).
The goal of our work is to provide an objective comparison of approaches dedicated to the design of real-time and embedded systems, taking into account both modelling languages and design methods, including recent modelling languages (SysML, AADL, MARTE), and incorporating the criterion of dependability. In the next section, we present our comparison criteria and our rating scale.
3. Comparison Criteria and Scale of Ratings of Approaches
For the comparison of approaches, we defined four criteria inspired by those proposed in [2] . Each of these criteria is characterized by a set of elements (sub-criteria). These criteria are:
-Usability: It reflects the ease of use of the method or language. This property seems important to us and even essential, because the approaches that are easy to use are generally preferred to those that are more complex. For each approach, we evaluate the ease of use from the following elements: clarity of its diagrams, types of notations used (textual, graphical, XML), the possibility to generate code from its models and existence of software tools (free and proprietary) supporting it.
-Availability of notations and techniques for real-time: This criterion evaluates approaches on their ability to take in charge and to manage real-time aspects. We defined a set of elements for this evaluation. Thus, this property takes into consideration: communication (exchange of messages, priority on messages, shared data, management of events and signals), concurrency management mechanisms, synchronization mechanisms (mutual exclusion, semaphore, monitor, rendez-vous) and time management (time quantification, management of simple or multiple clock). Special notations must be available in the approaches for the management of these elements.
-Dependability: Real-time systems are systems in which, in general, design errors and the failure to comply with temporal constraints can be fatal. An important criterion in the choice of design approaches, is then their ability to prevent this kind of failure, by providing means for error prevention and fault tolerance. The elements considered here are: the insurance of the system (formal notations and formal verification, modelling of errors), the management of quality of service (failure analysis, communication safety, security of interactions between components), the possibility to analyse models (schedulability and performance analysis) and simulation.
-The ability of modelling of software and hardware (codesign): in many systems, satisfaction of real-time constraints need to take into account both hardware and software aspects. In such cases, it is important to model not only the software, but also the hardware on which it will be deployed. Given its specificity, this criterion will not be detailed as the others. We simply specify which of the approaches discussed, take it into account. We give an analytical table specifying whether or not an approach takes it into account.
Regarding the mark scheme of approaches, we do more a qualitative comparison and thus specify if the property is taken into account (1) or not (0) by an approach. To compare the methods, a score will be assigned to each approach for each criterion, by simply summing the 0 and 1 obtained for each sub-criteria of the criterion.
4. Presentation of the Illustration Example
This section presents the system that will serve as a basis to illustrate some aspects of the operation of the approaches considered in this article. This is a speed control system (cruise control) of vehicles, whose description is available in [7] - [9] . This system consists of several components that interact in real time. In this system, the user data and the sensor data are read at the input. These data are used to set the new value of the desired speed, which will be compared to the current speed. The result of this comparison is used to define the adjustment value of actuator output. The function of the speed controller is to take over the task of maintaining a constant speed at the driver’s request. Once adjusted, the system is activated and supports the throttle control. When activated, the cruise control can be suspended and restarted by the driver by pressing the suspend/resume button, or the brake pedal. While suspended, the system must memorize the desired speed. The driver must be able to enable, disable, start acceleration (increase speed), stop the acceleration (decrease speed) and restart the automatic system. He increases the speed by depressing the accelerator pedal, and lowers it by pressing gradually on the brake pedal. He also has the ability to change the gear selection while the cruise control is active, by entering a new desired speed. When the accelerator is released, the control system resumes control from the last set speed. The entry of any other command than those intended for the speed control system, deactivates the automatic system.
Figure 1 below shows a block diagram of the system with the input-output signals [10] [11] .
This system has the following inputs/outputs:
-cc_system_on_off: activated, this signal indicates that the speed control system would recognize the inputs by treating them appropriately.
-engine_status: activated, this signal indicates that the vehicle engine is switched on, the speed control system
![]()
Figure 1. Inputs/outputs of the cruise control system.
is active only if the engine is running.
-brake_status: This signal is activated when the brake pedal is pressed, the cruise control will disengage when the brake pedal is pressed.
-resume: This signal contains the last speed maintained, it is only applicable if the cruise control is on.
-decrease_speed: This signal decreases the speed maintained, it is only applicable if the cruise control is on.
-increase_speed: This signal increases the speed maintained, it is only applicable if the cruise control system is running.
-set_speed: when it is generated, the current speed should be maintained.
-wheel_pulse: signal (pulse) sent to each wheel spin.
-clock: this signal sends a synchronization pulse (for example, every 10 milliseconds).
-throttle_setting: this signal corresponds to the position value for the accelerator setting.
5. Presentation of Methods and Languages
An analysis and design method is a process whose objective is to allow to formalize the stages of development of a system, to make this development more faithful to the needs of the client. To do this, we start with an informal statement (need as expressed by the client, complemented by information obtained by soliciting experts of the field, such as future users of software), and the analysis of the potential existing (that is to say, how the process to design is currently implemented at the customer). In a method, one uses one or more modelling languages for symbolic or schematic representation of the various models produced in the method, tools and one applies an approach. In other words, a method is a set of one or more modelling languages, of a process or approach to drive the development and tools that support it.
In this section, we present design approaches (languages and methods) of real-time systems by giving for each of them: a brief presentation; the ease of use it offers (take in hand, the availability of tools supporting them, concepts and notations available for the representation of systems); the means provided to compose the system from structural elements, and produce the architecture; elements provided for real-time aspects of the system; dependability mechanisms offered by the approach; an illustration of its use through the application to the example chosen. The approaches presented in this section have been chosen to be a representative subset of design methods and modelling languages of real-time and embedded systems. These approaches are also those most studied in the literature. The section is organized into two sub-sections: the first presents methods and the second is devoted to modelling languages for real-time systems.
5.1. Methods
5.1.1. CORE (Controlled Requirements Expression)
1) Presentation
CORE method [12] - [14] ―was designed in the UK for the requirements analysis phase (needs) and projected for the avionics industry. The authors of this method are based on the fact that there is a relationship of cause and effect between the requirements specification of a system and the quality of the final system. This is a consistent method for the specification of real-time requirements, which integrates object-oriented models, graphics and formal specification, which allows non-algorithmic specifications [15] . CORE is object-oriented in the sense that a CORE specification is written in terms of objects and relationships between objects. Objects are its primary architectural components. But its approach differs from that of many object-oriented methods, because it uses a model of formal behaviour to guide the decomposition and definition of objects. This behaviour model defines the types of information that the definition of an object may contain, that its interface can provide, and that other objects can use. A behaviour model allows developers to select an appropriate set of objects, to define them and determine the moment where the specification is complete and consistent. The behaviour model determines what information should be captured, the data model describes how information is organized. The final products of CORE include: the context diagram, the information model diagram (shows the dependencies between static objects), the transformation model diagram (shows the interfaces information that are used by objects), the element model of input data (gives for each input to the system, an acronym, its values and meaning, the transfer mode of the data, etc.) [15] , the element model of output data. It is applicable to the description of dynamic aspects of several types of systems.
2) Usability
CORE is more specialized for the needs analysis phase. As such, it provides a facility for the understanding of the system to be developed. It makes extensive use of the concept of point of view and allows developers to better understand the system by studying it under different angles. CORE defines steps for requirements specification: for each step, the activities to be undertaken are described, as well as controls to perform. It offers a graphical notation that supports it. This is a fairly simple notation and which can be applied to different aspects in the system description. It also provides a consistent formal interpretation of its graphical and mathematical notations. This allows to graphical specifications to be combined easily with detailed specifications, which are given in mathematical and textual notations. Finally, CORE describes the required behaviour in the form of mathematical relationships between the quantities of the environment, it makes it possible to specify requirements without providing unnecessary details of design. This is a mathematically rigorous method. Thus, it supports precise requirements, unambiguous, complete and consistent. The results of the analyst’s work are recorded in the CORE diagrammatic notation for which a set of rules is laid down. This notation will be accessible to most clients. Its diagrams are classified into two categories: dynamic diagrams that represent the time flows and the connections between ordered temporal elements and static diagrams that show the hierarchical structure linking the dynamic diagrams. CORE does not provide a textual language to describe the developed systems. It offers a four-step approach: 1) definition of the problem, 2) definition of points of views of the requirement (life cycle, environment, operator, reliability), 3) development of detailed models for each point of view, 4) combination of the different points of views in a compound model. There are a few tools such as CORE, which is a complete modelling environment designed for engineering of complex systems. It allows requirements management to ensure that we capture accurately the needs of customers, it allows to build fully executable behaviour models. There is also PSL/PSA (Problem Statement Language/Problem Statement Analyzer), which is a computer-aided technique for structured documentation and analysis of information processing systems; it is a powerful requirements modelling toolkit.
3) Compositionality
It is possible to achieve a structural composition of the system from its notations; Indeed, CORE offers two ways of decomposing a system: the data decomposition and the actions decomposition. Furthermore, static diagrams provide a structural view of the system. Its diagrams are quite understandable and it offers a textual interpretation of diagrams (static and dynamic). CORE analysis proceeds iteratively, each iteration decomposing the viewpoints at a certain level. In this way a top-down expansion of the viewpoint hierarchy is produced. (this is similar to the viewpoint models of SADT). It is the responsibility of an experienced analyst to extract from all the parties concerned the relevant viewpoints, at each step, and the relationships they have with each other and with the hierarchy of which they form part. CORE defines how the analyst should propose, define and confirm these relevant viewpoints. The “confirmation” of viewpoints means their successful combination into a coherent system, the addition of reliability actions and data to the combined viewpoints, and their acceptance by the users [14] .
4) Existence of notations dedicated to real-time
For each point of view, CORE allows to define various types of characteristic information. Thus one can define actions (send a message, execute an instruction, etc.), time-based events which trigger these actions. This allows to support the analysis of some real-time aspects.
5) Dependability
As we mentioned above, CORE provides a consistent formal interpretation of graphical and mathematical notations. This can help to make a formal analysis of models so specified. CORE is also seen as a procedure for determining the functional requirements of a system, and develop the functional specifications of this one. It determines the requirements from different points of view, including that of reliability. Thus, the specifications produced by CORE from requirements related to reliability, take into account the actions to be executed by the system in case of failure, and under different conditions.
6) Illustration example
The central concept of CORE is the viewpoint and the associated representation known as the viewpoint hierarchy. Viewpoints are not only concerned with human perspectives. Viewpoints can be associated with:
・ the system’s stakeholders;
・ the system’s operating environment;
・ the system’s domain.
Thus, a viewpoint can be a person, role or organization that has a view about an intended system.
When used for system requirements, the viewpoints can also represent the intended system, its subsystems and systems that exist within the environment of the system that may influence what the system must do. The viewpoints are organized in a hierarchy to provide a scope and also to guide the analysis process [16] .
First, we must identify viewpoints. For example, on Cruise Control System, here’s a possible list of initial views that can be obtained after a brainstorming.
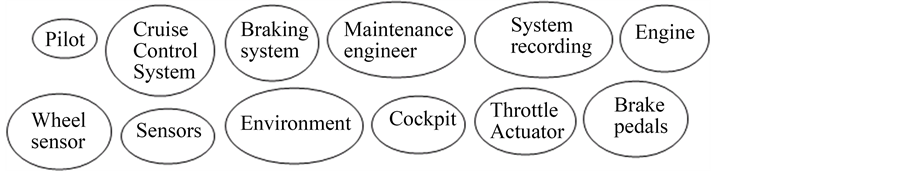
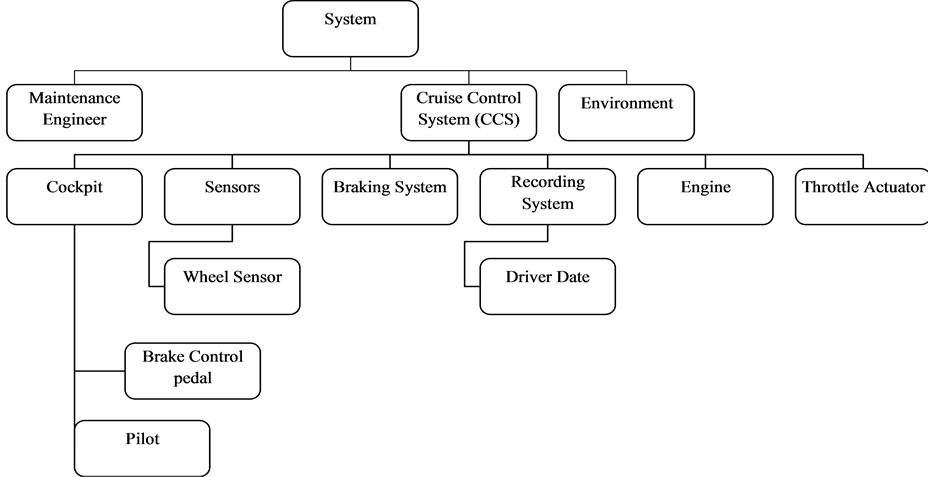
Having produced a list of potential viewpoints, they are organized into a hierarchy by grouping related candidates. The figure below shows a partial hierarchy of viewpoints for the Cruise control system.
7) Strengths and weaknesses
CORE is adapted to the requirements specification of a system. It expresses specification with the help of informal notations such as block diagrams. But CORE is a mathematically rigorous method, which also provides a formal interpretation of its graphical and mathematics notations. This approach could be used in conjunction with object-oriented analysis. It is supported by a fairly simple diagrammatic notation, but that allows to represent several essential points of views of the required system configuration. The main limitations of CORE are: 1) The real-time aspects, the concurrency management and the synchronization are not clearly defined; 2) It is inappropriate for the architectural design; 3) It is rigid and relies on too many steps; 4) For anything but very small projects, manual support of CORE is likely to be unwieldy and an automated tool such as PSL/PSA or SDS/RSRE is required.
5.1.2. Jackson System Design
1) Presentation
JSD [12] is a method for the specification and design of systems whose field has a strong temporal capacity, and containing objects whose behaviour is describable by sequential events. The Jackson method has been used for several systems development problems. These are systems ranging from data processing to music synthesizer, passing by control software and embedded systems.
2) Usability
JSD provides a graphical notation and its sequential processes are documented by a pseudo code, called structure text. It is a linear method. Therefore, its steps are simple to follow. Three basic principles underpin the functioning of the JSD method:
-We must begin the development by describing and modelling the real world, rather than specifying or structure the functions performed by the system;
-An adequate model of a time-ordered world must itself be ordered in time, the main aim being to match the progression of real world to the one of the system that models it;
-The implementation of the system is based on the translation of its specification into a set of effective processes. These processes must be designed so that it is possible to do them operate on the software and hardware available.
JSD has three phases in its implementation [1] : the modelling phase, the network phase and the implementa- tion phase.
The modelling phase: In this phase, the designer identifies the entities of the system, the actions that they carry out, the order of execution of actions in the life cycle of entities, and attributes of entities and actions. A structure diagram of entities is produced, which gives a full description of the system and its organization.
Network phase: At this stage a model of the whole system is developed and represented in form of diagram of specification also called network diagram. The network diagram shows the processes and communications between them. The communication between processes is in the form of data streams or messages through state vectors. So this phase focuses on defining the system functionalities. Each entity identified in the previous phase, becomes a process in the network diagram. The programs which are external to the system are added to the diagram later. The whole system is described using these network diagrams, which are complemented by the description of the data and the connections between the processes and programs.
The implementation phase: During this phase, the JSD specification, composed potentially of a very large number of processes, is translated into a system implementation diagram which is directly executable. The latter presents the system as a process scheduling calling the modules that implement the system.
There are a few tools to build JSD diagrams; we can mention:
-Smartdraw: which provides an editor to build the structure diagram of entities (from the modelling phase) and network diagrams (the result of the network phase). This tool is not free.
-Jackson Workbench: is a suite of tools making it possible to build, among others, the JSD diagrams.
-We also have JSD Network Editor, which supports the JSD method for the design of software systems. This editor offers a wide visual interface that allows the specification and implementation of JSD network diagrams.
3) Compositionality
The system is built gradually from its components. In the modelling phase, the system is broken down into its various entities; then the actions realized by these entities are specified. The various components of the system thus obtained are grouped in a structures diagram of the entities.
4) Existence of notations dedicated to real-time
The method provides the following possibilities:
Communication by message: in the network diagram, the communications in the system through connections by data stream are done by sending messages.
Support for special event type: JSD uses messages called time markers that act as data flow but contain synchronization information. They are roughly merged with other data streams to monitor the arrival of messages and the moment of execution of processes. They are used to trigger actions within the processes, start and stop processes and generally help to process synchronization.
5) Dependability
JSD allows to define a permissible delay between the sending and the reception of a message, which ensures some security in communication.
6) Illustration example
JSD method provides the following graphical notations for systems modeling (see Figure 2):
The process represents a sequential thread of execution; streams (data stream) which are infinite buffers allow not only communication between two processes, but also to communicate external events to a system. A process can write in a state vector, if it is the owner (source of the state vector) or simply read its contents otherwise.
Figure 3 shows the network diagram of the control system of a vehicle containing the speed controller.
Figure 4 shows the network diagram of the cruise control subsystem.
7) Strengths and weaknesses
The application of JSD to design of real-time systems has strengths, but also limitations [1] .
Strengths:
-The emphasis on modelling of real-world entities is a theme that has been followed by several object- oriented analysis and design methods;
-The modelling of each entity of the real world, focusing on the sequence of events experienced by the entity is particularly relevant in the real-time systems design;
-The concurrent treatment is an aspect which is at the heart of the method.
-Clear steps are planned to spend from a JSD design to an implementation.
Weaknesses:
-Since the structure of entities and therefore, the models of structures handling event sequences almost faithfully represent the real world, relatively minor changes in the real world can affect the software structure, which could make maintainability more difficult and is a potential barrier to reuse;
-JSD uses a structure diagram of entities to represent systems, while it is often easier to model the events sequence in a complex entity with a state-transitions diagram; especially in real-time systems where complex
![]()
Figure 3. Network diagram of the control system of a vehicle.
![]()
Figure 4. Network diagram of the cruise control subsystem.
events sequence are not uncommon.
5.1.3. Real Time Structured Analysis and Design, Yourdon Structured Method and Design Approach for Real Time Systems
1) Presentation
RTSAD [10] [17] , DARTS [10] and YSM [12] [18] are three fairly close methods based on the DFD (Data Flow Diagram). They include an extension to DFD by adding the details on the flows of events and controls transformations: discrete, continuous, activation and deactivation. They also use state transition diagrams.
YSM is based on the classic DFD and structured methods used for designing traditional data. This method has been adapted and combined with many real-time design approaches. YSM has been developed and improved over the years and many modern tools support its notations.
2) Usability
These methods use two main types of diagrams: the Data Flow Diagrams (DFD) and the Control Flow Diagrams (CFD), which in principle can be combined. They are quite well known diagrams, reflecting the take on hand fairly quick and easy of these methods. In addition to the DFD, the CFD and state transition diagrams, there are other notations intended to provide more detailed information on the design. Among them, there are entity-relationship diagrams and structure diagrams. These, though important, are less specific to the definition of the behaviour of real-time systems.
A particularity of YSM compared to the other two, is that it can be used in conjunction with diagrams like the PEM (Processor Environment Model) [19] , which describes how the activities of the system and data are allocated to different processors, which helps to decide on the hardware configuration of the system; and SEM (Software Environment Model) [19] , which is a description of the software architecture over a processor.
The RTSAD method provides an approach structured in five steps: defining a context diagram, decomposition of the system into a data stream or control flow, building of a control transformation or control specification, process specification, and development of a data dictionary. YSM as for it is based on the conventional DFD and structured methods used in traditional conceptions of data. Regarding the DARTS method [10] , it offers the following steps: specify the system using notations of RTSAD, structuring the system into concurrent tasks, define the interfaces of tasks, design each task.
It is possible to derive the program code from the decomposition model of the system and the diagram of tasks architecture.
An example of tool is the SELECT Yourdon, which operates under the Microsoft Windows environment, and allows people with a small budget to design and document their products. It supports data streams and controls streams. It also allows the design of state transition diagrams and allows to create a complete data dictionary.
3) Compositionality
The use of YSM begins with a high-level description of the system, which breaks down until lower levels (simple) with complete specification of the program. In RTSAD method, the system is decomposed into a stream of data or controls. It is an approach that consists of breaking down a system into its components through a DFD or a CFD. In DARTS, the second step of the method consists in decomposing the system into subsystems and to identify interfaces of these latter. This decomposition is done until the concurrent tasks of the system are obtained.
4) Existence of notations dedicated to real-time
In these methods we have the notions of control flows (signals or interruptions) and of control processes (processes whose only job is to coordinate and synchronize the activities of other elements of the DFD). The DARTS method particularly includes concurrency in the design, and allows the expression of communication and synchronization mechanisms between the units of concurrency. There is also a concurrent version of DARTS called CODARTS [10] , which is an improvement of DARTS specialized in the development of real- time systems, with a reinforced take in account of concurrent aspects. The final products of the method are: the tasks diagrams that define the tasks and their interactions, and structure diagrams of each task which provide a static description of the code. The YSM method introduces additional elements necessary for the consideration of real-time systems: continuous temporal data, event data (logical signals), continuous flow, control flow (signal), command memories, commands to enable, disable and trigger the processes.
5) Dependability
These three methods do not define any technique of dependability, if we do refer to the elements chosen in this work to characterize this aspect.
6) Illustration example
These methods use the following symbols for the construction of their different diagrams:
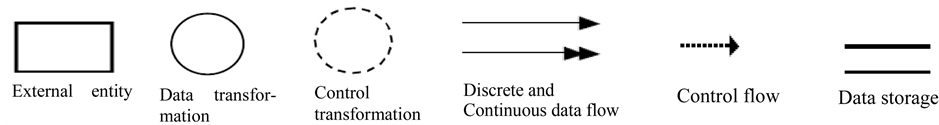
We illustrate the use of these notations in the diagram of Figure 5, which shows the context diagram and data flow diagrams (DFD) of the cruise control system.
Works have been done on the integration of temporal aspects in the DFD. Thus, new concepts and notations have been defined to distinguish: three types of streams of events (signal, activation, deactivation), and two types of storage (data storage and buffer).
Figure 6 shows these various elements.
The works of [20] give more details on these concepts, as well as uses thereof in the specification through examples.
In addition to these DFD techniques, the DARTS method uses other notations that we will present in the section related to ADARTS.
7) Strengths and weaknesses
For these three methods, the main advantage is the use of a high level of structured analysis of data. They are easy to take in hand, because they use fairly well known diagrams (data flow diagram and control flow diagram). They present some limitations: 1) They are unsuitable for prototyping. 2) The steps must be carried out sequentially for a successful implementation. 3) It is difficult to control the time required for the full implementation of the system. In addition to these limits, CODARTS presents few others: it is designed primarily for the ADA language, the notations used are not easy to understand, it is complex to use and offers a limited number of views in the system design.
![]() (a)
(a)![]() (b)
(b)
Figure 5. (a) Context diagram; (b) The cruise control DFD.
![]()
Figure 6. Types of flows of events and storage.
5.1.4. Modular Approach to Software Construction, Operation and Test (MASCOT)
1) Presentation
MASCOT [12] [21] [22] was published for the first time in 1970 by the Institute of Signals and Radar in the UK, and several versions exist. Its most recent version is version 3. It is mainly used for avionics and military applications. It is a very rigorous modular approach based on hierarchical decomposition towards the base levels. MASCOT is based on processes or activities in a system and has for goal to design interactive and complex real-time applications, in a highly structured approach. It focuses on the communication between the different components of the system and requires that the specification be complete at each level.
2) Usability
MASCOT is based on a form of functional and structural decomposition, which is particularly suitable for use in the development of large distributed real-time embedded systems for data processing. The emphasis is on the word “large”: a large number of people involved in the development, a large amount of code to write, a large number of requirements to be taken into account at the same time, a wide variety or quantity of hardware resources, a project whose development extends over a long period. Of course, all these measures of sizes are relative. The method provides a design language and a graphical notation, and a process of conceptual derivation. MASCOT models are stated in terms of a set of text modules and diagrams that support the principles of data flow on which the method is founded. These diagrams are used to show the decomposition of a system into subsystems consisting of concurrent tasks. The interfaces between the tasks are in the form of channels (message queues) and pools (information hiding modules). There is a textual language to describe the graphic representa- tion. The main steps of this method are: 1) Fully describe the internal functions of the system, and its relations with the outside. This is done through the network diagram. 2) The first network is decomposed into components of lower level, 3) the components are encoded in terms of algorithms and data structures.
In terms of tools, we have the development environment of MASCOT version 3.1, which was defined in terms of a set of functions to control the progressive capture of a design.
3) Compositionality
Modular as its name suggests, the cornerstone of the method is a particular formalism by which a complex software can be broken down into a number of smaller components that interact with each other, and this decomposition process can be repeated at any depth required to produce a manageable development task.
4) Existence of Notations Dedicated to Real-Time
MASCOT provides the ability to use certain communication protocols [22] . These protocols allow asynchronous communication, which prevents implicitly the interlocked timing relationships into the synchronous communication.
5) Dependability
MASCOT does not define any technique of dependability, if we refer only to the elements chosen in this work to characterize this criterion.
6) Illustration example
MASCOT is characterized by two types of elementary basic components: activity (a single thread of execution), which is an active element, and IDA (intercommunication data area) which is a passive element. IDAs are interconnected to form a data flow diagram.
Connection to physical entities (represented by a grey rectangle) is made by dashed lines, which indicate what software unit is responsible of which hardware.
MASCOT uses a number of concepts and notations for systems modelling, including:
-Activity: A rectangle with rounded edges and often a circle
-IDA: A rectangle or a rectangle with rounded side.
-Window: A small full rectangle. This is a IDA point, marking the passive end of a connection of data flow.
-The port: A small full circle, this is a point in the activity that marks the active end of a connection of data flows. Each port expresses a requirement for access to data of the IDA, which must be satisfied when the port is connected to a window of IDA.
-The path: An arrow, this is a connection between a port and a window. Only one path must be connected to a port, but several paths can be connected to a window.
-The physical entity: A grey rectangle.
The name of an activity or an IDA is placed within the concept, while the name of the instantiation thereof is located outside of its representation.
Figure 7 below shows these notations and one way to use them in a representation.
On Figure 7 we have an activity (Activity 1) that contains another activity (with the ports P1 and P2) and 2 IDA (having windows F1 and F2). The IDAs make it possible to Activity 2 to communicate with entities E1 and E2.
Figure 8 provides a representation of the cruise control system using MASCOT.
7) Strengths and weaknesses
5.1.5. Ada Based Design Approach for Real Time Systems (ADARTS)
1) Presentation
2) Usability
![]()
Figure 7. Graphical representation of MASCOT concepts.
![]()
Figure 8. Network diagram of the cruise control system with MASCOT [23] .
3) Compositionality
4) Existence of notations dedicated to real-time
ADARTS was developed to extend concurrent task aspects of DARTS, putting also emphasis on the information hiding. ADARTS naturally includes real-time characteristics of DARTS presented above. Another evolution of DARTS called DARTS/DA has been proposed for the design of distributed real-time applications.
5) Dependability
ADARTS does not define any dependability technique, if we refer only to the elements chosen in this work to characterize this aspect.
6) Illustration example
ADARTS uses DARTS notations. It includes interprocess communication.
Figure 9 shows symbols proposed by DARTS and ADARTS, with an example of use on the cruise control problem.
7) Strengths and weaknesses
A key strength of ADARTS is the maintainable and reusable character of designs it produces, because it uses
![]()
![]()
Figure 9. Symbols used in DARTS for interprocess communication and example of use on the cruise control problem.
5.1.6. Real Time Object Oriented Modelling
1) Presentation
ROOM [26] is a convenient method for real-time software development, which combines the object paradigm with advanced concepts of domain-specific modelling. The emphasis is on modelling on “software architecture” level, which is the key to ensuring the reliability and scalability. The method is also distinguished by its ability to take advantage of computer-based automation (through executable models, reuse and automatic code generation) for better product quality and a higher productivity. ROOM has been used successfully in many industrial projects. The primary structural element of ROOM is called “actor”. An actor is a concurrent object responsible for performing a specific function. An actor communicates with other objects through one or more interface objects called ports.
2) Usability
ROOM defines a specification of the system at two distinct levels, but formally linked. The top level, called schematic level, is used to specify the architectural aspects of a system. The lower level, called detail level, defines the details of a finer implementation. This method allows the use of languages such as C++ [27] , for an easy implementation of specifications. This ensures a high level of architectural specification that will be part of the specification of the complete implementation. An important feature of ROOM is that it is an object-oriented approach, which makes use of the full range of powerful features inherent to the object paradigm (encapsulation, polymorphism and inheritance), even in the architectures specification. ROOM has a graphical representation and textual notations. It uses finite state machines to specify the behavioural level, because state machines are quite commonly used to capture the reactive behaviour of systems. A special type of hierarchical state machine, called ROOMcharts is used in the method. The ROOMcharts are similar to UML statechart diagram. Objec Time tool produced by the company Advanced Technology at ObjecTime Limited, and the Edraw tool are examples of tools supporting the ROOM method.
3) Compositionality
4) Existence of notations dedicated to real-time
ROOM focuses its schematic language on a single domain: real-time distributed systems, characterized by events or reactive behaviour. This means that all proposed notations are specific to this field. It handles events by sending messages. The arrival of an event is signalled by the arrival of a message to an object. Sending messages is useful for modelling the asynchronous nature of the events, as well as for the treatment of distributed systems where shared memory may not exist. Communications based on synchronous and asynchronous messages are supported.
5) Dependability
The ROOM method allows to define models which will be simulated by its ObjecTime tool. This allows to do a sort of validation a priori of models before their implementation.
6) Illustration example
ROOM uses the following concepts:
-Actor: This is the primary structural element of ROOM. It is a competitor object responsible for performing specific functions.
-Port: Enables communication between actors and other objects.
-Connection: Establishes a communication link between two ports.
For the representation of complex systems, ROOM combines one or more different types of objects in an aggregation of functions. In ROOM, this is represented by three mechanisms of primary composition: binding, layer connection and the containment relationship.
An actor is represented as shown in Figure 10.
P1 is a provided Port (signal transmitter) and P2 is a required port (signal receiver).
We show in Figure 11 a model representing the speed control system, wherein the cruise control is an actor.
The system is then defined by seven actors: one for the system speed control (cruise control system) and one for each component with which the cruise controller interacts to perform its functions.
The behaviour of each actor is given by a statechart diagram.
We give thereafter the internal structure of the control system itself. This is what is shown in Figure 12.
It is possible to define temporal constraints on transactions between system components. For example, Figure 13 (adapted from [28] ) shows transactions with temporal constraints, between the speed controller and other system components.
On this schema, we define a time of 100 ms between the time where the user enters his speed (through the lever), and the one where the new acceleration data are issued by the system.
7) Strengths and weaknesses
ROOM uses a “run-to-completion” model event processing. This simply means that messages are processed one at a time; once the management of a message is initiated by an actor, and until it is completed, no other message is processed by the actor (which implies to put messages in queue at interfaces). The advantage of this
![]()
Figure 10. Representation of an actor in ROOM.
![]()
Figure 11. ROOM model of the composite structure of the system incorporating the speed controller.
![]()
Figure 12. ROOM model giving the internal structure of the cruise control.
approach is that it provides the automatic mutual exclusion of event handlers and, therefore considerably simplifies the behaviour specification. It has some limitations among which: it requires a special tool called “ObjecTime”, it has a limited number of diagrams, which show only certain views of the system: the static view with the level of architectural specification and the dynamic view with ROOMcharts and details for the implementation. Diagrams that it offers do not allow a good conduct of initial requirement engineering.
5.1.7. Hierarchical Object Oriented Design
1) Presentation
HOOD [2] [29] is one of the first methods of object-oriented design. It was created by the European Space Agency to provide models-oriented solution over the Ada programming language, for its major projects such as Ariane, Hermes and Columbus. It defines a fairly complete development process from requirements analysis to
![]()
Figure 13. Message sequence annotated of system transactions. Adapted from [28] .
code generation of distributed real-time software. HOOD can be used for prototyping. The idea is to identify objects in a hierarchical parent-child relationship, and their operations. A graphic description of the system is produced in a data/controls flow diagram.
2) Usability
HOOD provides a graphical notation, with fairly clear diagrams and easy to understand. HRT-HOOD version has a textual notation. With HOOD, a project consists of a set of main modelling units called “Designs”. A “Design” may lead either to a completely autonomous software application (executable file), or a library of linkable software entities (functions, data types, classes, …). Moreover, dedicated categories of models have been defined to support reusable parametric components (generic) and software partitioning of distributed systems (virtual nodes). Each HOOD model (design) is the root of a hierarchy of components which are usually built in a top-down approach that directs the architectural design phase of the software development process. HOOD applies the client-server communication between interacting components. Accordingly, all these interactions are implemented by function calls. In particular, the standard rules of HOOD recommend to prohibit direct access to shared variables and to implement all the data stream by subroutines calls. Furthermore, in order to ensure a good management of the development team, of the modular deployment and maintenance of applications, HOOD imposes a strict visibility of rules easily controlled at the design level. The life cycle proposed by HOOD is fairly standard and includes: requirements definition (specification of functional and non-functional requirements of the system is produced), architectural design (a high-level description of the proposed system is developed), detailed design (the design of the complete system is specified), coding, testing (system efficiency is tested).
There are tools supporting HOOD, among which STOOD, which is a tool produced and marketed by the Ellidiss Technologies company. STOOD offers many features: it makes it possible to ensure an update of traceability between the system and the software models and the initial requirements, which may be imported from text files or other tools; It provides a graphical editor for building of architecture models of the software and its environment (libraries, runtime platform, …); it also allows detailed design, checking a design, integrating analysis tools, automatic code generation in Ada, C and C++, and generating design documentation.
3) Compositionality
As mentioned above, the HOOD method is based on system decomposition into a components hierarchy describing the system. Thus the objects are identified, and for each object, its children objects are identified, and so on. It guarantees a low coupling between modules (components) of a system, which is a necessary factor for system components reusability and maintainability.
4) Existence of notations dedicated to real-time
HOOD modelling structures include active components to support concurrent control flow in same software. Communication protocols between the active components are defined and include synchronous (low and high) and asynchronous paradigms. A specific version of the HOOD method called HRT-HOOD (Hard Real-Time HOOD) [30] introduces more accurate real-time components. It allows for example to define the type of an object, which can be: protected, cyclic or sporadic. For cyclic and sporadic objects, this version of HOOD allows to define: the period (cyclic objects), the minimum arrival time interval (sporadic object), deadline (for the 2 types of objects). These temporal attributes are managed for scheduling analysis purposes. In addition, in HRT- HOOD, protected objects control access to data that is shared by more than one thread (this is concurrent activity through an object).
5) Dependability
The decomposition rules of the method ensure the obtaining of a final design onto which temporal properties analysis can be performed. Indeed, in HRT-HOOD, object attributes were added to the terminal objects, to enable them to be annotated with their real-time characteristics (time, period, worst case execution time). This provides the possibility to perform analysis of non-functional properties on the resulting models (scheduling analysis, performance analysis, etc.).
6) Example of illustration
A HOOD object is defined by a name, a set of operations, a tree of children objects, a tree of implementations in children operations.
The diagram of Figure 14 shows a representation of one HOOD object and one HRT-HOOD object. The difference lies in the type of the object (passive object, active, cyclic, sporadic, protected) which is specified in HRT-HOOD.
Figure 15 shows, in the HRT-HOOD notation, an object representing the control system of a vehicle (simplified), with the tree of its children objects, including speed control. The system is considered as an active object (A).
Since we are interested in the speed control subsystem, it is question of giving its internal structure. This is done by considering the Cruise Control object in Figure 15, and by giving its tree of children objects.
This representation is given in Figure 16.
7) Strengths and weaknesses
HOOD has a fairly complete development process that goes up to the code generation of distributed real-time software. Its charts are easy to understand. HOOD allows to define generic components, configurable and there- fore reusable. A HOOD design defines loosely coupled modules, which ensures system maintainability and reusability of its components. In addition, HOOD4 version significantly improved the method by taking into account the true object-oriented, providing opportunities for code generation in C++ and Ada95. HOOD has limitations: it does not distinguish data flows between objects from events signals, it is not so simple to use, and it uses a single type of diagram.
This section has dealt with design methods. The following subsection is devoted to the modelling languages used in the design of real time and embedded systems.
![]()
![]()
Figure 14. (a) A HOOD object; (b) A HRT-HOOD object.
![]()
Figure 15. HRT-HOOD model of the control system of a vehicle.
5.2. Languages
5.2.1. Unified Modelling Language (UML)
1) Presentation
UML [31] - [35] can be considered as a combination of the notations that exist in methods such as ROOM, HOOD, YSM MASCOT, etc. The word “unified” implies a unification of different models. Several diagrams it uses are adapted from other methods. It contains notations that are lacking in other methodologies and it tries to improve and standardise them. It is very well supported by a variety of tools compared to other methods, and its use requires no formal knowledge.
2) Usability
UML is not a method (i.e. a normative description of the modelling steps), but a graphical language for representing various aspects of a system. It provides a set of graphical notations grouped into charts specific to each aspect of a system. Each graphical notation has an associated text which explains its content. UML allows to see the system in 2 different angles called views: a static view and a behavioural view. Although not being a method [31] , it can be combined with almost any method of development. Diagrams and notations used are informal, but it is possible to use the OCL (Object Constraint Language) to formalise the diagrams. Code can be generated from some diagrams, such as class diagram. UML offers 13 charts to cover all aspects of a system. UML is supported by dozens of tools. These offer graphical editors for the construction of diagrams, and most of them also offer a feature of code generation from diagrams. Some of these tools are free, as Acceleo ArgoUML, BOUML, Eclipse UML2 Tools, etc. and others are not, such as IBM Rational Rose, Enterprise Architect, Power AMC, Objecteering, etc.
![]()
Figure 16. HRT-HOOD model of the speed control subsystem.
3) Compositionality
UML version 2, provides the composite structure diagram which makes it possible to represent a system by its components, and to provide the internal structure of each component. This component-based model makes it possible to obtain step by step the hierarchical architecture of a system.
4) Notations dedicated to real time
UML, through some of its diagrams such as the diagram of sequences, of activities, of state transitions (temporal events) and of composite structures, allows somehow, to manage real time aspects. It is possible to perform temporal specifications on a sequence diagram, by specifying for example the time elapsed between two messages sent [36] . For example, offers the synthesis of a real-time UML design from sequences diagrams. The latest version of UML provides the timing diagram for the management of temporal aspects of a system.
5) Dependability
The notations provided by UML are not formal, but with the OCL language, it is possible to define on UML diagrams, constraints which will be formally checked.
6) Example of illustration
The different graphical notations used in the UML language are summarised by diagrams. In its second release, UML has 13 diagrams. The details on the latter are available in [37] . The components diagram is the one we use for the representation of the architecture of the “example system”. It makes it possible to show the components of the system into a physical view, as they are implemented to perform the functions of the system. The diagram uses the following concepts:
-Component: element of the system which specifies its interactions with the outside through the definition of its interfaces (provided or required);
-Port: point of interaction of the component. It is associated to an interface of operations (in provided or required mode);
-Connector: it is either of delegation type if it links a port of a component to a port of one of its subcomponents (one talks about composite component), or of type assembling if it links an interface of a component to that of another.
Figure 17 below shows a graphical representation of these concepts.
We use these concepts to represent the architecture of the speed controller, given by the diagram in Figure 18 below.
7) Strengths and weaknesses
UML is easy to handle and offers a wide range of diagrams for modelling almost all aspects and views of a system. The availability of a large number of free tools makes it accessible to all users. It is now used in the vast majority of companies developing software for the purpose not only of documentation and analysis, but increasingly for productive purposes (automatic or semi-automatic generation of code) or testing. In addition, UML takes into account new (graphical) notations of extended stereotypes, it requires less skill in language design and it reuses languages infrastructures (tools, specification).
UML has some limitations: 1) studies show that maintaining UML diagrams can be a complex process, 2) Although OCL allows to define constraints on UML diagrams, it lacks a formal definition of the concept of time and the degree of formal verification of its diagrams remains low, 3) the same things can be modelled from different perspectives, and all could be correct, which means it lacks a bit of consistency, 4) in UML we focus more on modelling the system rather than on the process of software development. This implies that UML should be used in a structure like USDP (Unified Software Development Process) created by the OMG and
![]()
Figure 17. Graphical representation of the concepts used in a UML component diagram.
![]()
Figure 18. Components diagram giving a simplified architecture of the speed controller.
COMET (Concurrent Object Modelling architectural design method) [35] or any other process of software development. In addition, there is a lack of standardisation between tools supporting UML and its versions, and this creates confusion in the modelling notations used according to the tool, because tool builders have created their own notations that differ from those of UML.
5.2.2. Unified Modelling Language-Real Time (UML-RT)
1) Presentation
UML-RT [2] [38] [39] is an extension of UML for modelling embedded reactive and real time software systems. It is a UML profile proposed as modelling language of such systems. It particularly focuses on the description of the system at the architectural level, the definition of the overall system structure. It defines new concepts for modelling systems such as capsules, and uses these concepts in UML collaboration diagrams to obtain a description of the architecture. UML-RT implements some ideas of HOOD, ROOM and MASCOT, and adds them to the classical (traditional) UML notations. We can cite for example the capsule diagram that incorporates children objects, similarly to the “Parent-child” object relationship of the HOOD method, as well as passive and active ports that already existed in ROOM.
2) Usability
As UML, UML-RT provides a graphical notation, but defines new concepts compared to UML; we have:
-Capsules: describe the complex components of the system that can interact with their environment. Their interaction with the environment is managed through ports. The ports are the only means of interaction with the environment. They are often associated with protocols that regulate the flow of information through a port. Ports can be public or private. Public ports must be located at the boundary of a capsule. The connectors are used to interconnect two or more ports of capsules and thus describe the communication relationships between capsules.
-Protocol: In UML-RT it is a set of signals sent and received along the connectors.
The explicit representation of the ports, protocols and connectors make possible the construction of architectural models from a collection of capsules. For the representation of the system architecture, a collaboration diagram of capsules is defined and describes the system components and how they are connected. To describe how the capsules react to messages received or sent through their ports, UML-RT uses the UML state diagram.
There are a few tools supporting UML-RT, such as RoseRT (RoseRT CASE tool). There is also for UML-RT, a runtime framework called TargetRTS (Target Run Time System) used as virtual machine supporting the execution model defined by UML-RT. It runs on top of a SE-RT (Real Time Operating System) to hide details specific to the provider of the runtime platform and to present a uniform API for the engineer designing the system.
3) Compositionality
The capsules can be hierarchically structured, by using a number of subcapsules which may themselves contain subcapsules.
4) Notations dedicated to real-time
UML-RT enriches the UML sequence diagram by adding timing requirements (the execution time of a sequence, the deadline, etc.), for example the rate at which the speed controller must perform its control loop [39] . Simultaneous state machines are modelled as separate capsules which communicate via asynchronous message passing buffer.
5) Dependability
UML-RT is a UML extension, so it naturally supports the OCL language, which allows to define formally verifiable constraints on a model.
6) Example of illustration
In UML-RT the different concepts are represented as follows:
-The capsule by a box labelled with the name of the capsule;
-The port by a small empty or full square on the edge of the capsule;
-The connector by a line between two ports.
Figure 19 and Figure 20 show respectively a representation of these concepts and their use in the example of the speed controller.
7) Strengths and weaknesses
In addition to the advantages of UML, UML-RT provides elements for modelling real-time aspects. In particular, it adds the concept of capsule which is a component that can interact with its environment. It also includes
![]()
Figure 19. Graphical representation of the capsules, ports and connectors in UML-RT.
![]()
Figure 20. Representation of the architecture of the speed controller in UML-RT.
all the modelling capabilities of ROOM. However UML-RT has some limitations: it is not widely used, there are very few tools supporting it, it lacks a precise semantics. Another disadvantage is that it is restricted to binary communication links between components.
5.2.3. AADL
1) Presentation: AADL version 2.0 standard
AADL (Architecture Analysis and Design Language) [40] [41] is an architecture description language developed in 2001 by Peter H. Feiler (SEI, CMU, Pittsbrugh, USA), Bruce A. Lewis (U.S. Army AMRDEC, Huntsville, USA) and Steve Vestal (Honeywell, Minneapolis, USA). It was designed for the modelling of RTE (Real Time Embedded) systems. It makes it possible to describe the hardware and software components of an architecture as well as their interactions. AADL is based on the MetaH language developed by Honeywell and the American Department of Defence for the DARPA (Defence Advanced Research Program Agency) project. It is based on the paradigm of component/connector/architecture while incorporating new aspects for a strong enrichment of the description of application architectures. Version 1.0 was standardised in November 2004 and version 2 in September 2008.
2) Usability
AADL is standardised by the SAE (Society of Automotive Engineers). It defines the architecture of the system as a set of interconnected components. The modelling of AADL components consists in describing interfaces, implementations and properties of the components. It has a graphical notation and a textual notation. There are tools that make it possible to obtain an XML notation of model from these notations, but also to go from a type of notation to another. AADL is extensible: it is possible to use other languages to define AADL annexes. Moreover, the standard provides annexes that make it possible to specify the behaviour of an application, to model data, to model errors and guidelines for code generation. Architectures definition is based on the components and the interactions between them.
There exists several tools [42] [43] supporting the AADL standard at different levels (modelling, analysis, scheduling). We can mention free tools such as Osate, Cheddar, Ocarina, Topcased, and commercialised tools such as: Stood, AADL inspector, Taste.
Osate provides AADL support for Eclipse. In the first version, Osate supports the first release of AADL. The second version is available since august 2011 and it supports AADL r2. Cheddar is a tool for real-time scheduling analysis which works typically with STOOD and AADL Inspector. Ocarina is able to load an AADL r1 or r2 project, to run analysis and to generate code from the model. Topcased is an environment for eclipse including a generator of graphical editor.
Concerning the commercialised tools, Stood, developed by the Ellidiss company, is used to model and design embedded software. It supports three graphical notations: HOOD, UML and AADL. AADL inspector is a light tool for AADL project analysis, it offers a set of analysis plug-ins which can be extended with external rule analysers. Taste is a set of tools dedicated to the development of embedded real-time systems. It is developed by the European Space Agency and partners of the spatial industry.
3) Compositionality
The AADL language allows the specification of sub-components or subcomponents tables contained in a component. Thus, we can describe hierarchical compositions of components1 or model a complete hierarchical system that is to say get a full view (in terms of structural view) of all instances that make up a system. To do this, AADL defines components and interactions between them.
In AADL, a component consists of two parts: an interface (component type) that defines the services provided and required through which other components can interact, and one or several implementations (component implementation) that specify the component internal structure. The AADL components are grouped into three main categories:
-Software components: Data (data structures), Subprogram and Subprogram group (code of subprogram and library), Thread and Thread Group (schedulable execution unit), Process (virtual address space);
-The components of the execution platform (hardware): Processor (schedule and execute a thread), Virtual Processor (virtual machine, for example), Memory (represents storage components), Bus and Virtual Bus (respectively communication channels and communication protocols), Device (entity external to the system);
-System components: System is the only component of the family and models a hierarchical assembly of software and hardware components.
The interactions between components are done by “features” (these are communications points) specified in their interfaces and “connections” specified in their implementations:
-The features: The AADL language defines three categories of features: port, parameter (parameters of subprograms) and subcomponent access. Ports are communication interfaces for exchanging data and events between components. They can be of three types: data port, event port and event data port. For each type of port, communication can be in (incoming), out (outgoing) or in out (incoming/outgoing). The concept of sub-program can be used for the representation of mechanisms such as locks to protect shared data.
-Connections: Connections in AADL are made in the connections section of the implementation part of the component (component implementation). The language allows to connect the components together by commu- nication points specified in their respective interfaces. There are four types of connections in AADL: port con- nections (type port), connections of parameters (type parameter), connections of access to shared components (type data access, bus access, subprogram access, virtual bus access) and connections of groups of features (type feature group). Other concepts are available in [44] and [45] .
4) Notations dedicated to real-time
5) Dependability
AADL makes it possible to formally define non-functional properties on models developed, which makes it possible to analysis tools to perform analysis of real-time scheduling, of performance, etc. Tools exist for the simulation of AADL models, for formal verification of system properties. AADL provides communication between components, giving the possibility to define the durations and analyse the rate of sending and receiving of messages in a model.
6) Example of illustration [11]
Figure 21 below shows the symbols of the graphic notation of AADL. There we find software components (first line in the figure), the components of the execution platform (second line) and the system component (third line).
Each of these symbols has an equivalent textual notation, which we present in the following, with the example of the speed control system below.
The context diagram of this example is given by Figure 22 below.
In this diagram, one represents the speed control system and the various external entities with which the system communicates. The connection points are groups of ports, represented on the scheme by a half circle associated with a point. They are used to represent a set of ports, which can be either data ports (input and/or output) or event ports (input and/or output).
For example, the graphical representation of the component Brake Pedal and the corresponding output data port is given by the following Figure 23:
The small triangle represents the data port, which is actually the component interface with the outside world. The textual AADL model for this graph is given by the following code:
![]()
![]()
Figure 21. Graphical notations of the different components of AADL.
![]()
Figure 22. AADL context diagram of the speed control system [11] .
![]()
Figure 23. AADL representation of the Brake pedal and its data port.
In this example, we declare a brake pedal device that has an output data port. The variable name of this port is brake_status, and the data type is Boolean. We also precise, with the reserved word flows, that this device is part of a flow specification, that it is a source of flow (flow source), that the variable for flow analysis is brake_status, and that the name of flow is Flow1. In order to perform the analysis of the latency through a flow, the property defining the latency time must be added to the flow attribute (for example, 10 ms). For a device (component), this value represents the latency between when the pedal is pressed and when the associated signal is available on the output port.
The block diagram of the problem of the speed controller can thus be represented in AADL as shown in Figure 24.
The corresponding textual declaration is given below:
![]()
We can now represent an implementation model based on: the declaration of the different types, how connections are made for a specific implementation and how the implementation of the flows can be specified to illustrate a complete flow analysis.
In AADL, a flow specification provides a flow visible from outside through the ports of a component, parameters or groups of ports. The declaration of an implementation of flow in a component implementation model shows how the flows are made: as a sequence of flow through sub-systems (sub-components) along connections from the flow specification of the input port to the flow specification of the output port.
The diagram (Figure 25) shows the representation formalism of connection flows.
In this picture, we have the implementation of a system (my_system.impl) constituted of two processes P1 and P2 that contribute to implement the specifications of flow F1. The direction (path) of flow F1 is specified in
![]()
Figure 24. Speed controller represented by an AADL “System” component [11] .
![]()
Figure 25. Generic representation of a flow implementation through a process.
the implementation section of the model in the following way F1: port_1- > C1- > p1.F5- > C2- > p2.F7- > C3- > port_3.
The AADL model of the speed control system with the connections between components is shown in Figure 26.
7) Strengths and weaknesses
One of the main weaknesses of AADL is that it does not provide elements to model clocks in the design of a system.
5.2.4. SysML
1) Presentation
SysML [46] [47] is a graphical modelling language developed by OMG (Object Management Group) in response (of industry) to the RFP (Request For Proposal) of UML for systems engineering. It is a UML profile representing a subset of that modelling language with some extensions. It supports the specification, analysis, design, verification and validation of systems that include hardware, software, data, personnel and procedures. It is a visual modelling language that provides semantics (meaning) and notation (representation of meaning).
2) Usability
SysML replaces UML classes by blocks for a vocabulary more suitable to Systems Engineering. A block encompasses any concept of software, hardware, data, process, and even of human resources management. SysML reuses a part of UML2, and also provides its own definitions. Therefore, it does not use the thirteen diagrams of UML2, but provides a set of diagrams suitable for Systems Engineering. SysML supports the exchange of data
![]()
Figure 26. A view of software components of the speed controller showing all connections between components [11] .
and models via XMI (XML Metadata Interchange).
For modelling a system, SysML provides a set of diagrams divided into 3 categories relative to the views of systems:
-Structural diagrams that describe the components of the product and its environment. Among these we have in particular the parametric diagram, which is a SysML extension for analysis of critical parameters of systems;
-Dynamic diagrams that model the behaviour of the system in response to its environment;
-The requirements diagram, which is a SysML extension.
The order of presentation of these diagrams does not define the methodology for modelling a system with SysML.
The SysML language is incorporated in some commercial software like Sparx Systems Enterprise Architect (SysML plugin), IBM Rational Software Modeler, MagicDraw (SysML plugin required) and open source software as TopCased (Eclipse), Papyrus, and OpenEmbeDD TTools. In the latest, the tool which analyses the SysML models combines simulation and formal verification, and it answers the need to detect design errors in the earlier phase of the system life cycle.
3) Compositionality
SysML provides diagrams for modelling various components of a system by a hierarchical decomposition approach. Thus, the block diagram is used to represent the system in different blocks composing it. The internal structure of each block can then be detailed, so as to present the sub-components which make up the block. This operation gives the hierarchical system architecture.
4) Notations dedicated to real-time
The subset of UML diagrams retained by SysML includes sequence diagrams and state transition diagrams, which allow to define temporal aspects of a system. In addition, the SysML’s parametric diagram that defines the parametric model of a system (various system parameters, with the rules and equations making it possible to have them), may contain temporal equations of the system.
5) Dependability
AVATAR language [48] can be used to enrich the design diagrams of SysML, especially to provide them with a formal semantics. This language is supported by TTool, which is interfaced with the UPPAAL [48] tool, with the aim of checking the logic and the temporality of SysML design models. Thus, a SysML model can be used for simulations and requirements analysis.
6) Example of illustration
One of the specificities of SysML compared to UML being its requirements diagram, we will focus on that aspect. In the requirements diagram, one specifies, prioritize and document requirements, i.e. the expectations relating to the system or to its behaviour. So, in this diagram, one will put a text which specifies all sorts of encrypted features, technological choices imposed, the compliance with the standards, etc. Figure 27 below shows the graphical notation of a requirement.
A definition of the requirements of the speed control system is given in Figure 28 below.
In this diagram, we define two requirements REQ_CCS_01 and REQ_CCS_04, and we precise that the speed control system must satisfy those requirements (the “satisfy” dependency). The dependency “refine” of UML is used to indicate that an element of a SysML model is a refinement (more accurate) of a textual requirement. The dependency “verify” as for it shows the link between a test case and the requirements it must satisfy.
Figure 29 as for it provides a block definition diagram of a vehicle showing the speed controller, which is one of its components.
The speed control system which is a component of a more complex system (the vehicle), can be divided into its various components showing the properties of each subsystem, each with its input/output ports.
Figure 30 shows the block diagram of the speed control system. This block diagram shows the components of the speed control system, each with a number of ports of flow of information that describe what can enter and exit from the component.
7) Strengths and weaknesses
SysML offers the advantage of being accessible to software developers that will find many similarities with
![]()
Figure 27. A representation of a requirement.
![]()
Figure 28. Diagram of requirements of the speed control system [49] .
![]()
Figure 29. Block definition diagram of a vehicle containing the control speed system.
![]()
Figure 30. Block diagram of the internal speed control system.
UML2. SysML can produce specifications in a single language for heterogeneous teams, responsible for the implementation of hardware and software blocks. Knowledge is thus modelled in a single repository that improves communication among the participating teams, is open to all and allows the reuse of the blocks built. A peculiarity of SysML is to regroup the three views of a system (structural, functional and behavioural) in a single multi- viewpoints model. The use of a single model has two significant advantages:
-This ensures consistency of data as SysML rules give each model element a single definition, built by gathering information from its different representations, and forbid them to contradict. This also reduces the risk of errors;
-It facilitates the use of simulation as a SysML model can assemble all the information needed to model the system, to simulate its behaviour and to compare the results with the requirements in order to validate (or not) solutions.
SysML has weaknesses:
The genericity of some concepts, such as block is a source of misunderstanding and needs to be quickly clarified when modelling. SysML can be seen as a high-level language for the analysis and design of complex systems to some granularity, but that is not sufficient for the complete development of a system. Indeed, at a certain stage of modelling, we are faced with diagrams on which hardware and software were identified, and which must be completely specified, but SysML does not make it possible.
5.2.5. MARTE
1) Presentation
MARTE [50] - [52] is a UML profile aimed at the use of model-driven approach for the development of real-time and embedded systems (RTES). It consists in defining basics for describing model-based, real-time and embedded systems. These basic concepts are then refined for modelling and analysing different aspects of the system. The modelling parts provide supports required from the specification to the detailed design of real-time and embedded systems aspects. MARTE is also interested in the model based analysis. In this regards, the intention is not to define new analysis techniques for real-time and embedded systems, but to support them. Thus, it provides facilities to annotate models with information required to carry out a specific analysis. MARTE focuses mainly on the performance and analysis of scheduling. It also defines a general Framework for quantitative analysis which aims at refining/specialising any kind of analysis.
2) Usability
MARTE provides support for the stages of specification, design and verification/validation. It provides graphical representations and textual notations. This semi formal language is intended to be sufficiently accurate to be exploited automatically by software for analysis, code generation, testing or documentation. Thereby it fits completely in a model driven engineering process. MARTE is structured around two main concerns:
-Firstly, the modelling of the characteristics of real-time and embedded systems;
-Secondly, the annotation of application models to analyse the properties of the system model.
It is composed of 14 sub profiles grouped into 4 packages, each dealing with one aspect of the system:
-The package MARTE foundations which includes the general concepts necessary to the above-mentioned concerns. It includes, as sub profiles, CoreElement, NFP, GRM and Alloc profiles;
-The package MARTE design model bringing together sub-profiles dedicated to the design, namely GCM, HLAM and DRM;
-The package MARTE analysis model combining the sub-profiles dedicated to the analysis which are GQAM, SAM and PAM;
-The package MARTE Annexes gathering the utilities or transverse sub-profiles and template library.
MARTE is a relatively young standard, and therefore the number of tools supporting it remains low, but is intended to increase rapidly in the coming years. There are UML modelers that currently support profile MARTE:
-Papyrus: it is free and is part of the Eclipse project. It provides the reference implementation of MARTE;
-RSA (Rational Software Architect): it is marketed by IBM. It supports MARTE through one profile provided under a free Eclipse license by Thales Research Technology;
-MagicDraw marketed by NoMagic;
-OpenEmbeDD: it is a generic platform based on Model Driven Engineering (MDE) technologies, and integrating tools for help in the design of embedded real-time applications. The MDE technologies used in OpenEmbeDD are based on the Eclipse environment.
3) Compositionality
The design of the whole system is modular. Based on his needs, the user can select a particular subset of the 14 sub-profiles of MARTE. MARTE has a component model that makes it possible to define the various components of a system, their interactions (connection between components) and to specify the types and elements they exchange. This allows to define an (hierarchical) architecture of the system.
4) Notations dedicated to real-time
The sub-profile NFP (Non Functional Properties) and its specialization Time are one of the major contribu- tions of MARTE. They allow the description of non-functional system properties (qualitative or quantitative) with in particular a refinement for the annotation of temporal properties of real-time systems. The sub-profile HLAM (High Level Application Modelling) provides concepts for modelling both quantitative (period, time) and qualitative (behaviour, communication, concurrency) characteristics of real-time systems. The central concept proposed here is that of real-time unit (RtUnit) that encapsulates an autonomous processing resource and is the central concept for concurrency management. In the development of real-time systems, it is crucial to be able to analyze the possibilities of real-time scheduling of these systems. Thus, the SAM package (Scheduling Analysis Model) provides annotations dedicated to this schedulability analysis. The package PAM (Performance Analysis Model) is particularly dedicated to the analysis of temporal performance of soft real-time systems.
5) Dependability
Models produced with MARTE are usually annotated. Indeed MARTE makes it possible to define non- functional properties (NFP: Non Functional Properties) of systems, thus making the models a bit more formal. These NFP provide to the models the information necessary to perform specific analysis. So, a MARTE model will be able to support performance and scheduling analysis. But MARTE also defines a general Framework for quantitative analysis which aims to refine/specialise any other kind of analysis. Moreover MARTE offers packages for the annotation (SAM) and analysis (WFP) of models.
6) Example of illustration
Figure 31 below shows the general architecture of the 14 sub profiles of MARTE.
As UML profile, MARTE is based on the concept of stereotype, to represent the different elements of a model. Figure 32 provides a representation of the flow specification, which defines the interface elements on a given port.
In Figure 32, we define a UML interface called SpeedSensorFS. This interface represents a MARTE flow specification, which is of type input/output (defined here by the attribute “direction” of the flow specification). SpeedSensorFS has two properties (defined here by the stereotype flowProperty): the first one named cSpeed is a flow output and is of type SpeedDT, the second one named cTime is a flow input of type Time.
![]()
Figure 31. Overall architecture of MARTE [50] .
![]()
Figure 32. Definition of the structure of a port interface [53] .
FlowSpecification is part of the sub profile GCM (Generic Component Model) of the package “MARTE design model”. It is the sub profile which makes it possible to model system’s architecture as well as exchanges between its components. So it is relevant here.
Note in Figure 32 that the port interfaces must be defined before being used in an architectural model.
Figure 33 shows the different interfaces defined for modelling the speed control system. We have grouped them in a package called “VehicleInterface”.
These interfaces can therefore be used in the system’s architecture model to define the input and output elements of the different ports. Figure 34 shows the architecture of the vehicle containing the speed control system.
The speed control system, in turn, can be decomposed, which gives us the model of Figure 35, which shows the software architecture of the speed controller.
7) Strengths and weaknesses
MARTE is a UML profile, and as such benefits from the advantages offered by UML profiles.
In addition to benefits common to UML profiles, MARTE has specific advantages. Among others:
-It provides a common way to model the software and hardware aspects of an Embedded Real Time System to improve communication between developers;
-It enables interoperability between development tools used for the specification, design, verification and code generation.
However, MARTE has some limitations.
MARTE is constrained by the UML meta-model. In MARTE, the concept of time is very ambiguous [50] and each domain can have its own modelling and interpretation of time.
6. Benchmarking Approaches
6.1. Comparative Tables
In this sub-section, we present comparative tables making it possible to classify approaches according to criteria defined in Section 2. This tabular presentation provides a major advantage for users in the domain, for the choice of an approach for their needs. Indeed, the analysis of each table shows which approach is the right one for a particular purpose, according to the score in the criteria which are important for the user. In the same logic, for each table, we provide a graph (2D histogram) for more clarity. We present six tables with scores of approaches on: 1) Usability 2) compositionality, 3) the real-time aspects, 4) dependability, 5) codesign and 6) the whole of the 5 criteria. Each table provides scores to the elements taken into account in the criteria, followed by a chart that provides an overview of each approach with respect to the criterion considered. The numbers displayed on the graphs (Figures 36-40) are obtained by summing the scores of items that are considered in the evaluation of a given criterion, and which are detailed in the table preceding the graph. An empty row in the table divides the methods (above the line) and the languages (under the line).
6.2. Comment on Comparing
Tables 1-5 were constructed by assuming that the elements that enter into the evaluation of a criterion (e.g. for Usability criterion: ease of use, clarity of diagrams, notations available, availability of tools) have the same weight. Similarly, for the overall scores given in Table 6, we assumed that the five criteria (usability, compositionality, real-time aspects, dependability and codesign capacity) have the same weight. However, depending on
![]()
Figure 33. Interfaces for modelling the control system of the vehicle.
![]()
Figure 34. Candidate architecture of vehicle showing its components.
![]()
Figure 35. Software architecture of the speed control system with MARTE.
the application, one can assign different weights to the criteria in order to take into account the relative importance of each criterion. Table 6 gives the overall score of the studied languages and methods across all considered criteria comparison. We note that according to these criteria, recent languages such as UML-MARTE, AADL and SysML are best classified; but also the HOOD method. Note, however, that in considering the criteria individually, rankings change. Thus, some methods such as DARTS, ADARTS, CODARTS and MASCOT are less easy to use than languages like UML, UML-RT, SysML; but are well provided with respect to elements linked to real time. We also note that only some (YSM, HOOD, AADL, MARTE) of these approaches allow the co-design.
7. Conclusion and Perspectives
This paper presents different approaches for analyzing and designing real-time and embedded systems, in order to guide the designers of these systems, for the choice of approach to use, according to their needs and aspects to model. A survey of the current methods and languages is done from which was proposed a set of objective elements for their evaluation. For each approach, the features offered for the following aspects have been presented: usability, associated tools, compositionality, real time, dependability. Comparative tables and graphs have been proposed showing the relative position of each approach with respect to the others. The approaches were first compared on four criteria separately (usability, compositionality, real time and dependability), before being evaluated on the basis of a combination of criteria. The combination has been done with the assignment of identical weights to different criteria. However, the adoption of different weights is possible to take into account the relative importance of each criterion.
In this work are also presented the notations and concepts offered by the approaches to model a system and illustrated their use through an example, in order to enable readers to assess the degree of coverage of each criterion for each approach and to understand the score given for each criterion. This work shows that in general, methods and languages do not cover all the phases (and aspects) of the development of embedded and real time systems. This is reflected in the comparison tables, by the variation of marks obtained by each approach according to the criterion. Special mention is made, to languages such as UML, SysML, UML-MARTE and AADL, which offer notations and diagrams for most of the phases of the RTES development cycle, and also to the HOOD
![]()
Figure 37. Graphic of compositionality criterion.
![]()
Figure 38. Graphic of real-time aspects criterion.
![]()
Figure 39. Graphic of dependability criterion.
method which, in addition to being object-oriented, defines a fairly standard development life cycle. One of the main perspectives of this work is therefore to take advantage of the features offered by these four languages in the development cycle, to combine them and to propose a process based on these languages and on existing methods such as HOOD, to cover effectively the whole RTES development cycle.
NOTES
![]()
1Composite components: composed of sub-components.