Developing Ecosystem Maps Using Eco-Geological Information for the Sustainable Management of Natural Resources ()
Received 24 March 2016; accepted 15 May 2016; published 18 May 2016

1. Introduction
Ecosystems are self-organized but distinct from one another by the structural, compositional, and functional diversities of their ecological attributes [1] . Moreover, different facets of ecological systems, such as the geological, soil and biotic assemblages, organize the ecosystem [2] . Organisms interact with the physical environment in a typical ecosystem, and the flow of energy and materials provide an equilibrium condition suitable for biotic composition and their existence [3] [4] . Therefore, ecosystem mapping is the key to representing and analyzing the ecological patterns and processes in a region; enabling the use of the ecosystem elements for a wide variety of applications, including conservation planning, climate change scenarios and their adaptation and mitigation, natural resources management, and analyses of the economic values of ecosystem benefits [5] [6] and services [7] - [9] . Ecosystems are geospatially delineated as elements of the landscapes and generated through biophysical stratification of lithosphere, landforms, surface moisture, and land cover [2] .
There is much debate regarding how the boundary of an ecosystem can be delineated or drawn? Varying from the entire biosphere to a small piece of land because of their definition depending on the scale of analysis [10] [11] . This system is rather related to the biotic and abiotic components and greatly depends on the management, research or application strategy. Practically, various types and sizes of ecosystems have been classified, ranging from large, coarse-scale ecosystems or ecoregions [12] - [16] to a fine-scale environment that supports particular biotic assemblages [17] [18] .
However, the vital step to delineate a regional ecosystem focuses the broader abiotic landscape and defines patterns in the physical environment particularly, the geology and the landform. The resulting classification units are termed as “land zones, ecoregions or landscape types”, which are similar to landscape classification units [19] . The combination of the attributes of geology, soil, elevation and vegetation is used to define regional ecosystems in order to provide a useful classification for biodiversity conservation [6] [20] [21] (see also www.epa.qld.gov.au/REMAP). Since, a land-use/land-cover (LULC) model is not enough to delineate the types of ecosystems which are unable to consider the types of geology, lithosphere or nutrient types. LULC model solely considers the surface components of the vegetation. However, such spatial delineations of different ecological footprints are difficult tasks because ecosystems are inherently complex and diverse in both spatial and temporal variations. In fact, recent attempts have involved the conservation of ecosystems with regard to both the biodiversity and ecosystem goods and services [22] [23] .
Therefore, it is important to identify and delineate the diversity of ecosystem types and their distributions, particularly at the landscape and regional scales. Moreover, many decisions and work plans in the last decade have been initiated to conserve the valuable biodiversity from the increasing threats of degradation at the regional scale [14] . Considering this fact, the Convention on Biological Diversity [24] emphasizes the ecosystem- based approach for the sustainable management of valuable natural resources (e.g., water, forests, wildlife). Regions like Malaysia, which have been experiencing an increasing pressure from anthropogenic activities [25] , need an urgent initiative to save its natural resources from further destruction. To design a comprehensive management criteria for monitoring ecological processes and for a systematic conservation planning, and representativeness [26] - [28] , a comprehensive set of data and map of the distribution of the ecosystems in the region are required, particularly with regard to the delineation of different ecosystem types based on soil, geology, elevation, hydrology, vegetation, and landform.
Therefore, the objective of this study is to develop an ecosystem map of the State of Selangor using different eco-geological components, including geology, soil, elevation, and land use, for the sustainable planning of the natural resources at a variety of scales, from site, landscape to the regional scales.
2. Study Area
The State of Selangor (latitude 2˚35'N-3˚60'N and longitude 100˚45'E-102˚00'E) is a highly developed and populated State in Malaysia (Figure 1), with an area of approximately 800,000 ha. The country’s capital, Kuala
![]()
Figure 1. Geographic location of the State of Selangor, Peninsular Malaysia.
Lumpur, and the federal administrative capital, Putrajaya, are federal territories but are situated within Selangor. Selangor’s climate typically consists of warm, sunny days and cool nights all year with occasional rain. The temperatures range from 23˚C to 30˚C, the humidity usually exceeds 80%, and the annual rainfall is 2,670 mm. We considered the State of Selangor and also the federal territories of Kuala Lumpur and Putrajaya together as the study area because the federal territories are situated within the boundary of this state. Selangor is rich in different types of ecosystems, both terrestrial and aquatic and is also rich in geological, mountainous, coastal, wetlands and vegetation diversity. Granite is prevailing in the area and the major component of quartz [29] . The lowland soil is composed of strongly weathered ferralitic soils, whereas yellow podzolic soils, acid brown forest soils or podzols are found in the mountain areas. The lowland soils are comparatively richer in nutrients than the highland area due to the higher concentration of litter in the lowland area [30] . Selangor’s geographical position in the centre of Peninsular Malaysia has contributed to the State’s rapid development as Malaysia’s transportation and industrial hub. Selangor has a population of approximately 5.46 million [31] . In addition to industry, commercial agriculture is a thriving sector of Selangor’s economy, and a major part of the land-use classes are included in this sector. Moreover, the state is also home to the largest port in the country.
3. Materials and Methods
3.1. Land-Use Mapping
3.2. Ecosystem Mapping
3.3. Sequence of Overlaying Processes for Defining Ecosystems
3.3.1. Combining Geology and Soil Layers
Vegetation communities in a bioregion are consistently associated with a particular combination of geology, landform and soil. Rocks are the parent materials of soil; therefore, the distribution of key soil producing rocks is vital for defining ecosystems [12] . Granite, quartz and peat are important minerals that have an influence on soil fertility and texture, in turn, they are important factors for the formation of vegetation and the habitat of many animals [29] . Therefore, the geological properties producing these minerals were given preference in delineating the ecosystems of the study region. On the other hand, organic peat, alluvial, and coastal soil were accounted for their importance in defining ecosystems in this region. The proportion and extent of the geology and soil properties may vary from site to site according to their importance and role in the ecological systems of that particular region. Furthermore, the use of such broad-scale surrogates is suitable in areas such as Peninsular Malaysia, where much of the natural land has been transformed by agriculture [30] . Following this principle, on the first step of the data layer processing, we combined the geology and soil layers through a union overlay method in ArcGIS 9.3.
![]()
Table 1. Land-use classes, their description and their proportions in 2005 in the State of Selangor, Peninsular Malaysia.
![]()
Figure 2. Reclassified (a) vegetation zones (elevation classes reclassified according to the Symington (1974) [38] vegetation classification described in Table 2), (b) geology and (c) soil maps of the State of Selangor, Peninsular Malaysia (CS = coastal soil, LHG = low humicgley, LS = laterite soil, LtS = lithosols, OS = organic soil, RYL-PS = red-yellow podzolic soil). These maps, along with land-use map (Figure 3), were used to develop ecosystem map of the study region.
3.3.2. Overlaying Vegetation Layer on Geo-Soil Layer
Malaysian ecosystems are mainly defined by altitude because of its influence on temperature and rainfall [29] [38] ; therefore, altitudinal gradients were taken into account and broken into several elevation classes (see Appendix 1). Eventually, on the second step, a vegetation layer of the State of Selangor was overlaid on the geo-soil union layer. After the process, 18 categories of the land surface were delineated and named according to the attributes of the geo-soil and vegetation layers. For example, if the lowland dipterocarp was overlaid on the alluvial attribute of the geo-soil layer, the new attribute of the land surface is called lowland dipterocarp alluvial.
3.3.3. Overlaying Land Cover Layer on Geo-Soil-Vegetation Layer
The spatial union of different data layers generates a combined layer which accumulates different interrelated themes into the same building block. Therefore, a unit area of the combined data map may have the ecological
![]()
Figure 3. Land-use map of 2005 of the State of Selangor, Peninsular Malaysia.
features of geological, lithological and vegetation cover. In this step, the land cover data layer was then overlaid on the ecosystem stand to delineate existing ecosystem types. In this case, we considered forest and mangrove land cover types as the forest layer. Also, while overlaid on the geo-soil-vegetation layer, the actual natural
![]()
Figure 4. A flow chart showing the different stages and chronology of the ecosystem mapping methodology.
forest ecosystems were delineated.
4. Results
The results revealed that the State of Selangor is composed of 19.1% built-up area, 38.9% commercial agriculture, 31.3% forest (other than mangrove), 2.6% mangrove forest, 4.9% paddy and other agriculture, 1.2% water body and 2% cleared land area in 2005 (Table 1). Figure 3 represents the land-use map of the study area for 2005. A rapid development occurred due to human settlement in the State and anthropogenic activities that triggered the main pressures to the natural ecosystems. The overall accuracy of the supervised classification of the satellite images was 84.7%, and the kappa statistics was 0.81 (for detail see Appendix 2).
Ecosystem maps revealed that the State of Selangor includes as many as 19 different natural ecosystems (Figure 5; see Table 2). The distribution of the major dominant plants and the major plant groups among the various floristic zones are documented in Table 2. The ecosystem map showed that the natural ecosystems correspond to approximately 35% (285,034 ha) of the total extent of the study area (822,880 ha) and modified ecosystems accounted for the remaining 65% (480,307 ha) of the area (Table 2). The ecosystem map featured a clear indication of human influence on the region through the intensive commercial agriculture and built-up area, which together encompass 2/3 of the total land area.
Among the natural ecosystems, the peat-swamp forests comprise the highest amount of land area (9.9%), followed by the hill dipterocarp quartz forests (6.4%), and lowland dipterocarp quartz forests (4.6%); other types of natural ecosystems, e.g., the lowland dipterocarp, upper dipterocarp quartz, and mangrove forests corresponded to between 2% and 3% of the total land area (Table 2). In contrast, the lowland alluvial, limestone, hill dipterocarp, hill dipterocarp sandstone, upper dipterocarp, upper dipterocarp sandstone, oak-laurel, oak-laurel quartz, oak-laurel sandstone, and montane forests encompass less than one per cent of the total land area in the study region.
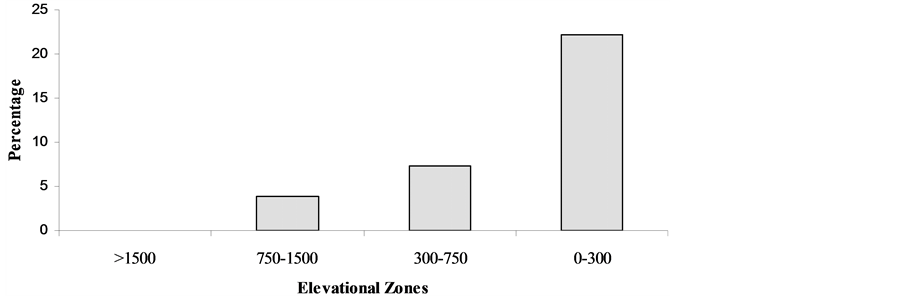
Overall, the forested area including mangrove forests, represents approximately 33.4% (275,196 ha) of the total land in the study area. The forests within the elevation class 0 - 300 masl (meter above sea level) cover an area of approximately 182,958 ha; different types of lowland, peat-swamp, and mangrove forests are included within this elevation class. The forested areas within the elevation level of 300 - 750 masl cover approximately 59,465 ha in 2005. These two elevation classes are also considered as the lowland zone, and all of the types of forest in the lowland zone together correspond to 88% (242,422 ha) of the forested area in the study region (see Appendix 3).
The lower montane zone, which is situated within the elevation 750 - 1500 masl covers an area of 31,947 ha, whereas the upper montane zone situated at above 1500 masl covers only approximately 827 ha.
5. Discussion
The rapid and extensive destruction of habitats and biodiversity, particularly in the tropical belt, has increased at an unprecedented rate [39] - [42] and has forced world leaders to make the decision to conserve the valuable biodiversity in all types of habitats and ecosystems [43] . Although a satisfactory achievement of the initial target
![]()
Figure 5. Ecosystem map of the State of Selangor, Peninsular Malaysia, representing different ecosystems, both natural and modified.
level has been made thus far, many valuable ecosystems still need to be protected [44] , raising a question regarding the conservation target of “how much is enough?” [45] [46] , and it is unclear how much effort is required to meet the conservation target. To address such questions, the Conference of the Parties of the Convention on Biological Diversity States that “at least 10% of the world’s forest types” should be conserved effectively [47] . This means that, in addition to a general target of protecting forested areas, for example, the 2010 protocol recommended a total level of 18% forested area to be protected, it is now also important to consider the different
![]()
Table 2. Ecosystem types and their proportion in the State of Selangor, Peninsular Malaysia.
types of forest ecosystems to be protected. Within this context and to prioritize the conservation planning and save the world’s valuable biodiversity and ecosystems from further destruction, the delineation of different types of ecosystems using such identification and delineation methods may contribute significantly.
Land-use information is vital for landscape assessment, monitoring changes, climate change factors, and conservation planning [48] [49] . Moreover, such information is important for the spatial delineation of the vegetation and habitat types in a region [14] [21] . The land-use map of the study area indicates that the area has been highly impacted by the anthropogenic development activities. Many of the natural ecosystems have become isolated and have lost their integrity within the patch-mosaic matrix of the region. The proportion of the built-up area (19.1%) in 2005 is comparatively much higher than that of a previous study (~4% in 1995) of this region [50] [51] , showing a dramatic increase to approximately 15% of the total land area. This change could be related to the development policy that has promoted industrialization, thus increasing human settlement in Selangor, for example, the expansion of housing estates, town areas, and transportation highways [50] [52] .
It is important to mention that researchers from different parts of the world have been using different ecological attributes in developing ecosystem maps of their region of interest. For example, Powell et al. [13] used life zones for Costa Rica, and Scott et al. [26] used a combination of elevation and soil data to delineate ecosystem types in USA. English Nature has mapped England’s natural areas based on geology and biodiversity [53] . In the present study, we used a combination of the Powell et al. [13] , Scott et al. [26] and Oldfield et al. [53] approaches to develop our ecosystem map. The land-use map of the State of Selangor for 2005 developed in this study was used as an important data layer along with geological, soil and elevation data layers. Granite, quartz, and peat are important minerals and influence the soil fertility and texture, in turn; these factors are important for the formation of vegetation and the habitat of many animals [29] . Therefore, these minerals were given preference in delineating the ecosystems in this study region. Moreover, in addition to the land-use and soil data, geological and elevation data are important biodiversity surrogates, particularly at the broad spatial scale [54] . Furthermore, the use of such broad-scale surrogates is suitable in those areas where much of the natural land has been transformed by agriculture [55] . The proportion and extent of the geological and soil properties may vary from site to site according to their importance and role in the ecological systems of that particular region.
The results show that there are nineteen different types of ecosystems existing in this region, which is quite diverse in its eco-geological nature. These diverse ecosystems include terrestrial, aquatic, lowland, swamp, mangrove, hill and montane, quartz, limestone, sandstone, peat and alluvial ecosystems. Previously, Nakashizuka et al. [56] classified Selangor’s forests into four altitudinal zones, including lowland forest (0 - 700 masl), transition forest (700 - 1100 masl), montane forest (1100 - 1500 masl), and upper montane forest (forest stand at higher than 1500 masl). This classification was based on the formation [29] [57] [58] and on the floristic characteristics of the forests in Peninsular Malaysia [38] . The results of our study have a significant relationship with the above mentioned classifications; however, we also include geology and soil information in our classification. Here, we classified the upper dipterocarp and hill dipterocarp forest zones of the transitional zone of the lower and montane forest [56] .
Through the comparison of our findings with previous works (as reported, the landscape pattern and fragmentation analysis by Abdullah and Nakagoshi [50] [51] ), it is clear that, in general, the transformation of the natural ecosystems into modified ecosystems occurred in the study area at a faster rate within the last few decades. Among the different ecosystems, the lowland area experienced most destruction. More specifically, the lowland dipterocarp forests, peat-swamp forests, and mangrove forests have been converted into modified ecosystems at a faster rate compared to the other forest ecosystems [51] . This might be due to the accessibility [59] [60] and the poor general perception regarding the importance of these ecosystems. However, the lowland area representing approximately 90% of the forests that are distributed below 750 masl, experienced more disturbance than the other highland zones, such as the lower montane and upper montane zones. The forests in this zone required protection through a protected area system to safeguard the valuable flora and fauna from further destruction.
In general, an ecosystem map is composed of both temporally rigid and changing components of the geological and ecological attributes. For example, the topography, landforms, and lithology are the physical components of ecosystems that are not expected to change abruptly over time. However, climatic occurrences and land uses are likely to change temporally faster than the others, and the degree of change depends on the anthropogenic activities. When new land-use and climate data become available, an updated version of the ecosystem map can be restructured/redrawn using the same methodology; it is also possible to remodel the previous features of the ecosystems in case they are important, as remote sensing data for the same cover may be available for certain earlier periods. Therefore, ecosystem maps from different dates can be used to analyze the impact of human activities and climatic changes over the ecological distribution and biodiversity as a whole.
6. Conclusions
The development of an integrated ecosystem mapping is being experimented for the first time in this region through the latest technology and integrating as many possible eco-geological attributes, including geology, soil, elevation, vegetation, and land-use data. Previously, vegetation classifications have been done by some researchers [38] [56] [61] , which are addressed in this mapping methodology. In addition to that, the newly delineated ecosystems may provide necessary information to the land managers, policy makers, and researchers involved in the biodiversity conservation and sustainable management of natural resources. The strengths and weaknesses of this approach can be evaluated through the utilization of this map for sustainable management practices, and further study is required to improve the map.
In particular, this type of ecosystem map can be used to evaluate the ecological integrity of a given region. Besides, such ecosystem maps have potentials for evaluating a variety of ecological and conservation aspects, for example, representativeness of the ecosystems, forest fragmentation, habitat suitability of wildlife and landscape connectivity [62] . Forest fragmentation, representativeness, vulnerability of the protected area system of this region can be quantified and visualize through overlaying protected area data layer on this type of ecosystem map (see the methods described in [63] [64] ). Critical ecosystems can also be identified and delineated from such maps following the methodology of Sierra et al. [65] in order to protect critical and vulnerable ecosystems from further degradation. Similarly, the effects of climate change on the ecosystems can be evaluated through following the methodology used by Wiens et al. [66] .
Furthermore, it also has potential use for the evaluation of wildlife distribution, their conservation status, and conservation planning of this region [67] [68] . A habitat suitability model can also be developed using this ecosystem-based map [69] [70] . To measure ecosystem goods and services of this region, this ecosystem map can be the basis for evaluating many ecosystem services, for example, erosion control, salinity control, flood control, disaster prevention, primary production, biological control, nutrient cycling, carbon sequestration, energy flow, eco-tourism, and water regulation [71] . This map is also useful to identify the key biodiversity areas for systematic conservation planning in the landscape to the regional level, as framed by Brooks et al. [72] . In addition to the many such ecological and environmental approaches, such ecosystem maps are particularly important for the sustainable management of the natural resources at the site scales to the broad spatial scales.
Acknowledgements
We acknowledge the Ministry of Science Technology and Innovation, Malaysia for funding this research through the Science Fund 04-01-02-SF0378. The authors also thank the Universiti Kebangsaan Malaysia for financial assistance through the research fund GUP-2014-042 and DLP-2014-015.
Appendices
Appendix 1. Vegetation zones and major plants and plant groups in Peninsular Malaysia (see the vegetation classification by [29] - [31] ).
Appendix 2. Results of accuracy assessment of land use classification.
Overall accuracy (%) = 84.77, Kappa statistics = 0.84.
Appendix 3. Proportion of the forests in the different elevation zones. The forest stands at the 0 - 300 masl are lowland forests, and those at 300 - 750 masl are hill forest; the forests at 750 - 1500 masl are recognized as lower montane forests and are upper montane forests above 1500 masl.
NOTES

*Corresponding author.