New Robust Energy Management Model for Interconnected Power Networks Using Petri Nets Approach ()
Received 21 December 2015; accepted 26 January 2016; published 29 January 2016

1. Introduction
“The world is at a critical crossroad”, the temperature of the land and ocean surfaces has increased globally by almost 1˚C (from the early 20th century) and in parts of Africa, Asia, north and South America, the increase is up to 2.5˚C. We are moving towards a warming of 5˚C - 6˚C if nothing is done [1] . Carbon emissions from energy use dominate the total greenhouse gas emissions of most countries. One of the major challenges of the energy transition is the integration and management of a large volume of renewable sources of energy in the economic system and the electrical network. Indeed, renewable energy is growing at a rapid pace in the world and is becoming an important segment of the energy industry. Inserting an ever larger share of renewable energy in the energy mix poses new challenges compared to traditional energy sources [2] .
With an abundant potential still underexploited, photovoltaic and wind energy are advantageous economically and environmentally. However, they have a common weakness: their dependence on climatic hazard. It makes necessary to rethink the structure of electrical networks and energy markets, as well as changes in network management methods. There are several studies on optimal energy management and control models, within the framework of environmental and economic issues. Most of these studies are directed to microgrids [3] . We can classify control techniques applied to the energy management and control of microgrids by their problem formulation (sometime their cost function objective) and optimization methods used to resolve it [4] . For example, Tazvinga et al. [5] present an optimal energy management model of a solar photovoltaic-diesel-battery hybrid power supply system. The model proposed minimizes both fuel costs and battery wear costs, and finds the optimal power flow taking into account photovoltaic power availability, battery bank state of charge and load power demand. Kriett and Salani propose [6] a generic mixed integer linear programming model to minimize the operating cost of a residential microgrid. Sortomme and El-Sharkawi [7] model the load and generation of two microgrids with wind farms to implement optimal power flow using particle swarm optimization on a system of two microgrids for a 48 hour period. It was shown that, the costs could be reduced by 14% and the system load peaks could be shaved by over 10 MW. Riffonneau et al. [8] propose an optimal power flow management with predictions. Lagorse et al. [9] proposed in their work a distributed energy management solution by multi-agent systems means as an application for hybrid energy sources.
In addition to the deregulation of the electricity market which has as general goals: to reduce the government involvement in the electricity supply sector, to introduce competition in electricity generation and selling, and to increase the demand side participation [10] ; and the high cost of storage means, users (local authorities for example) may have their own sources of renewable energy and sell their excess production instead of storing it.
In the case of France, due to rapid industrialization and high population growth rate, energy consumption is rising exponentially, in recent years. Thereby French government is making a steady change towards energy efficiency and alternative sources of energy. Several declarations have been issued in recent years emphasizing concerns and commitment of regional powers to achieve sustainable development. Energy Strategy 2030 introduced by European Union aims to reduce the domestic 2030 greenhouse gas at least 40% compared to 1990. This 2030 policy framework aims to make the European Union’s economy and energy system more competitive, secure and sustainable and also sets a target of at least 24% for renewable energy and energy savings by 2030 [11] . This is an attractive driver for European countries to adopt solutions that reduce overall energy consumption. In the same spirit, considering the rapid rise in power demand in the country, French government are now looking to diversify their energy mix from their primary energy source to a greater reliance on renewable energy. French energy efficiency ranking is expected to get a major boost due to the development of large renewable energy projects in their different regions. It is in this context that the law on the energy transition has recently been adopted by the French parliament [12] . Whence, the efficiency of energy production and management patterns requires improvement.
Many regions in France have set dynamic strategic direction to achieve immediate reduction in carbon emissions. The interconnection between these regions can contribute to the improvement of energy efficiency, environmental protection and a better economic balance. It’s an asset for the global energy future. However, the development and operation of such systems involve many challenges. One of them is to ensure good energy management between regions which must be able to share instantly power flow, as well as between regions and the national network. Therefore, a management system is necessary. On the other hand, the complementarity that has the photovoltaic and wind in daily energy output leads to a solution that will not require storage. That is hybrid system connected to the national network without storage [13] . Yamegueu et al. [14] present an experimental study of a PV/diesel hybrid system without storage by taking four different daily constant loads to simulate its behavior. It has been verified through this study that the functioning of a PV/diesel hybrid system is efficient for higher loads and higher solar radiations. Such a system has a great advantage, because it significantly reduces the initial cost of a traditional hybrid system provides with a storage device. Modelling of such a system is achieved by modelling the components that constitute its [14] . Ai et al [15] presented complete set of match calculation methods for optimum sizing of PV/wind hybrid system by developing a set of match calculation programs with adopting the more practical mathematical models for characterizing components of the system. Diaf et al. [16] presents a methodology to perform the optimal sizing of an autonomous hybrid PV/wind system by finding the configuration, among a set of systems components, which meets the desired system reliability requirements. The reliability criterion used is the levelized cost of energy. Evans et al. [17] present simplified methods to design and estimate overall performance of photovoltaic Systems. Nema et al. [18] review the current state of the design, operation and control requirement of the stand-alone PV solar-wind hybrid energy systems with conventional backup source i.e. diesel or grid. They also highlight the future developments, and conclude that the hybrid energy system combining variable speed wind turbine and PV array generating system may be integrated to supply continuous power to the load with optimal design of hybrid controller. Various optimization techniques for modelling and design of PV/wind hybrid system, by modelling wind turbine output [19] , photovoltaic panel power output [20] and optimizing it has been reported in the literature [21] . Zhou et al [22] present a state of the simulation, optimization and control technologies for the stand-alone hybrid solar-wind energy systems. They continued that research and development effort in this area is still needed.
The production of electricity from renewable energy is continually increasing. Some authors like Gurkaynak and Khaligh [23] and Ruiz-Romero et al. [24] have shown that its integration to the national network associated with a management system is more than necessary. The studies of Lu et al. [25] and Wang et al. [26] propose models based on Petri nets (PN) that is following operation modes for power management of a multi-source system. In this sense, a generic multi-source/multi-load model was developed for sustainable city, using Petri nets for power system optimization [27] . Indeed, PN is powerful tools for modeling and control for control of power systems [2] .
In regards to interconnection between local networks, it has attracted considerable interest only recently, because of losses in long distribution lines and also development of the Renewable.
Energy Sources (RESs) are used as alternate source for power generation and nearer load. Operating grid along with distribution generation is become very complicated. So the electrical network should be converted into local networks interconnected through the main network. Thus, Zhu et al. [28] described environmental influences and potential benefits of the interconnection of regional power grid in China by increasing the production of energy from natural sources. Edmunds et al. [29] considered the technical benefits of additional energy storage and electricity interconnections in future British power systems. It appears that the increased level of interconnection and energy storage provides significant technical benefits in future British power systems. The work by Minciardi and Sacile [30] follows this research approach. They present a model to support optimal decisions in a network of cooperative grids formalized as an original discrete and centralized problem and defined as cooperative network of smart power grids problem. In this framework, each grid is referred to as a “smart power micro grid” (or simply as a “micro grid”), the connection to the local energy provider as a connection to the “main grid,” and the overall set of micro grids connected among them and to the main grid is defined as the “network.” the control variables are the instantaneous flows of power in the network of grids. They use graph theory to model this system. Two case studies are compared, the first one supposes that each micro grid is independent, while the second assumes that all micro grids are connected among them by a lattice network. In the latter case, it is supposed that a unique decision maker (DM) can decide the optimal strategy to control the storage level and the power flows in all micro grids, following a cooperative approach as described by the CNSPG problem. Hooshmanda et al. [31] have investigated the problem of power flow management for a network of cooperating microgrids within the context of a smart grid and present a power flow management method in a model predictive control framework. Hammad et al. [32] focused on the development of an autonomous distributed framework for cooperation amongst a set of microgrids without support from a traditional centralized grid. This work proposes a distributed algorithm that supports autonomous operation, enhances cost efficiency, and increases reliability of the overall system. This algorithm is based on coalition formation games. They also develop an autonomous distributed framework for cooperation amongst a set of grid-independent microgrids to improve the overall microgrid network reliability. Thus, they study the ability of proposed global storage to facilitate cooperation amongst the microgrids within the network. Their main goal was to improve individual microgrid demand-supply balance by cooperation, as well as to use better renewable Distributed Energy Ressource (DER) by exchanging surplus between microgrids [33] . Numerical results demonstrate the benefits of employing this cooperative model especially for high penetration levels of renewable DERs. Ouammi et al. [34] present a centralized control model based on a linear quadratic Gaussian problem, to support optimal decisions in the control of the power exchanged for a smart network of microgrids. It considered grid interconnections for additional power exchanges and incorporated storage devices, various distributed energy resources, and loads. The proposed model is evaluated through a case study in the Savona district, Italy, consisting of four microgrids that cooperate together and connected to a main grid. Even, some hypotheses that have been introduced to simplify the model, it demonstrated that the cooperation among grids has significant advantages and benefits to each single grid operation in terms of integrating a common strategy to face shortage or excess of power production due to the intermittent behavior of RESs. Recently, Yu Wang et al. [35] investigate a hierarchical power scheduling approach to optimally manage power trading, storage and distribution in a smart power grid with a macrogrid and cooperative microgrids. They developed two algorithms, one about online power distribution in the macrogrid, and the other about distributed cooperative power scheduling algorithm.
This paper presents an original model for optimization and control of interconnections between users using a special modelling tool, Petri nets and an iterative algorithm for flow management based on instantaneous gap between the power production capability and demand of each user.
The aims of the model is to support optimal decisions in the control of the power exchanged for a smart interconnected network composed by local networks via the main grid. The model is applied to three French lands: PACA, Champagne-Ardenne and Lorraine. The three regions are connected via the national network as shown on Figure 1. Each region has its own renewable sources of energy production. First, the system sources are presented before explaining the principle of interconnection used for energy management. Then, the simulation of the model and its energy management are detailed, and simulation results are presented and analyzed. Two scenarios are considered (with or without interconnections). Finally, a detailed economic analysis is performed.
1.1. Conventional Grid and the Need of Smart Grid
Over hundred years, when electricity was first used, local authorities designed and built independent systems to supply electricity large towns or a part of them. Then, connection of all of these independent systems was made to become national grid, in the goal to provide better supply security and to reduce costs. It allowed larger and more efficient power stations to be built far from where the power was consumed. As a result, the previously independent local systems gradually lost their generation and became the distribution systems we have today [36] . The main difference between the classic systems (mainly with fossil-fired generators) and Smart Grid is the way that production and demand are kept in balance.
The electricity system design and operating strategies used in classical system is operational for decades and used around the world. However, electricity supply sector should make changes to achieve government’s carbon reduction targets. All components of the system have an important role in this achievement, but one of the most important is the replacement of fossil-fired generation with low or zero carbon generation technologies [37] . However, these generation technologies are uncontrollable sources of energy and operator will need to find new means of balancing production and consumption for system stability and ensure that there is no overload in the grid causing loss of supply as more intermittent generation and connected load can cause.
![]()
Figure 1. Schematic representation of the interconnection of the three considered regions.
1.2. The Need for Interconnection
Greater interconnection between independent local networks could be helpful. Flow of power could be in both directions. Intelligent monitoring and control will provide the lowest cost means asked to meet this permanent balance. The surplus will complement each other’s needs. It will help the network companies to meet more quickly their consumer requirements and reduce cost efficiently.
2. Hybrid PV/Wind System
The wind and solar energy are omnipresent, freely available, and environmental friendly. In recent years, the combination of these renewable energy sources (hybrid PV/wind system) become attractive and viable altern- ative of oil-produced energy to meet electricity demands. Components of such renewable hybrid energy system consists of both energy sources, a power conditioning equipment, a controller and an optional energy storage system. With the complementary characteristics between solar and wind energy resources, a hybrid PV/wind system without storage presents a good alternative to satisfy the electricity needs for locations connected to national grid, especially during peak consumption.
Because of the stochastic aspect of both solar and wind energy, the main aspects to be taken into account in the design of such a PV/wind hybrid system is the reliable supply of consumption in various weather conditions and the cost of kWh of energy. The efforts of research and development in solar and wind energy technologies, and other should continue in the way to improve their performance, to establish accurate prediction techniques of production and their integration into the national network.
2.1. Photovoltaic System Model
In this paper, a mathematical model for estimating the power output of PV modules is used. Basically, the output power generated from a PV generator, can be calculated using the following formula [16] :
 (1)
(1)
A: the area of a single module used in a system (m2)
I: the global irradiance incident (W/m2).
η: the efficiency of the PV generator.
As the operation and the performance of a PV generator is interested in its maximum power, the models describing the PV module’s maximum power output behaviors are more practical for PV system assessment. With a perfect maximum power point tracker, the efficiency of power tracking equipment ηpt = 1 [16] .
All the energy losses in a PV generator, including connection losses, wiring losses and other losses, are assumed to be zero.
η is defined as follows [20] :
 (2)
(2)
Tc: the temperature of PV cell (˚C),
Tr: the reference cell temperature (˚C)
β: the cell temperature coefficient of efficiency (˚C−1) respectively.
ηr: is the PV generator efficiency at reference temperature Tr.
 (3)
(3)
Based on the energy balance proposed by [17] , the PV cell temperature Tc is given as follows:
 (4)
(4)
Ta: the ambient temperature (˚C),
α : the absorptance coefficient of PV cell.
τ : the transmittance coefficient of PV cell respectively.
Based on the energy balance, it is shown that UL and ατ are related to the nominal operating cell temperature NOCT as follows [16] :
 (5)
(5)
IT, NOCT: the global irradiance incident at NOCT conditions1 (800 W/m2),
NOCT: nominal operating cell temperature (˚C),
Ta, NOCT: the ambient temperature at NOCT conditions (20˚C)
UL: the overall heat loss coefficient (W/(m2. ˚C)).
If the number of photovoltaic modules installed and connected to the national network is Npvi, then the total power produced for each territory i is: .
.
2.2. Wind Turbine Model
Different types of wind generators usually have different power output performance curves. However, for a specific wind generator, a model should be developed according to its power output performance curve, which is given by the manufacturer. Different models for predicting the performance of wind turbines have proposed in the literature [19] .
In this paper, the wind generator power output is estimated through characteristic equations of a wind turbine developed by Ai et al. [15] by fitting its actual power curve using method of least squares. The instantaneous wind power output from the turbine can be predicted from the wind power equation discussed here as under, following power curve of wind turbine [38] . The power curve of the wind turbine is separated to sub-functions as illustrated.
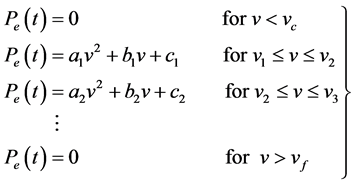 (6)
(6)

V, vc and vf are the wind speed (m/s), the cut-in speed (m/s) and cut-out (or furling) speed of the wind turbine (m/s) respectively. ;
; ;
; , are the coefficients of quadratic equations.
If the number of wind turbines installed and connected to the national network are Nwti, then the total wind power produced for each territory is: .
.
2.3. PV/Wind Model
The energy interconnection can be justified on the basis of energy independent, economic interest of the territories and the reduction of greenhouse gas emissions.
It is assumed that for regions, the energy delivered by the power grid is still available, but limited by the information of the substation that connects the PV/Wind power system of each region. Keeping in mind the objective of providing energy independence of the regions, it was decided to focus on the exchange between regions over the region-national network exchange.
The total energy generated and needed (Wgeni(t), Wdemi(t)), over a period of 24 hours for each user (region) can be defined in terms of wind and photovoltaic energy generated and power needed Pdemi(t) as follows [39] :
 (7)
(7)
 (8)
(8)
Pgeni(t) is total PV/wind power generated, t is the time (time of day) and ΔS is the time between samples (one hour).
To have a balance between power production capability and demands in a given period of time, the gap ΔPi(t) must have an average of zero. Note that the positive values of ΔPi(t) indicates the availability of production and negative values indicates insufficient production capability [40] .
![]() (9)
(9)
3. Interconnection Model
Main element of the model is the instantaneous gap between the power production capability and the demand. The principle of the interconnection system is shown in Figure 2.
Two cases arise. Whether an energy insufficiency or sufficiency. In our experiences, the production capability of each user is calculated using mathematical models of wind turbines and photovoltaic panels for a day, on the basis of hourly weather data available. Then using the instantaneous power demands data from each user, the gap between power production capability and demands over 24 hours can be calculated.
3.1. Flow Management Strategy
One of the main problems of the interconnection model is related to the control and supervision of the energy
distribution. The dynamic interaction both between users and between users and national network can lead to, critical problems of stability and power quality. Indeed, the absence of storage and the problem of intermittent power generation can lead to important losses. The decentralized injection permits a decrease of the network load if the energy produced is immediately consumed locally. Otherwise, it can quickly lead to overloading of the distribution network. Also, decentralized systems (PV, Wind) influence on the quality of the voltage and may even cause non-compliant energy returns to the upstream network. Whence, the vital role that management system can play on such system.
To assure continuous supply of the load demand, managing the flow of energy throughout the proposed model is to be done. The main objective of the energy flow and management is to supply the load with its full demand. The goal of this study is to design an effective power management system for interconnection system between users based on their gap between renewable hybrid power system production and needs.
The following operating strategy is employed:
・ The use of electric power generated by the photovoltaic arrays and wind turbine generators has priority in satisfying electricity demand over that provided by national network.
・ If the total electric power generated by the photovoltaic array and wind turbine generators is higher than the demand, the additional electric power sold to users in demand via the national network. If there is not users in demand, power sold to national network.
・ If the total electric power generated by the photovoltaic arrays and wind turbine generators is less than the demand, electric power will be bought from others user’s additional electric priority. Then from national netw-ork, if demand still cannot be satisfied.
To achieve this operation strategy, an iterative algorithm is developed in order to control and manage the power flows exchanged according to the gap between production capability and the demands for each user.
The algorithm uses the characteristic data of the demands Pdemi (t), and daily weather data from location of user i. It allows to calculate the wind power generation Pwti (t), and photovoltaic power generation Ppvi (t). Their sum equal to the wind/PV production capability Pgeni (t). Also, it enable to calculate the gap ΔPi (t) between the production capability Pgeni (t), and power demands Pdemi (t) instantaneously.
Several configurations are possible depending on the number of users. In this work, three users are considered i=1, 2, 3.
For each user there are 8 configurations that can exist:
§ ΔPi (t) can be lower to zero (ΔPi (t) <0), it is given the index 0;
§ ΔPi (t) can be greater than or equal to (ΔPi (t) ≥ 0), it is given the index 1;
The configurations [000, 001, 010, 011, 100, 101, 110, and 111], are assigned to the coefficients [ϴ0, ϴ1, ϴ2, ϴ3, ϴ4, ϴ5, ϴ6, ϴ7], respectively.
3.2. Control of Interconnection System Based on Petri Nets
The model is developed using a special modeling tool, Petri nets. It composed by two blocks (Figure 3).
・ The block witch generated the sign of ΔPi(t) with an iterative algorithm,
・ A block that describes Petri nets simulations. It consists in two subnets:
§ Subnet modeling configurations of the different territories at a given time.
§ Subnet modeling the regulation of flows exchanged through the interconnection user/user via the nat- ional network and user/national network.
Several configurations are possible depending on the number of users.
PN1 depicts how the configuration change (Figure 4) and PN2 represents the Petri Nets that regulates the power flow (Figure 4), it selects the appropriate power exchange to reach the demand. The transition from one place to another is dependent on the sign of gap between the production capability and power demands.
For PN1, eight places (P0, P1, P2, P3, P4, P5, P6 and P7) representing eight states. They are linked by twenty-one transitions. Each state corresponds to a configuration. Each configuration is characterized by the presence of a token in the corresponding place. For example, a token in the place P0, means the system is on configuration 000. This state occurs when the gap between production capability and needs of each territory becomes negative. Indeed, transitions fired if all conditions are met. PN1 can be explained as Table A.1.
For each user and according to the configuration, when needs become higher than the production capability, it buys surplus from other users via the national network. If the latters could not meet its request, it bought directly from the national network own production.
![]()
Figure 4. Petri Net (PN1) modelling configurations.
PU1, PU2 and PU3 places correspond to the three user states (Figure 5). To describe the interconnections user/ user and user/national network, two states are defined for each user (PN2).
As described above, either there is sufficiency or insufficiency. Indeed, according to α configuration at time ,
and the sign of the sum of the gaps.![]() , transitions can be fired. The presence of a token in a place
, transitions can be fired. The presence of a token in a place
corresponding to the user, characterizes the state of sufficiency of the latter. Otherwise, characterizes its insufficiency. Thus, different flows can be traded, according to different conditions as Table A.2. The Petri net control is composed of arcs inhibitors, their role is to prevent the presence of more than one token in places PU1, PU2 and PU3 [2] .
4. Cost Modelling
The objective of the economic analysis is to show the economic advantages of the model. For this, the levelised cost of energy for hybrid wind/PV power system is estimated as follows [41] :
![]() (10)
(10)
![]()
Figure 5. Petri net (PN2) modelling interconnections user/user and user/national network.
where TAC and El represent, respectively, the total annualized cost, and the annual total energy. The total annualized cost is calculated by taking into consideration the present value of costs (PVC) and the capital recovery factor (CRF) [42] :
![]() (11)
(11)
The capital recovery factor can be expressed as follows [43] :
![]() (12)
(12)
where γ is the annual discount rate, and N the system life in years (generally 25 years for PV/wind systems) [41] .
The present value of costs for hybrid system consists of the sum of Cpv, and Cwind. What are the sum of present value of capital and maintenance costs of the PV system and the sum of present value of capital and maintenance costs of the wind turbines in system life, respectively [44] :
![]() (13)
(13)
According to the studied system, the present value of costs is composed of the initial cost (IC), the present value of maintenance cost (MC) and the present value of replacement cost (RC) [42] . The initial cost of system components comprises the AC (acquisition costs) and the installation costs. Installation cost of system comp- onents is taken as a fraction of AC (ε) [45] . It is usually taken as 50% of the PV system and 25% of the wind turbines [39] .
The present value of maintenance costs of the hybrid system is expressed as:
![]() (14)
(14)
where Cm0 represents the maintenance cost in the first year. It can be expressed as a fraction m of the initial cost:
![]() (15)
(15)
In this work the maintenance cost is considered the same as first year. m is equal to 1% of the acquisition cost for the PV system, and 5% of the acquisition cost for the wind turbines [42] .
In the context of cost of electricity minimization in the French electricity sector. The following paragraphs present a comparative basis of two scenarii:
§ A baseline scenario (BS) that does not include the interconnect option and considers the current state of operation centered on national network of regional electrical systems.
§ An interconnection scenario (IS) favoring the interconnection of territories.
5. Interconnection Model
5.1. Conventional Grid and the Need of Smart Grid
In this paper “the PACA region” is taken as user 1, “the Champagne-Ardenne region” as user 2 and the “Lorrai- ne region” as user 3.
The production capability is calculated from weather data.
Ten percent of the hourly average daily demand for each region for a summer day (June 30, 2014) are considered. The gap between production capability and demand is calculated over a 24 hours period as shown in Figure 6.
According to Figure 6, five configurations are occurred:
Configuration 000 (parts a, c and g) shows that all regions are in energy insufficiency (ΔPi = 1, 2, 3 (t) < 0). This occurs in the interval from 00 to 8 am which the PV/wind production capability is low than needs, causes less favorable weather conditions. And from 19 h to 22 h, interval for which the needs for electricity is highest in France, and the weather conditions become less favorable to the production, especially photovoltaic. Therefore regions have a status of buyers because their production is not sufficient to meet 10% of their needs as shown in Figure 7, Figure 8. They buy from the national network, and flowNationalNetwork/PACA, flowNational- Network/Champagne, flowNationalNetwork/Lorraine are negative and are obtained using (Equation. B.1).
§ Configuration 010 (part h) shows that PACA and Lorraine regions are energy insufficiency (ΔPi = 1, 3 (t) < 0), unlike the Champagne Ardenne region what is oversupplied (ΔPi = 2 (t) < 0) as shown in Figure 5 and Figure 6.
In this case the Champagne Ardenne sells its surplus to the other regions, and flowChampagne/PACA, flowLorraine/Champagne are obtained using (Equation. B.6). Note that the sign of the sum of the energy gaps is negative, which explains the dissatisfaction of the needs of regions in energy insufficiency. To meet them, they also buy from the national network, and flowNationalNetwork/Champagne, flowNationalNetwork/Lorraine are negative as shown in Figure 7 and Figure 8.
![]()
Figure 6. Gaps between PV/Wind production capability and needs for each region.
![]()
Figure 7. Flow exchanged between the national network and the three regions.
![]()
Figure 8. Flow exchanged between the three regions.
§ Configuration 001 (parts b and f) shows that the PACA region and Champagne Ardenne are in energy insufficiency (ΔPi = 1, 2 (t) < 0), unlike the Lorraine region that is in situation of oversupply (ΔPi = 1, 2 (t) > 0).
In this case the Lorraine Region sells its surplus to the other regions in need, and flowLorraine/Champagne, flowLorraine/PACA are obtained using (Equation. B.7) for the parts where the sum of energy gaps is negative, and using (Equation. B.2) for the parts where the sum of gaps is positive. For the positive part, to meet their needs, both regions in energy insufficiency buy from national network, flowNationalNetwork/PACA, and flow- National-Network/Champagne are negative as shown in Figure 7 and Figure 8. Otherwise, it’s the Lorraine region that sells to national network, the remaining surplus after meeting the needs of other regions.
§ Configuration 101, which is shown in part (e) shows that the PACA and Lorraine regions are over- supply (ΔPi = 1, 3 (t) > 0), unlike the Champagne Ardenne which is in energy insufficiency (ΔPi = 2 (t) < 0).
In this case both regions sell their surplus to Champagne Ardenne region, and flowChampagne/PACA, flow- Lorraine/Champagne are obtained using (Equation. B.3), when the sign of the sum of their gaps is negative, and using (Equation. B.6), when the sign of the sum of their gaps is positive. When it is negative, the production capability of both regions in energy sufficiency can’t meet le needs of the region in energy insufficiency. There- fore, this latter buys from the national network, flowNationalNetwork/Champagne is negative as shown in Figure 5, Figure 6. Otherwise, these are both regions in oversupply that sell to the national network, the rest of the surplus after meeting the region in insufficiency.
§ Configuration 100, which is shown in part (d) shows that the regions and Champagne Ardenne Lorraine are in energy insufficiency (ΔPi = 2, 3 (t) < 0), unlike the PACA which is oversupplied (ΔPi = 1 (t) > 0).
In this case the both regions buy to PACA its surplus as shown in Figure 6, Figure 7, and flow Cham- pagne/PACA, flowLorraine/PACA are obtained using (Equation. B.4). Note that the sign of the sum of the gaps is negative, which explains the dissatisfaction of regions in energy insufficiency. To meet their needs, they also buy from the national network as shown in Figure 6 and Figure 7, and flowNationalNetwork/PACA, flowNationalNetwork/Lorraine are negative.
With storage means cost and environmental issue, regionsmay sell their excess production by the interco- nnection with others regions. It is clear from Figure 7 and Figure 8 that, the interconnection can significantly reduce regional dependence on non-renewable energy consumption from national network and the need of storage. It should become more attractive as costs of national network supplies increase. Indeed, from 10 pm to 12 pm there is not flow bought from national network to Champagne Ardenne, its excess is sold to both regions, PACA and Lorraine. Around 10:30 am to 7 pm, even its gap is negative as shown in Figure 7. Its needs are satisfied by excess from PACA and Lorraine as shown in Figure 7. Same case is occurred between 8 am and 10:20 am and around 4:30 pm to 6 pm for PACA as shown in Figure 7. Its needs are satisfied by excess from Lorraine and Champagne. This proves that the interconnection of regions can replace the centralized system on national network and reduce the need of storage.
5.2. Cost Analysis
For each PV system the acquisition costs of photovoltaic panel are about 1.42 €/W. For the inverter it is approximately 0.11 €/W, are considered. For each wind system, acquisition costs are about 0.41 €/W. The level- ised cost of energy (€/kWh) for each region is defined as Table 1, taking into account the production percentages by renewable energy as Table 2 and Table 3. Price per kWh for EDF in optional base is 0.1403 €
a. Source: Observ’ ER
b. LCE for PV power sale PV is 0.11688 €and for wind power it is 0.082 €
To investigate the feasibility and economic advantages of the interconnection of regions, two scenarii are developed:
- A baseline scenarii (BS) and
- An interconnection scenarii (IS) favoring the interconnection of regions in the context of a possible minimization of the cost of electricity and sustainable development of the French electricity sector.
The following paragraphs present a comparative basis of both scenarii. Figure 9 shows the gap results between buying and selling costs of both scenarii for each region. Notice that only 10% of demands are considered.
Results on Figure 9 show pertinently that the interconnection scenario (IS) is very economically advant- ageous over the classic model.
For PACA, it is about 42% of gain over the baseline scenario (BS). Then for Champagne Ardenne, it is about 156% of benefices over the baseline scenario (BS). Finally 53.53 % of gain for Lorraine.
The use of such a model can be interesting, if in the future the leaders of the regions and the national network find mutual agreement for the integration of such a system in the country’s energy environment.
6. Conclusions
This work presents an original interconnection model for power control and management between territories (cities, departments, regions). Through their own energetic resources (hybrid PV/Wind systems with or without storage) and their connection to the national network, the users (territories) can be both “producers and consumers” of energy. This means that the power flow could be in both directions. A control scheme using Petri Nets has been proposed for controlling and managing the production capabilities and demands of each user. An original algorithm is developed for operation strategy. It is based on the sign of output gap between energy production capability and demands. This leads to the statements and configurations of users. Each user can have two statements: energy insufficiency or sufficiency. A detailed economic analysis has been performed based on two scenarii: A baseline scenario (BS) and an interconnection scenario (IS) favouring the interconnection.
![]()
Table 1. Levelised cost of energy (LCE) for the three regionsa.
a) Source: observ’ ER, b) LCE for PV power sale PV is 0.11688 €and for wind power it is 0.082 €
![]()
Table 2. Installed and produced wind turbine capacity, and its percentages depending on total PV/Wind production for each regiona.
a) Source: observ’ ER.
![]()
Table 3. Installed and produced PV capacity, and its percentages depending on total PV/Wind production for each regiona.
a) Source: observ’ ER.
![]()
Figure 9. Comparison of Gaps between power purchase and sale for three regions: interconnection scenario (IS)/baseline scenario (BS).
The aim of the work is to demonstrate that it is possible to reduce the dependence on conventional energy by developing local hybrid sources such as “PV-Wind” and pool them through the national network. A detailed economic analysis has been performed based on two scenarii: A baseline scenario (BS) and an interconnection scenario (IS) favouring the interconnection. Numerical Simulations are carried out for 3 French regions: PACA, Champagne-Ardenne and Lorraine. The results clearly show that the interconnection of regions present significant environmental advantages through the use of renewable energy and can reduce considerably financial investment on storage means. They also show pertinently economic advantages over classic model with 42%, 53.53% and 156% of benefices for PACA, Lorraine and Champagne-Ardenne respectively.
Acknowledgements
The authors would like to thank the support of the ECAM-EPMI, Graduate School of engineering.
Appendix A
![]()
Table A.1. Transitions and its firing conditions for PN1.
a) x = 1, 2, 3… 7: previous configuration.
![]()
Table A.2. Transitions and its firing conditions for PN2.
a) See Appendix for equations.
Appendix B2
![]() Equation. (A.0)
Equation. (A.0)
![]() Equation. (A.1)
Equation. (A.1)
![]() Equation. (A.2)
Equation. (A.2)
![]() Equation. (A.3)
Equation. (A.3)
![]() Equation. (A.4)
Equation. (A.4)
![]() Equation. (A.5)
Equation. (A.5)
![]() Equation. (A.6)
Equation. (A.6)
NOTES
![]()
1NOCT conditions: IT, NOCT = 800 W/m2, Ta, NOCT =20˚C wind speed = 1 m/s and η = 0.
![]()
2Whether X and Y, two different users or a user and national network, flowXY > 0 means Y sells |flowXY| to X and flowXY < 0 means Y buys |flowXY| from X.