Influence of Inter-Particle Distance, Entrapped Water Volume and Salinity of Water on the Escape Velocity of Particles on a Riverbank ()
1. Introduction
Rivers and streams are products of their catchments. They are often termed as dynamic systems because they are in a constant state of change. The factors controlling river and stream formation are complex and interrelated. These factors include the amount and rate of supply of water and sediment into stream systems, catchment geology, and the type and extent of vegetation in the catchment. As these factors change over time, river systems respond by altering their shape, form and/or location. Stream bank erosion is a natural process that over time has resulted in the formation of the productive floodplains and alluvial terraces. In fact, even stable river systems have some eroding banks. However, the rate at which erosion is occurring in stable systems is generally much slower and of a smaller scale compared to which occurs in unstable systems. Events like flooding can trigger dramatic and sudden changes in rivers and streams. However, land use and stream management can also trigger erosion responses. The responses can be complex, often resulting in accelerated rates of erosion and sometimes affecting stability for decades. In the present work a model called the Truncated Pyramid Model [1] has been used to calculate the escape velocity of a particle on a riverbank and the phenomenon of the initiation of cohesive bank scour has been dealt with a deterministic approach.
2. Related Theory
Erosion can occur in the riverbanks owing to several reasons resulting in bank instability though the riverbed in dynamic equilibrium neither degrades nor aggrades. Though plenty of researches have been done on study of non-cohesive riverbank erosion and stability but only a very few research have been conducted on analysis of forces on a particle on the cohesive riverbank. Odgaard and Mosconi (1987) have conducted Field tests to arrive at suitable stream bank protection methods [2]. Also, Odgaard (1987) proposed that the bank erosion rate might also be correlated to near-bank flow depth rather than the excess near-bank velocity [3]. Darby et al. (2000) made the stability analysis for a steep cohesive riverbank with the help of a suitable computational technique [4]. Darby and Delbono (2002), in their paper, reported the development of a model of flow, sediment transport, grain-size sorting, and bed topography for river bends with erodible banks [5]. Duan (2005) resorted to the method of force analysis to calculate the escape velocity of the sediment particle. She showed that the predominant forces acting on the particle are lift force, submerged weight of the particle and cohesive force between the particles. The cohesive force has been presented as a function of a number of parameters related to bank material. The cohesive force plays a major role in bank erosion phenomenon. It is directly related to the threshold velocity and acceleration [6]. Lenzi et al. (2006) calculated the effective discharge for sediment transport in a mountain river [7]. Meunier et al. (2006) reported measurements of flow and sediment transport leveled in a pro-glacial gravel-bed river. Their analysis of velocity profile measurements indicated that in that highly turbulent and shallow stream, the use of a logarithmic form failed to recover the velocity profile and to estimate the shear velocity of the flow. They proposed a uniform Chézy-like relationship with a constant friction coefficient over the range of their measurements [8]. Achite and Ouillon (2007) quantified the fine sediment budget of a wadi (dryland river) in Northwest Algeria for a period of twenty two hydrological years (1973-1995). They found that the mean annual suspended sediment yield was highly correlated with the standard deviation of mean daily discharge calculated per year [9]. Mukherjee and Mazumdar (2010) introduced a new analytical model called the Truncated Pyramid Model that dealt with the micro-level variations occurring in a cohesive riverbank and suggested equations for determination of the escape velocity of a particle. The model considered more degrees of freedom, as compared to its previous research, experienced by a particle under the influence of its neighbouring particles. However, the results published were for pure water only [1].
Cohesive Force between Two Particles
For low water contents, the macroscopic cohesion is ensured by the presence of a pendular liquid bridge between two particles. Most expressions of the capillary force are based on assumptions of toroidal or parabolic shape of the liquid bridge and on the geometrical characteristics of the liquid bridge. These characteristics may be the filling angle, the internal or external curvature radii etc. Apart from the difficulties associated with the measurement of these parameters, those expressions do not provide the evolution of capillary force in the form of a force-displacement relationship accounting for the water content as a macroscopic quantity directly accessible to measurement. Richefeu et al. (2007) presented a three-dimensional discrete-element approach for numerical investigation of wet granular media. Their approach relies on the basic laws of contact and Coulomb friction enriched by a capillary force law between particles. In their paper they showed that the latter can be expressed as a simple explicit function of the gap and volume of the liquid bridge connecting a pair of spherical particles. The length scales involved in that expression were analyzed by comparing with direct integration of the Laplace-Young equation. They illustrated and validated that approach by application to direct shear and simple compression loadings. The shear and compression strengths obtained from simulations reproduced well the experimental measurements under similar material and boundary conditions. Their findings revealed that the number density of liquid bonds in the bulk is a decisive parameter for the overall cohesion of wet granular materials. A homogeneous distribution of the liquid within the bridge de-bonding distance, even at low volume contents, leads to the highest cohesion. The latter is independent of the liquid content as far as the liquid remains in the pendular state and the number density of liquid bonds remains constant [10]. Soulie et al. (2006) expressed capillary force as an explicit function of local geometrical and physical parameters. They suggested a relation between the geometric parameters of the particles of unequal radii and the force acting between those particles of radius R1 and R2 having inter-particle distance (between periphery) D. The equation proposed by them is
 (1)
(1)
where the coefficients a, b and c are functions of the volume " of the liquid bridge, s is the surface tension, f is the contact angle, and R = max (R1, R2).
Also
 (2a)
(2a)
 (2b)
(2b)
 (2c)
(2c)
This equation can be used to express the capillary cohesion between two soil particles [11]. The general equations of impending acceleration used in the Truncated Pyramid Model have been developed from these equations.
3. Truncated Pyramid Model
In this paper a model called the Truncated Pyramid Model (Mukherjee and Mazumdar, 2010) has been used to calculate the escape velocity of a particle on a riverbank. According to the model, each particle, spherical in shape and materially homogeneous, rests on two particles under it in a pyramidal structure. The coordinate of a particle is indicated by suffices i and j denoting the corresponding row and column number, respectively. For example, particle 12 is the second particle in the first or topmost row and it rests on particles 22 and 23.
General Equations of Impending Acceleration of a Particle Using Truncated Pyramid Model
For a particle designated as ij, impending acceleration can be found out in x and y direction considering dynamic equilibrium. The submerged weight of the particle is acting in the negative y direction (vertically downwards). The general equations of impending acceleration as given by Mukherjee and Mazumdar (2010) can be written in a slightly different form for x and y directions as follows:
 (3)
(3)
where
P1 = Part of x-component of force between particles ij and i + 1, j + 1
 (4a)
(4a)
P2 = Part of x-component of force between particles i – 1, j and ij
 (4b)
(4b)
P3 = Part of force between particles ij and i, j + 1
 (4c)
(4c)
P4 = Part of x-component of force between particles ij and i + 1, j
 (4d)
(4d)
P5 = Part of x-component of force between particles i – 1, j – 1 and ij
 (4e)
(4e)
P6 = Pаrt of force between particles ij and i, j – 1
 (4f)
(4f)
 (5)
(5)
where
P7 = Part of y-component of force between particles ij and i + 1, j
 (6a)
(6a)
P8 = Part of y-component of force between particles ij and i + 1, j + 1
 (6b)
(6b)
P9 = Part of y-component of force between particles i – 1, j – 1 and ij
 (6c)
(6c)
P10 = Part of y-component of force between particles i – 1, j and ij
 (6d)
(6d)
Here r, rs = densities of water and sediment particles, respectively, and g = acceleration due to gravity.
The resultant impending acceleration (in m/s2),
 (7)
(7)
The direction of the resultant acceleration is given by 
In compliance with the equation used by Duan (2005) the escape velocity (in m/s) of the particle ij would be
 (8)
(8)
where Rij is expressed in mm.
4. Calculation of Sediment Particle Escape Velocity for Pure Water and Saline Water
For pure water following values have been considered for different parameters:
• Density of water: 1000 kg/m3;
• Surface tension, s = 0.073 N/m;
• Contact angle, f = 0;
• Volume of the water bridge, " = 10 nl, 20 nl and 30 nl.
Here calculations have been done for determination of the escape velocity of individual particle in the Truncated Pyramid Model sitting at the extreme left position of each row, i.e., for particle 11, 21, 31 and 41 for different inter-particle distances and different volume of water bridges. Particle 21 is assumed to have radius equal to the mean radius of 0.4 mm obtained from a field survey conducted by Water Engineering and Technology, Inc. (1987), on the West Jordan River (Duan, 2005) [6]. In compliance to the assumptions of the model one percent deviation in the values of the radii of successive particles have been assumed (this deviation is considered only to show the effectiveness of the model and any other variations in radii can be incorporated in calculations as different cases may suggest), which means
Radius of particle 11, R11 = 0.396 mm
Radius of particle 21, R21 = 0.4 mm
Radius of particle 12, R12 = 0.4 mm
Radius of particle 22, R22 = 0.404 mm
Radius of particle 31, R31 = 0.404 mm
Radius of particle 32, R32 = 0.408 mm
Radius of particle 41, R41 = 0.408 mm
Radius of particle 42, R42 = 0.412 mm
Radius of particle 51, R51 = 0.412 mm
Radius of particle 52, R52 = 0.416 mm
And so on.
The values of the coefficients aij, bij and cij in the equation of cohesive force between two particles are functions of their radii and the volume of the liquid bridge between them, and hence values of aij, bij and cij have been calculated separately for each pair.
Same calculations have been done for the saline water also. Following properties of saline water have been used in the present analysis:
• Density of water: 1025 kg/m3;
• Surface tension: 0.0681 N/m [Poorni et al. (2009)] [12];
• Contact angle: 25˚ (According to Bakker et al. (2003) contact angle varies in the range from 15˚ to 50˚ depending on the nature of the solid surface [13], and according to Morgan (1963) contact angle can be considered as 25˚ for impure water [14]).
5. Results and Discussions
Figures 1 to 3 show the component of escape velocity of particle 11 normal to the bank surface vs. the inter-particle distance for pure and saline water when volume of the liquid bridge varies from 10 nl to 30 nl at 10 nl interval.
Figures 4 to 6 show the component of escape velocity of particle 21 normal to the bank surface vs. the inter-particle distance for pure and saline water when volume of the liquid bridge varies from 10 nl to 30 nl at 10 nl interval.
Figures 7 to 9 show the component of escape velocity of particle 31 normal to the bank surface vs. the inter-particle distance for pure and saline water when volume of the liquid bridge varies from 10 nl to 30 nl at 10 nl interval.
Figures 10 to 12 show the component of escape velocity

Figure 1. Component of the escape velocity of particle 11 normal to the bank surface vs. the inter-particle distance for pure and saline water when volume of the liquid bridge is 10 nl.

Figure 2. Component of the escape velocity of particle 11 normal to the bank surface vs. the inter-particle distance for pure and saline water when volume of the liquid bridge is 20 nl.
Figure 3. Component of the escape velocity of particle 11 normal to the bank surface vs. the inter-particle distance for pure and saline water when volume of the liquid bridge is 30 nl.

Figure 4. Component of the escape velocity of particle 21 normal to the bank surface vs. the inter-particle distance for pure and saline water when volume of the liquid bridge is 10 nl.

Figure 5. Component of the escape velocity of particle 21 normal to the bank surface vs. the inter-particle distance for pure and saline water when volume of the liquid bridge is 20 nl.

Figure 6. Component of the escape velocity of particle 21 normal to the bank surface vs. the inter-particle distance for pure and saline water when volume of the liquid bridge is 30 nl.

Figure 7. Component of the escape velocity of particle 31 normal to the bank surface vs. the inter-particle distance for pure and saline water when volume of the liquid bridge is 10 nl.
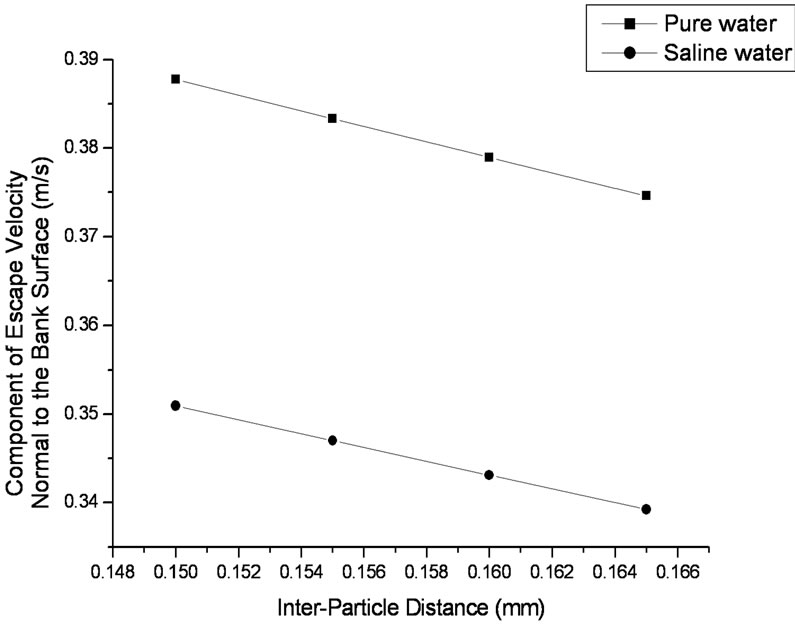
Figure 8. Component of the escape velocity of particle 31 normal to the bank surface vs. the inter-particle distance for pure and saline water when volume of the liquid bridge is 20 nl.

Figure 9. Component of the escape velocity of particle 31 normal to the bank surface vs. the inter-particle distance for pure and saline water when volume of the liquid bridge is 30 nl.

Figure 10. Component of the escape velocity of particle 41 normal to the bank surface vs. the inter-particle distance for pure and saline water when volume of the liquid bridge is 10 nl.

Figure 11. Component of the escape velocity of particle 41 normal to the bank surface vs. the inter-particle distance for pure and saline water when volume of the liquid bridge is 20 nl.

Figure 12. Component of the escape velocity of particle 41 normal to the bank surface vs. the inter-particle distance for pure and saline water when volume of the liquid bridge is 30 nl.
of particle 41 normal to the bank surface vs. the inter-particle distance for pure and saline water when volume of the liquid bridge varies from 10 nl to 30 nl at 10 nl interval.
The results indicate that the escape velocity of a particle on the riverbank gets reduced as the water entrapped between the particles becomes saline. This is, in fact, very much in line with the findings of Soulie et al. (2006), which show a reduction of the capillary cohesive force between two adjacent particles with the increase of the impurity in the water. As the force between the adjacent particles weakens less velocity would be required by the particle to be separated from the riverbank. Therefore subsequent reduction in the escape velocity of the particle, as found in the present calculation, is justified.
6. Conclusions
The Truncated Pyramid Model provides an accurate solution for determination of escape velocity of the particle as well as the other relevant parameters in different practical situations. In case of riverbanks the amount of water entrapped between the soil particles is bound to change from time to time and, therefore, it is necessary to analyze the system from a more general point of view. In addition, this method also helps to estimate the parameters for individual particles and their behaviors. This model has considered the inter-actions of the particles at the micro-level and takes into account the relevant variations of the properties of water as well. The present analysis indicates that the force between the adjacent particles reduces significantly as the water entrapped between them turns from pure to saline. This implies that rate of riverbank erosion would increase if salinity of water increases. One can calculate the change in the rate in terms of the escape velocity with the present method. But, it also depends on other factors, e.g., inter-particle distance and volume of water bridge between a pair of particles. For a fixed value of the escape velocity the value of the inter-particle distance changes considerably as the volume of the water bridge varies. For the same range of the escape velocity the inter-particle distance is more for higher volume of the water bridge. So, it can be also noted that for a fixed value of the inter-particle distance the escape velocity increases as the volume of the water bridge increases within the domain of study. This emphasizes the important role of water existing between a pair of particles.
7. Acknowledgements
The authors are indebted to Mr. Abhijit Pal, Mr. Anik Das and Mr. Anurag Paul, all from Kalyani Government Engineering College, for their cooperation during the preparation of the manuscript.
Notation
The following symbols are used in this paper:
aij, bij and cij = coefficients used in the equation of force;
ijDi + 1, j + 1 = inter-particle distance (between periphery of particles ij and i + 1, j + 1);
ijFi + 1, j + 1 = force acting between two particles ij and i + 1, j + 1;
P1 to P10 = parts of forces between particles as defined in the text;
fij = resultant impending acceleration;
g = acceleration due to gravity;
mij = mass of a particle ij;
Rij = radius of a particle ij;
Vs = escape velocity of the sediment particle from bank;
Vsn = component of escape velocity of the sediment particle from bank normal to bank surface;
 = x-component of impending acceleration of particle;
 = y-component of impending acceleration of particle;
s = surface tension;
b = angle of bank surface;
r, rs = densities of water and sediment particles, respectively;
f = contact angle;
V = volume of the liquid bridge.