Indoor Air Quality in a Real Operating Theatre under Effective Use Conditions ()
1. Introduction
The study of ventilation performance for indoor air quality (IAQ) and contaminant removal in Operating Theatres (OTs) connected to definition and quantification of the contaminant sources under effective use conditions is a complex task. Existing databases generally refer to constant particle mass emission of a person as a function of his/her activity. Several works analyze different sources and human activities causing high levels of indoor particle concentration, diffusion and re-suspension processes. Some authors [1] present studies of the influence of periodic bending movement of the surgeon on the air flow field and bacteria carrying particle distribution using a combined approach based on Eulerian RANS model, modified drift-flux and moving mesh. Brohus et al. [2] used smoke visualization and numerical simulations to evaluate the influence of medical staff movements on contaminant transport in an OT. In that study, bacteria attributed to the skin flake emission of staffs and patients are simulated as a gaseous contaminant. The most widely used experimental methods allow particle size calculation for discrete intervals, so as to check whether microclimatic and IAQ conditions are in compliance with standards and specific rules. Some authors have developed a useful method for determining individual emission rates from ambient air contaminant concentrations caused by multiple indoor sources [3] . Other studies provide sampling method integrated with statistical analysis [4] . Otherwise, it is widely argued that in cleanrooms and OTs [5] the main source of aerosol particles is people, building materials, furnishings and equipment. In a recent paper, bacteria sources are investigated [6] in a university classroom while occupied and vacant as concentration differences due to the two conditions. Other authors demonstrate that aerosol particles may be suspended in an occupied area but also deposited on interior surfaces, their emission from persons being mainly due to sneezing and coughing, skin and hair fragments [7] . Besides the influence of the airflow pattern, it has been demonstrated that particle dynamic behavior is strongly dependent on particle size and size-related forces [8] [9] . Chih-Shan Li et al. [10] carried out a series of field tests by active and passive sampling of air and surfaces measuring bacterial and fungal concentrations without referring to particle size and diameter. Another paper [11] based on particle counting combined with statistical analysis, evaluates the aerobic bacterial sedimentation and connected index of microbial air contamination. In that, results refer to different particle diameters but not to emission sources. Computational Fluid Dynamics (CFD) applications have been proved as an effective way to investigate airflow and contaminant dispersion in indoor environments of OTs and cleanrooms [12] [13] . Some authors [9] [14] investigated the best ventilation system to control particle dispersion, but without connection to particle dimensions. In a recent study [15] , CFD simulation was used to examine the effectiveness of the laminar flow system for preventing infectious particles reaching surgical staff. In a previous study by the same authors [16] , simulations were carried out using the Renormalization Group (RNG) k-ε turbulence model, assuming a released rate of bacteria-carrying airborne particulates from surgical staff of 100 BCP/min per person and for patients of 400 BCP/min per wound. In general, CFD simulation concerning aerosol particle transport and diffusion processes can be solved by three main different numerical approaches. The first method consists in solving the particle concentration field by using diffusion-transport equations based on “passive scalar transport” into which the vector of particle transport is the motion field of the fluid but gravitational effects and frictional forces on particle motion are disregarded; this can provide misleading results for particles with a diameter larger than 10 μm. The second approach is the Eulerian-Eulerian method and the third is the Eulerian-Lagrangian. Both methods solve the airflow field based on the Eulerian approach, but the particle phases are treated differently. With the Eulerian-Eulerian method the particle concentration is directly solved keeping into account the gravitational effect in the transport term, while in the Eulerian-Lagrangian one ordinary differential equation is solved for any particle path, so that a time-consuming statistical work is then required to obtain the particle concentration. A modified drift-flux model based on the second approach has been applied to modelling particle transport [1] [17] [18] . At present, there are not many articles in the literature concerning numerical modelling in which the contaminant concentration for the IAQ analysis has been performed starting from sources of particle emission with a distribution dependent on particle diameter [19] [20] . However, national and international standards require, for environment classification, a particle count for diameter dimension. Actually, there is a lack of data concerning specific emission sources in terms of particles issued in time unit by people. A recent study provides the quantification of size-resolved particle concentrations in indoor air of a classroom under occupied and vacant conditions [19] . Another important numerical study provides information on airflow, particle deposition and movement in two different spaces equipped with displacement and mixing ventilation modes [20] . A discrete trajectory model combined with the Eulerian method is adopted for simulating the indoor aerosol particle concentration.
Our present study starts from an investigation aiming to obtain a distribution of emitted particles as a function of their diameter, assuming that the amount of particles mass emitted by a person in a time unit does not change with their size. Starting from this assumption, the distribution of emitted particles will consist of a larger number of a smaller size, and vice versa. Experimental measurements and numerical CFD simulations were carried out during simulated hip surgery. Our study, referring to results presented in recent work of the authors [21] , investigates the thermo-fluid dynamics combined with the analysis of the concentration of diluted gas phase and particle aerosol dispersion in the air. Some IAQ indexes, widely used in the literature, were calculated as global and local values referring to the total volume of the room but also to the critical zones defined by ANSI/ASHRAE [22] .
2. Experimental Measurements
Experimental investigations were conducted in a real orthopaedic OT of the University Hospital of Parma (Italy) referring to [23] -[26] . The HVAC system was working during all tests, supplying a constant incoming airflow rate into the room at the controlled temperature. Combined microclimatic and microbiological measurements were carried out, during two different OT conditions: “at rest” (i.e. room complete, with all services functioning and equipment installed and operable or operating, but without surgical and healthcare staff and the patient); “operational”, i.e. all services and equipment functioning, medical staff surrounding the patient lying on the operating table, during simulated hip surgery lasting 20 - 25 minutes, sliding door opening and closing (Figure 1). The experimental campaign was carried out over a two day period, from 8 a.m. to 2 p.m. The sampling points are illustrated in Figure 2. For microclimate measurements, 1 hot wire anemometer, 1 air-temperature and humidity sensor, 1 globe thermometer and 1 differential pressure sensor were used. Microclimate instruments were connected to a radio master R-Log data logger system, which provides average values of the parameters measured as results of the calculations of the acquisition made every 2 seconds (mean, maximum and minimum values). For air active sampling, a particle counter (Climet CL 754) was used. The equipment can sample a volume of 75 l/min of air and gives the number of suspended particles, divided according to the diameter (≥0.3; ≥0.5, ≥1.0; ≥5.0 µm), allowing one to deduce particle concentration in the diameter ranges (0.3 - 0.5 μm); (0.5 - 1 μm); (1 - 5 μm). The measurements were carried out in triplicate in “at rest” and “in operational” conditions. For each sampling point, an activation delay of 2 and a delay of 10 between each moment of aspiration of the triplicate sampling was applied. Table 1 reports some technical data of instruments used for the experimental campaign. Statistical analysis of the experimental microclimate data and percentage deviation with respect to the average values was carried out: results are shown in Table2 Experimental data of air temperature and relative humidity
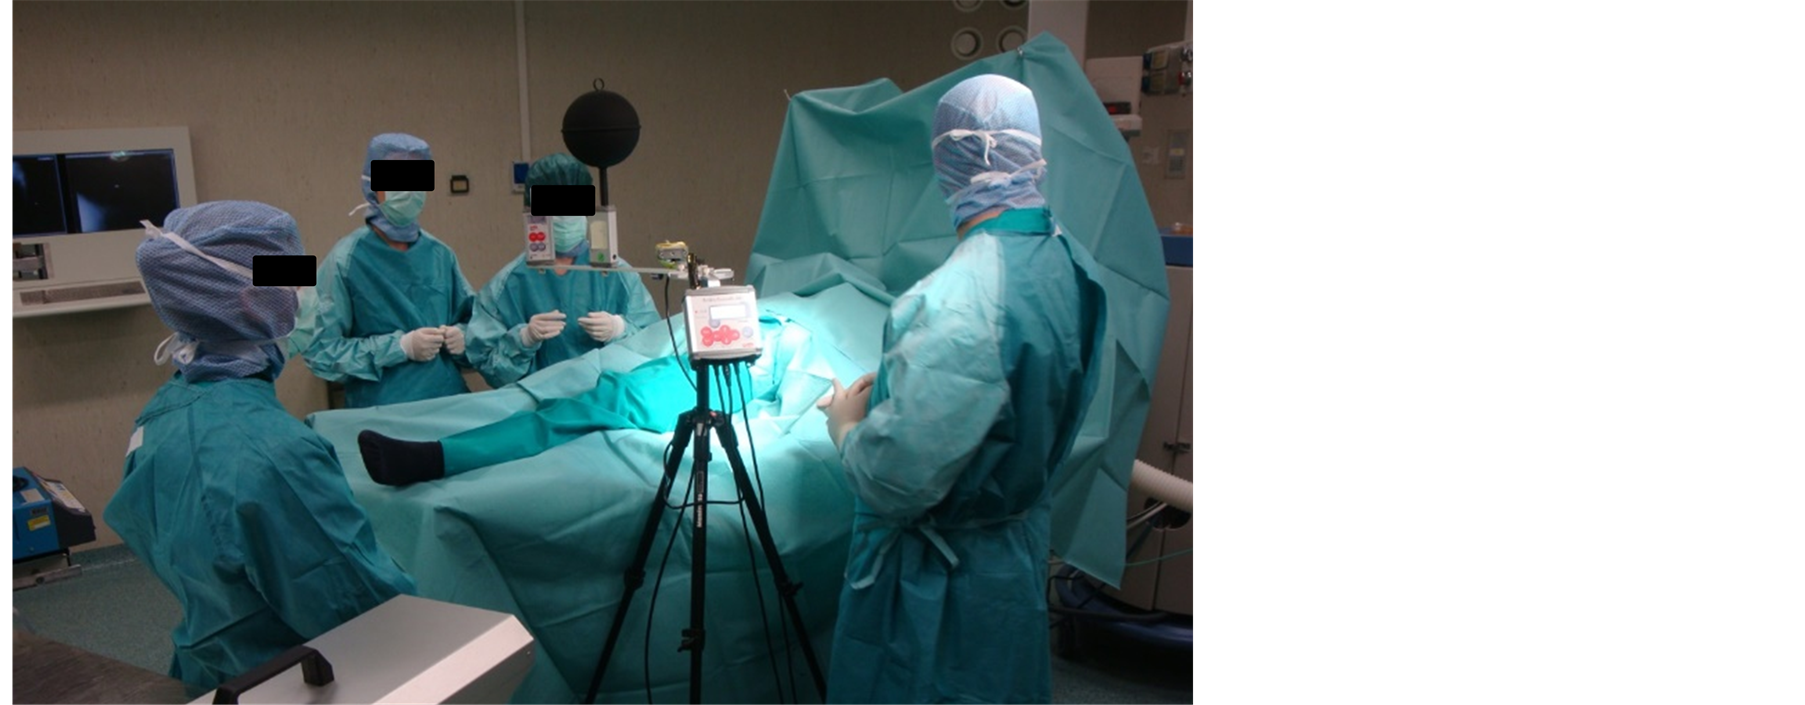
Figure 1. Medical staff (PhD students) simulating a hip surgery during the onsite investigations.

Figure 2. Indication of points used for experimental acquisitions and relative location in the chosen Cartesian system of coordinates.

Table 1. Technical data of instruments used for the experimental measurements.
are globally consistent: standard deviations are narrow, much more for temperature (less than 1˚C) than for relative humidity (less than 3 percentage points); normalized deviation does not exceed a 6% threshold in any cases. At point PT01 (under the ceiling diffusers) a detected dispersion of the experimental data appears. This becomes very significant when air velocity measurements are considered. The much more pronounced variation of the measured velocity in PT01 during operational conditions can be due to the local airflow variation induced by medical staff movements. The medical staff also produces an increase in relative humidity levels, especially in the central zone (PT01). It appears that temperature values recorded during operational conditions are slightly lower than values in at rest conditions, because the local ventilation system operates in the full working phase. Analyzing particle concentration measurements, excluding PT01 at operational conditions for particles of 0.3
Table 2 . Experimental data of microclimatic parameters and statistical parameters computed by measurements. In the table, Xav represents the generic average value upon N samples, σ is the standard deviation and X2 is the Chi-Square of Bevington error analysis.
μm diameter and PT05 at rest conditions for particles of 5 μm diameter, particle distribution for each diameter is similar for the two OT use conditions at the different measurement points. As expected, the highest particle concentration values are during operational conditions. Referring to the absolute value, the higher differences between the two OT use conditions were checked at PT05 for each particle diameter, while the lower differences were checked at PT01. Particle concentration measured at PT01 for the two use conditions of OT and for each diameter, respects the standard limit imposed by the ISO5 at rest classification [24] [27] and Grade B EU-GMP clean-rooms classification (Annex 1), in accordance with EN ISO 14644, for both at rest and operational conditions. In particular, referring to the GMP at operational conditions it can be observed that: at PT01 the conditions imposed by Grade B are respected by all the various particles (for all different diameters) at operational conditions; concentration of 0.5 μm diameter particles are inside the standard limits for operational conditions, but in particular at PT01, PT03, PT04 and PT05, it is higher than the suggested limits.
3. Numerical Modelling
The OT (120 m3 volume) exploited for experimental acquisitions was outlined for carrying out numerical simulations. The geometry of the model is reported in Figure 3. Some geometrical elements were used in order to simulate the medical staff and the patient, the lighting system (operating table, trolley and one electro-medical instrument). Two rectangular supply ceiling diffusers each of 0.56 m2 surface are located in the central zone of the ceiling. Each diffuser provides a constant flow rate of 3969 m3·h−1 of fresh air, so that there are 66 air changes per hour in the room. Two groups of 14 conical outgoing grilles (cross-section of 0.0128 m2) are arranged over two smoothed corners of the room. Following indications given in ANSI/ASHRAE Standard 62.1-2004 and in ANSI/ASHRAE Standard 55-2004, the global OT air-volume (TV) was divided into 3 zones, labelled from now on as Breathing Zone (BZ, highlighted in pink in Figure 4), Occupied Zone (OZ, highlighted in blue in Figure 4) and Peripheral Zone (PZ, corresponding to TV-OZ). This allowed the computation of air quality indexes referring to each zones.
Numerical simulation models were built-up by commercial software allowing multi-physical analyses through solution of the related governing equations by using a FE-based method. Our analyses provided solutions for air velocity, temperature, relative humidity, carbon-dioxide concentration (CO2), mean age of air and particulate
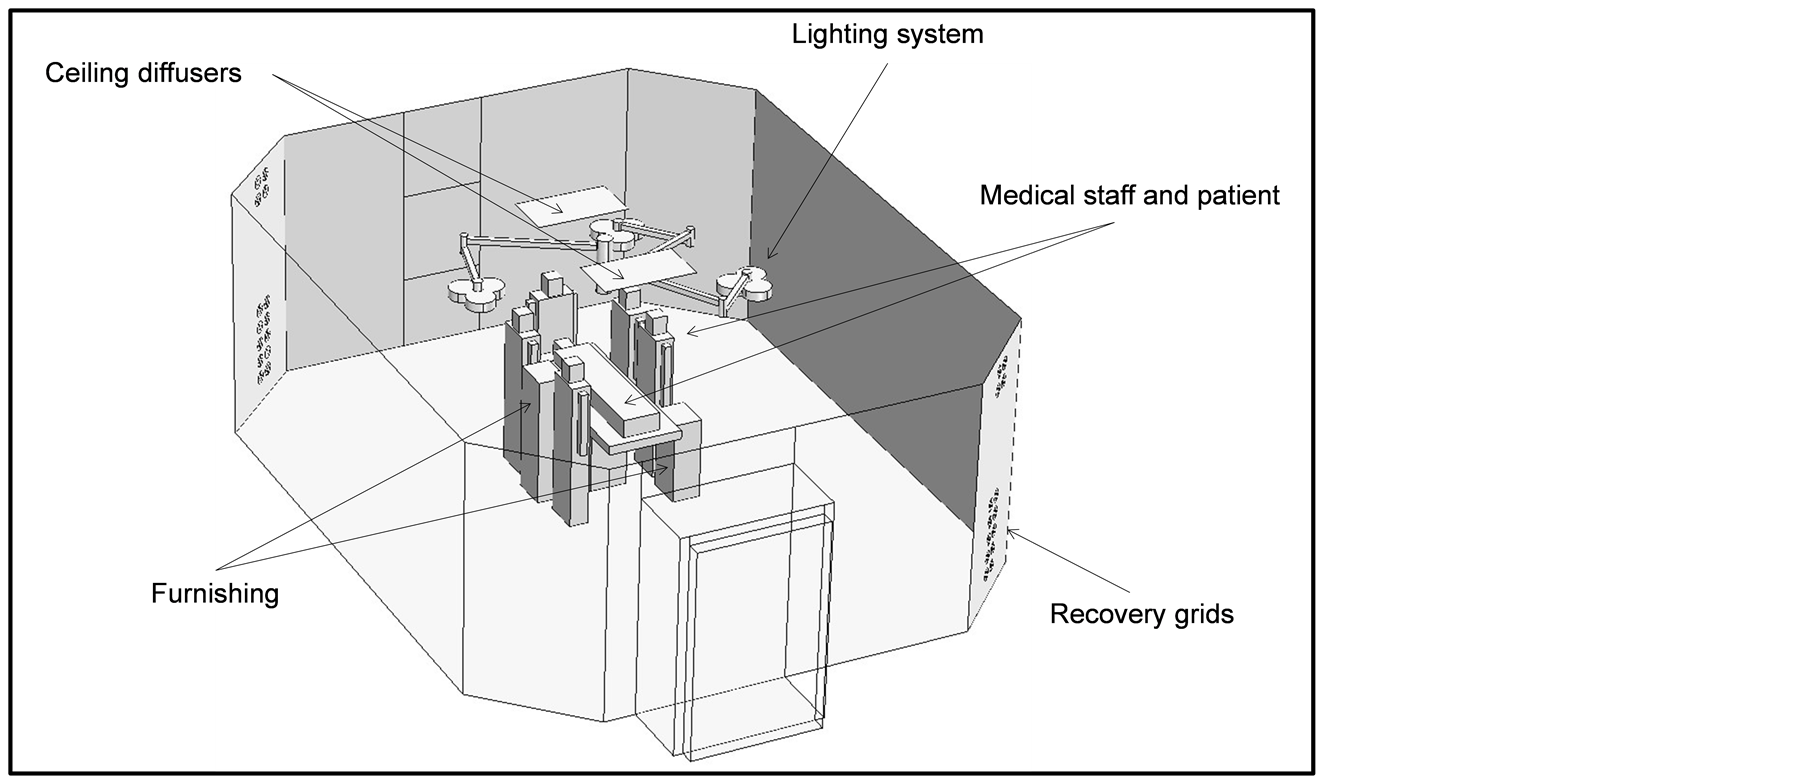
Figure 3. Geometry of the numerical model.
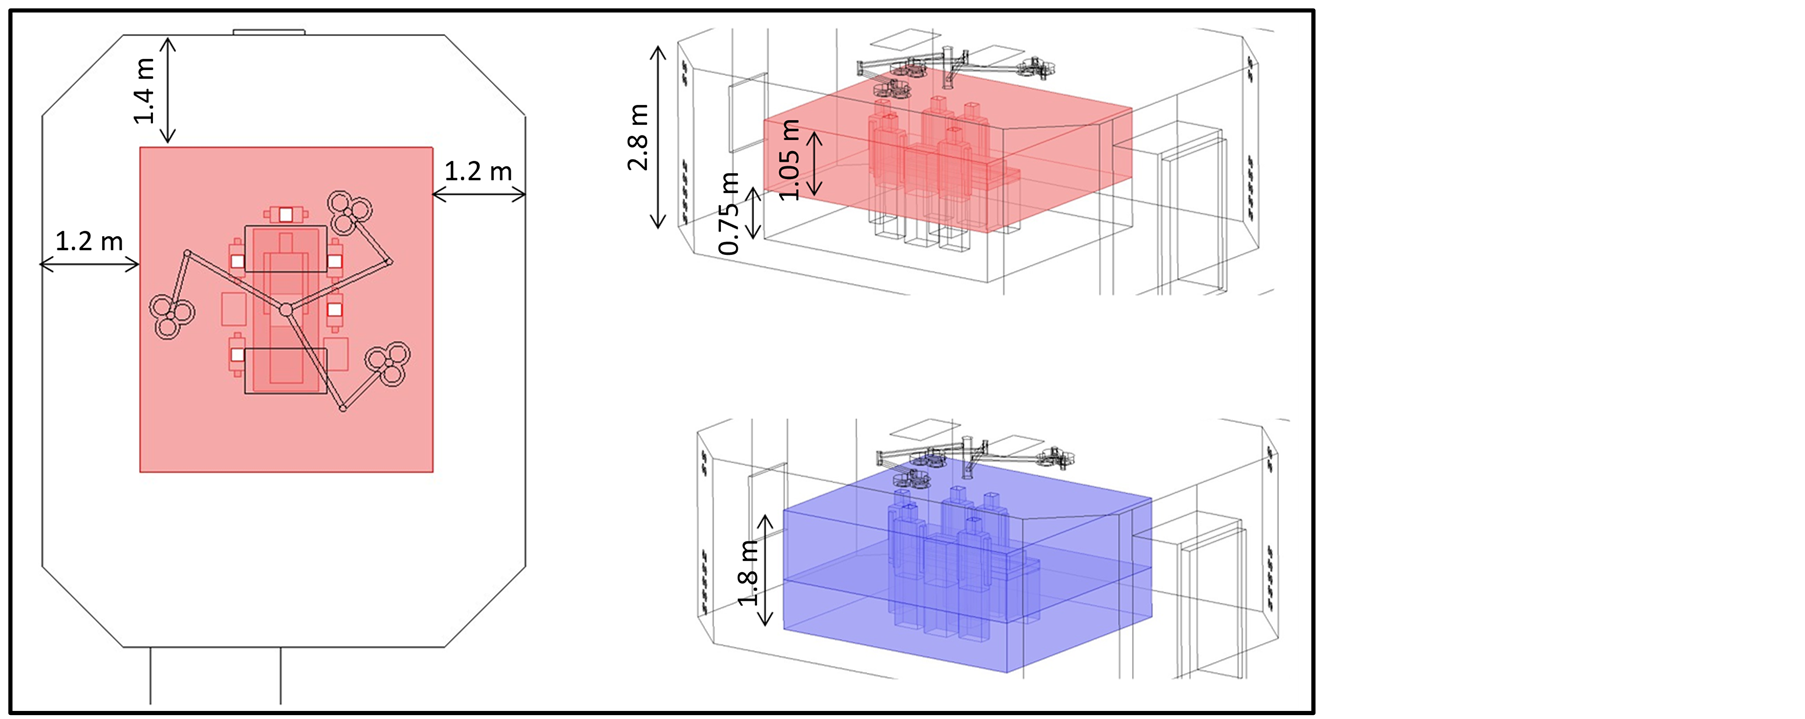
Figure 4. Indication of BZ (pink) and OZ (blue).
concentration for diameters 0.4, 0.75, 3 μm. These dimensions represent the average particle diameter referring to the particle diameter range that were experimentally measured ((0.3 - 0.5 μm); (0.5 - 1 μm); (1 - 5 μm)). The basic formulation of the PDE used for computations is:
 (1)
(1)
where ρ is the fluid density and  is the velocity vector. For fluid-dynamical analysis, we considered a RANS approach for Newtonian fluid and incompressible flow, where a standard k-ε method is applied to solve turbulence. Table 3 shows the analytical formulation of the different terms appearing in Equation (1), depending on the specific physic referring to.
Considering particulate diameters higher than 0.01 μm, Brownian diffusivity was considered negligible with respect to turbulent diffusivity that was assumed to be equal to the kinematic turbulent viscosity of air [28] . Adopting an Euler approach for solving particle concentration, the following settling velocity was added to the vertical component of the transport vector:
 (2)
(2)
Cc being the Cunningham coefficient, ρp and dp the particulate density and diameter, respectively. Source terms and values of physical properties appearing in conservation equations are listed in Table4
Table 3. Analytical formulation of terms appearing in Equation (1), depending on the specific physic referring to.
Table 4. Physical properties of materials and source term values.
For supplied air at the ceiling diffusers we assumed the following first-type boundary conditions: velocity magnitude (1.97 m/s), turbulence intensity (5%), temperature (18˚C), relative humidity (60%), CO2 (350 ppm) and mean age of air (0 s). For modeling persons breathing, we assumed a sinusoidal trend for inhaled/expired air and for CO2 emission rate into the room. In steady state simulations, we used the corresponding root mean square values as magnitude for chosen air and CO2 flow rate at the nose holes of the medical staff and patient. Adopted values in simulations were 2.0 m3/h (medical staff) and 0.3 m3/h (patient) for breathed airflow and 0.080 m3/h (medical staff) and 0.012 m3/h (patient) for CO2 emission rate. Outflow conditions were considered for all dependent variables at the recovery grids. At each solid/fluid interface, logarithmic wall functions were applied in the near wall airflow that was considered parallel to the wall and being in a wall offset equals one hundred viscous units. Turbulent production was assumed to equal dissipation at walls. For the remaining dependent variables we assumed impermeable/insulation conditions at walls, except in thermal analysis, where we applied a convective thermal flux, considering a heat exchange coefficient of 7.7 (W/m2·K) and a constant temperature of 20˚C for adjacent rooms. The occupants contribution for particle emission rate was applied as a boundary flux [particle/(m2∙s)] at the occupants/surrounding air interfaces. The procedure adopted to assess the particulate flux depending on the particle dimension is explained in the next section. The governing equations together with their boundary conditions were spatially discretized on non-structured grids, made of second order tetrahedral elements. Steady state solutions of discrete equations were carried-out by applying an iterative dumped Newton-Raphson scheme [29] based on the discretized PDE linearization by a first-order Taylor expansion. Algebraic systems of equations coming from differential operator discretization were solved by a PARDISO package, a direct solver particularly efficient to solve unsymmetrical sparse matrixes by a LU decomposition method. The convergence criterion was set to 1E-5. Time integration of governing equations for transient simulations was performed applying an Implicit Differential-Algebraic (IDA) solver [30] , which uses variable-order and variable-step-size Backward Differentiation Formulas (BDF). Because the time-marching scheme is implicit, a nonlinear system of equations must be solved at each time step. The above-mentioned Newton algorithm was exploited to solve this nonlinear system of equations. Test grids were preliminarily carried out in order to adequately refine the computational grid to obtain mesh-independent results. All computations were carried out on a workstation with two 64-bit 6-core/12-thread processors speeding up to 2.3 GHz of frequency and handling 128 GB of RAM.
4. Use of Experimental Data for Numerical Model Implementation and Validation
Experimental data were exploited both to provide data used for numerical model implementation and check simulation results reliability and validity. Microbiological measures of particle concentration were used to assess particle emission rates imposed as boundary conditions in the numerical models. Particle emission rate per person, distinguished for dimension, was not known a priori during our research. Zhao et al. [20] considered a constant generation rate of 0.0916 μg/s per person for each particle size group. For each particle dimension, referring to an assumed particle density of 1.05E-6 μg/μm3, scaling the emission rate by the particle volume, it is possible to obtain the related number of particles emitted by a person in the time unit. Quian et al. [19] used a different method to assess particulate emission rate, divided for different diameter, caused by the occupants in a classroom. They experimentally measured the particulate concentration at specific locations in the classroom for similar environmental conditions, but with and without people presence. They argued that difference in acquisitions could be attributed to emissions due to occupant contribution, and then proposed a particulate emission distribution as a function of particle diameter. The emission rate refers to how many particles of a specific dimension are supplied by one person in the time unit to the surrounding environment. The two above mentioned approaches used for particle source evaluation caused by occupants provide different results. In our investigation, we evaluated particle emission due to each occupant, differentiated for diameter dimension, exploiting the experimental acquisitions of particle concentration in the real OT with and without patient and medical staff presence. In particular, we applied a similar method used in [19] to assess the particle emission rate by occupants to be exploited in the numerical models. Otherwise, in our case we combined the available experimental data with results coming out from numerical simulations to assess the emission rate of particles per person depending on the particle dimension. The procedure used is given in the flow-chart diagram of Figure 5: the caption “sampling points” refers to points PT01, PT02, PT04 and PT05, “particle diameter range” means (0.3 - 0.5 μm); (0.5 - 1 μm); (1 - 5 μm), and “average particle diameter” refers to the average values of the particle diameter (0.4; 0.75; 3 μm) computed for each of the previous ranges. Then the distribution of emission rate by occupants as a function of particle dimensions was assessed.
Comparison between experimental and numerical particles concentration due to occupants in the OT is shown in Figure 6. In this figure, experimental value (EXP) for each diameter (di) represents the difference between average data (Av) acquired for the at rest (rest) and operational (oper) conditions, computed as follows:

While the error bars are plotted by assuming the following:


Numerical values plotted refer to the “final” particle emission rate per average diameter applied to the exposed person surfaces carried out from application of the computing procedure shown in Figure 5. Values of emission rate for diameter range are otherwise presented in Table 5, where values suggested in the previous literature are also reported. Some remarks follow. Despite an iterative application of our proposed “guess and check” procedure, experimental/numerical difference in particle concentration at point PT01 (under the ceiling diffusers)
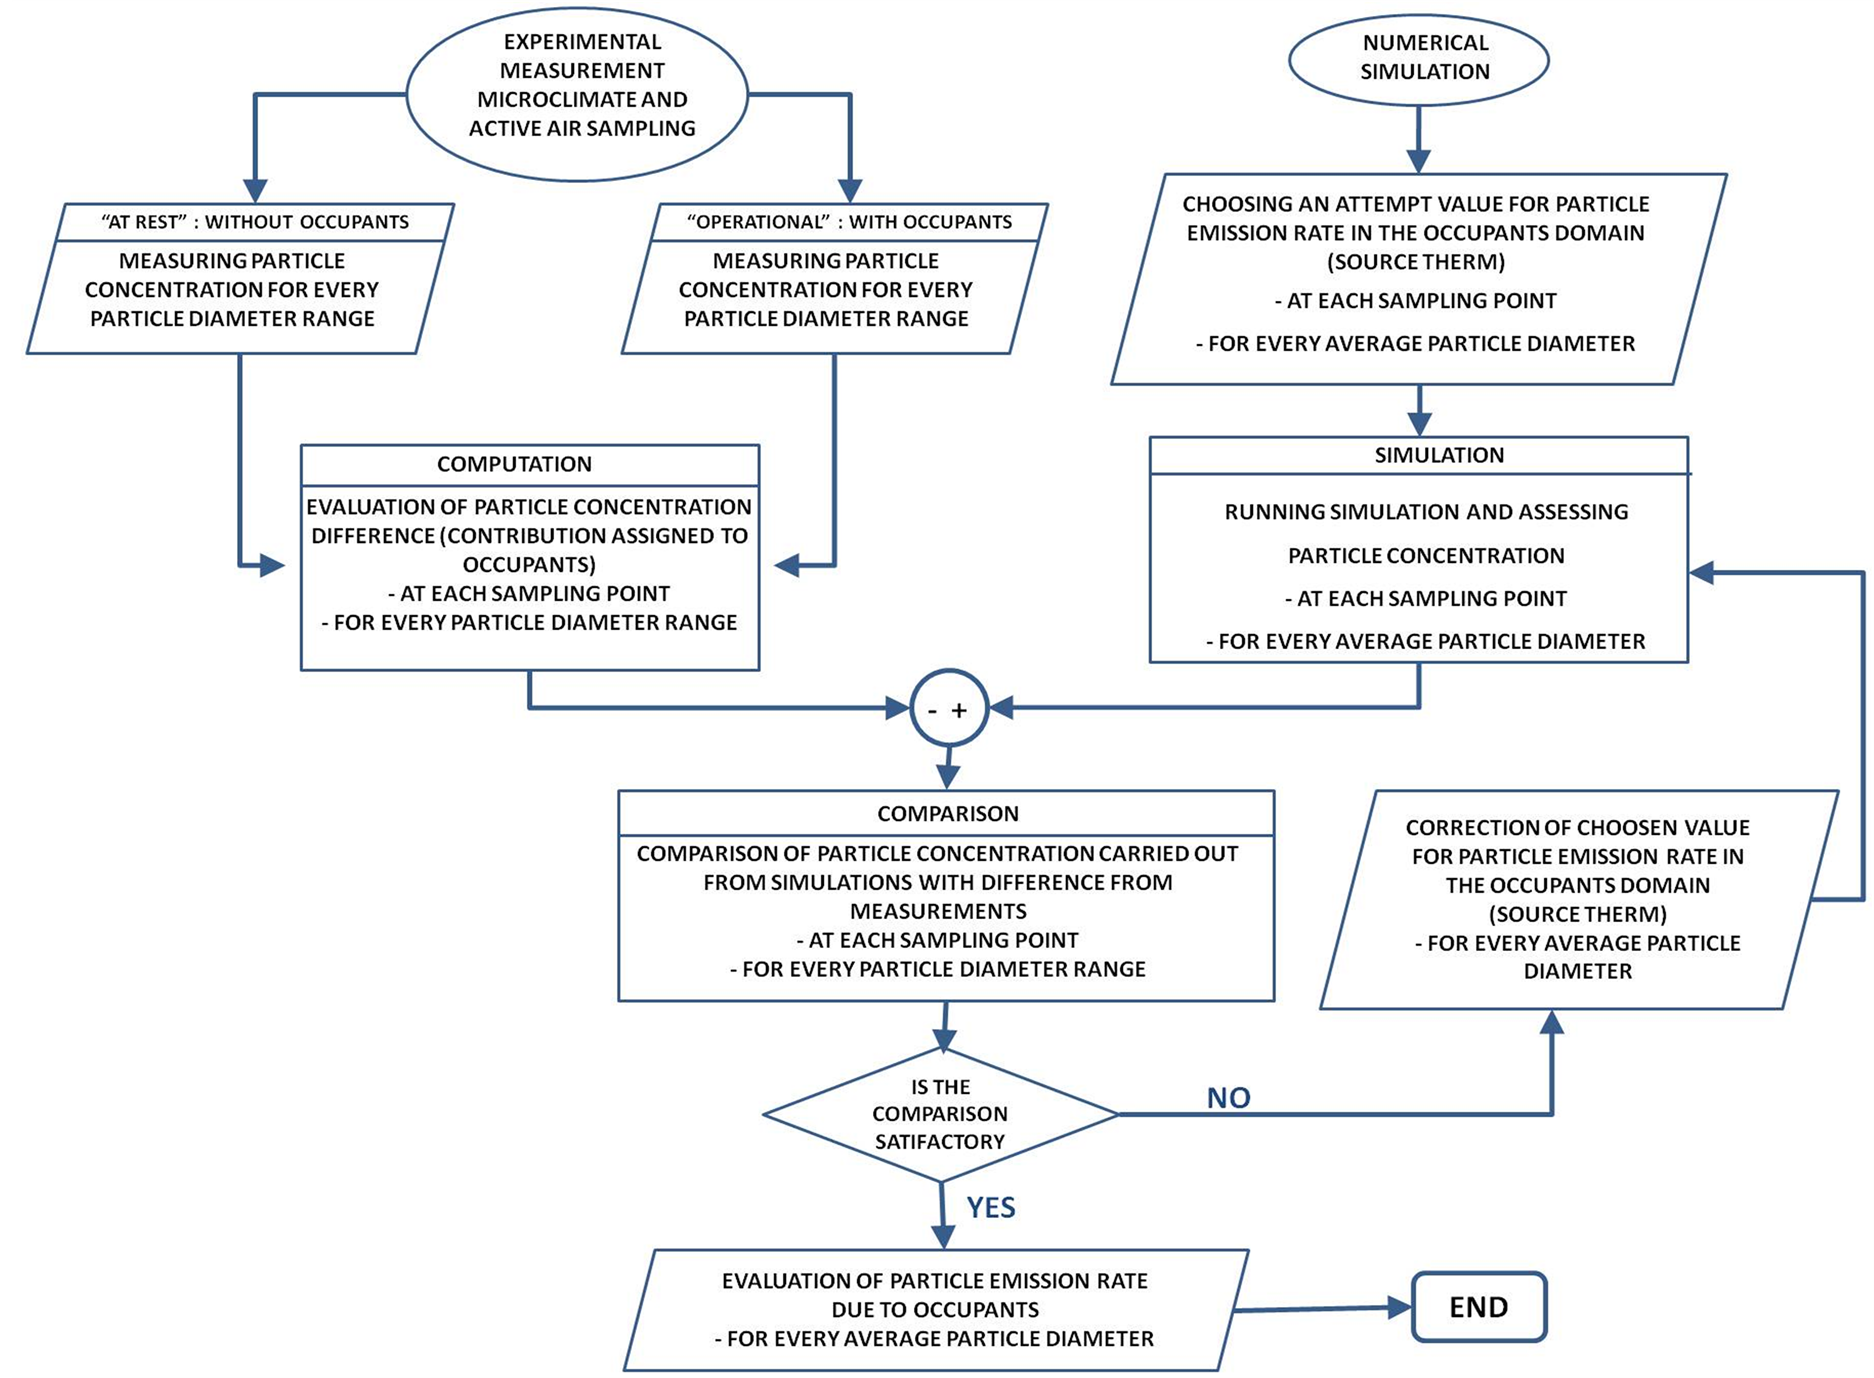
Figure 5. Flowchart of method used for estimating the occupants’ particle emission rate per diameter by an iterative crosscomparison between numerical and experimental data.
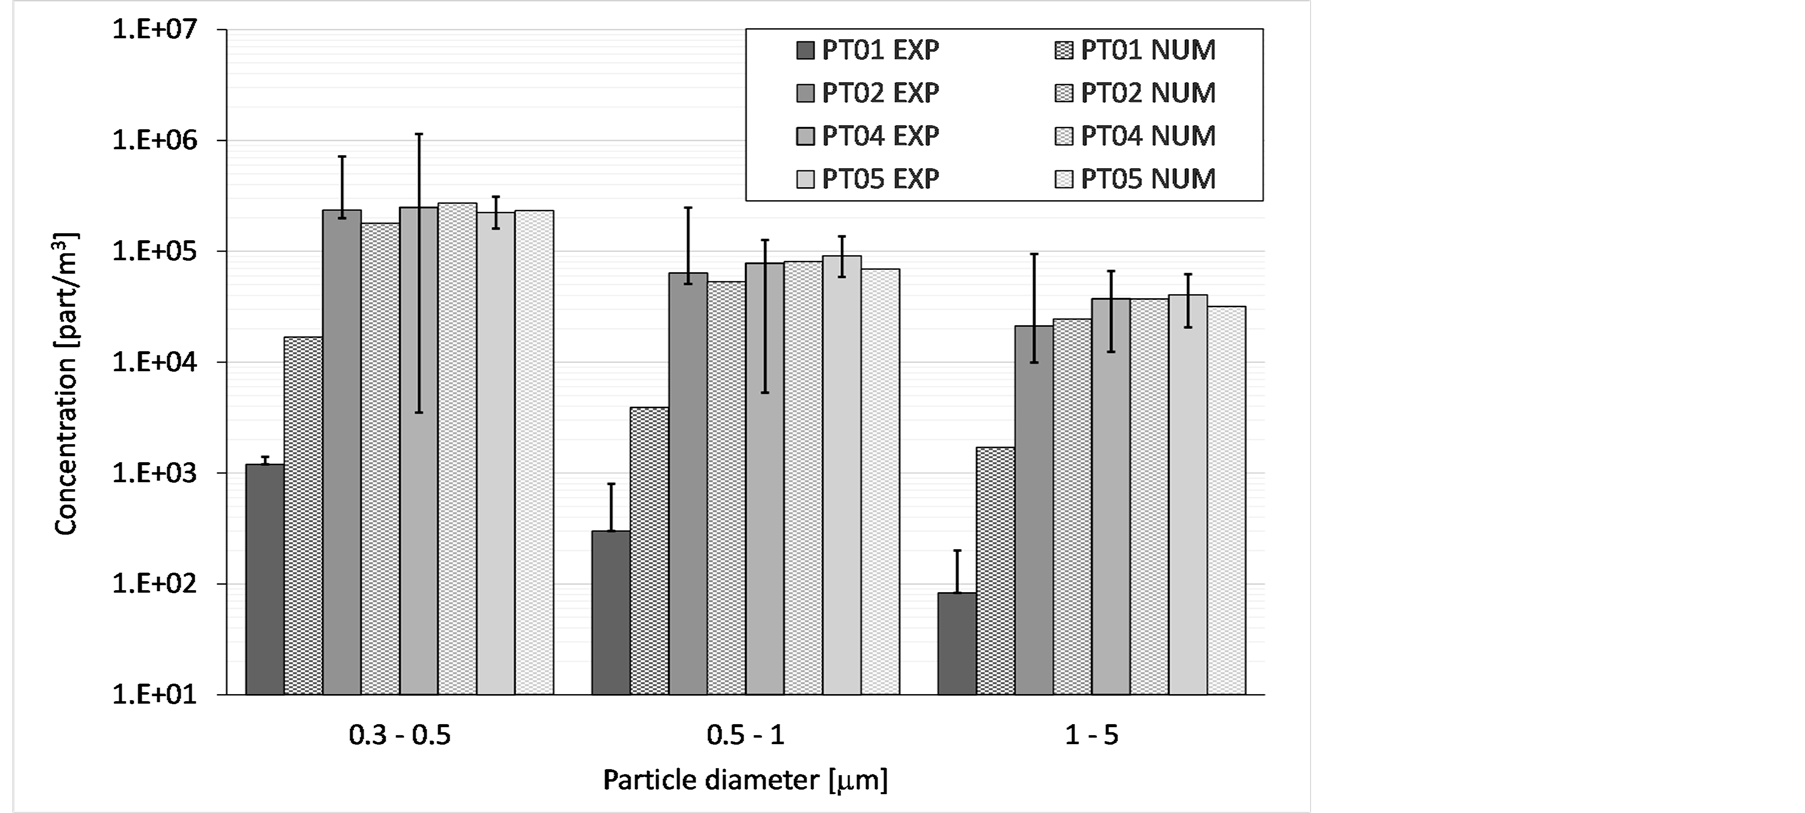
Figure 6. Particles concentration per diameter in different locations: comparison between experimental (plain colour bars) and numerical (chequered bars) values.
remained quite high; in particular, numerical model overestimates the particle contents in air at this location. Otherwise, a good agreement can be pointed out from comparison of particle concentration at the other different locations. Obtained results of particle emission rate per diameter and per person (Table 5), provide lower values with respect to those proposed by Quian et al. However, this was an expected result, because measurements by Quian [19] refer to a different indoor environment (university classroom) with different use conditions, occupied by students wearing “normal” clothes, very different from medical staff special clothing (see Figure 1). Microclimatic measurements were exploited to check the numerical modeling and results validity. Figure 7 shows comparison between experimental and simulated data on a T-RH plane for each measurement point: different colors concern different location of the experimental measurement points and the corresponding numerical values of the considered parameters.
A good agreement can be noted between microclimatic experimental data with numerical results with relative differences lower than 10%. Numerical values globally stand within the range of measurement variation, foregrounding a good agreement with the experimental data. Comparison between microclimate experimental data with average parameter values suggested by Italian and International standards showed that [31] -[37] the average temperature values at probe locations are within the suggested limits. This is always confirmed for the “at rest” condition, but for the “operational” one the acquired values exceed the recommended thresholds due to medical staff presence and movements that produce local temperature and airflow modifications. The air velocity values globally fit standard limits, suggested for unidirectional flow.
5. Results
5.1. Microclimate and CO2 Distribution
This section aims to present and discuss simulation results. Two slides (vertical and horizontal, Figure 8) are selected to show the velocity field and one slice for the thermal map (horizontal, Figure 9). The high supply air velocity from unidirectional vertical down toward the surgical site, overcomes the buoyancy forces of the thermal plume from surgical staff around the surgical table. Near the wound site the air velocity is higher than 0.25 m/s (Figure 8), even if the air velocity field is slightly deformed by thermal effect due to surgical lights. Thermal field inside the room is locally changed by surgical staff presence, equipment and surgical lights. However, the air temperature in the operating zone is less than 23.5˚C and 20˚C around the surgical table (Figure 9). In
Table 5 . Particle emission rate (particles/s) from persons differentiated by diameter.
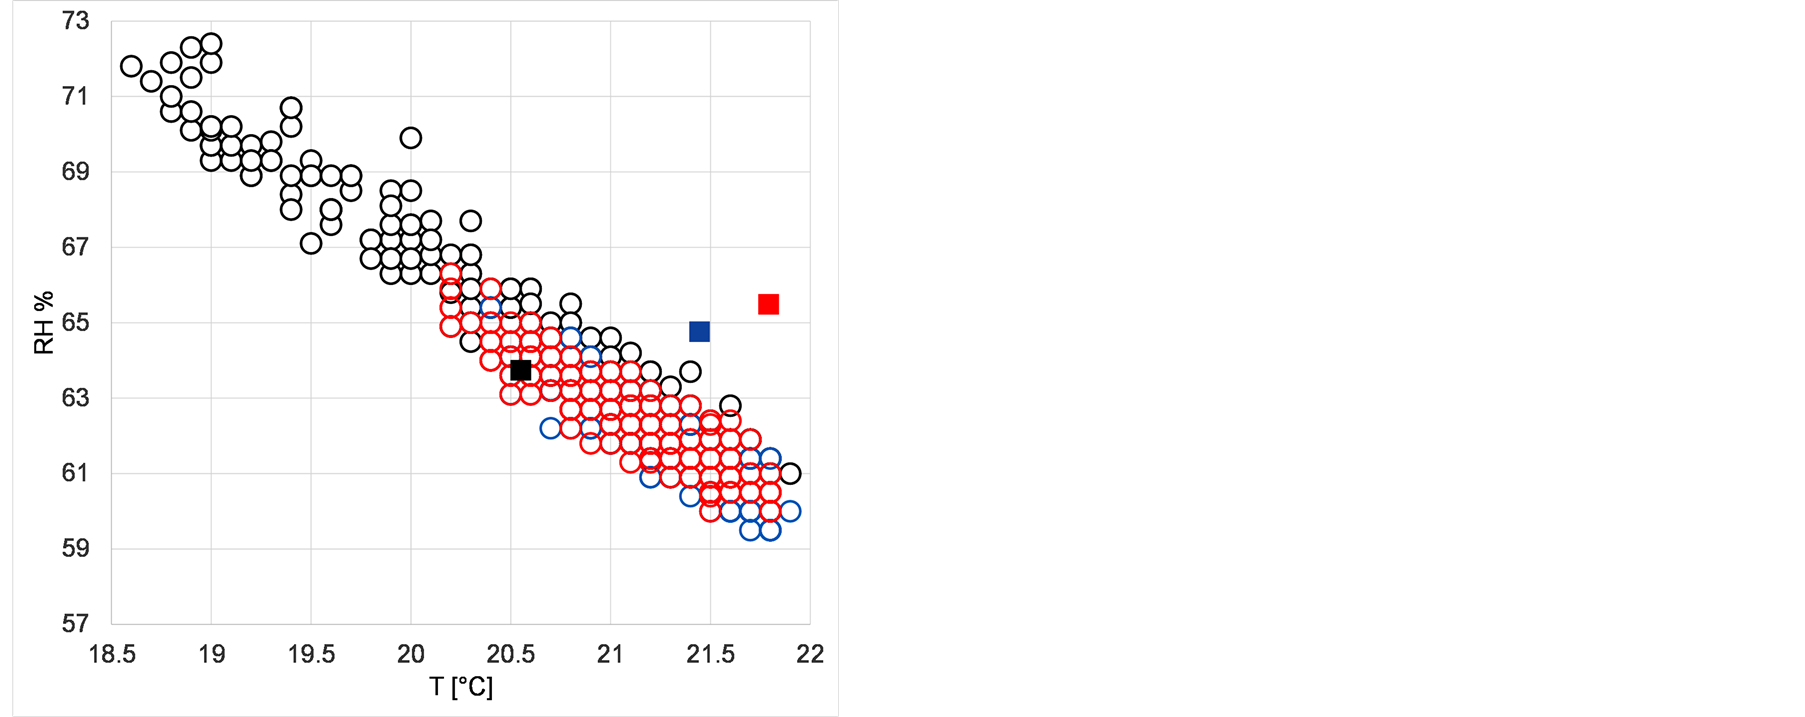
Figure 7. Comparison between experimental (circled) and simulated (squared) data on a T-RH plane for PT01 (black), PT02 (blue) and PT03 (red).
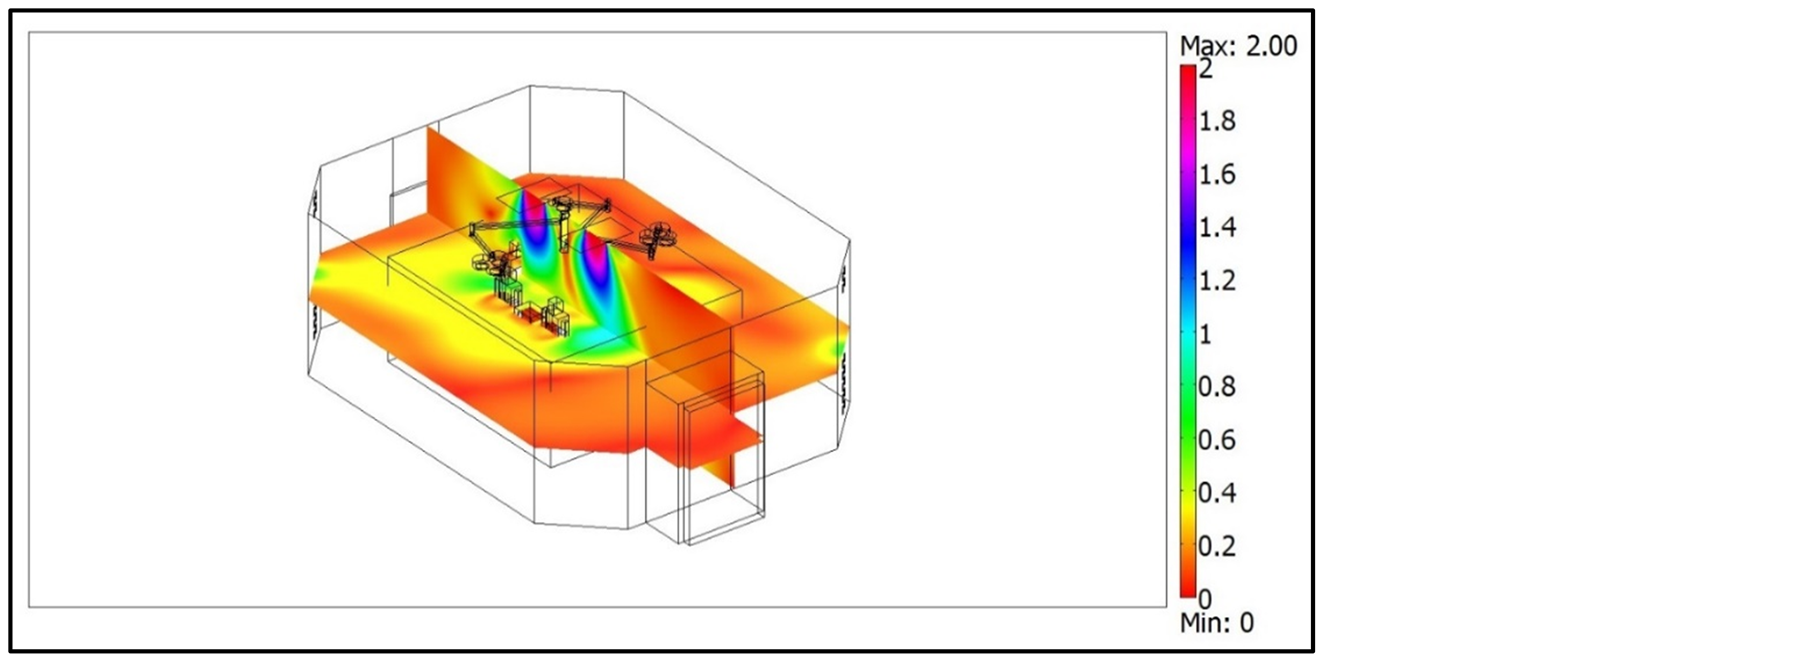
Figure 8. Air velocity field (m/s) on vertical slice (x = 3.0) and horizontal slice (z = 1.2).
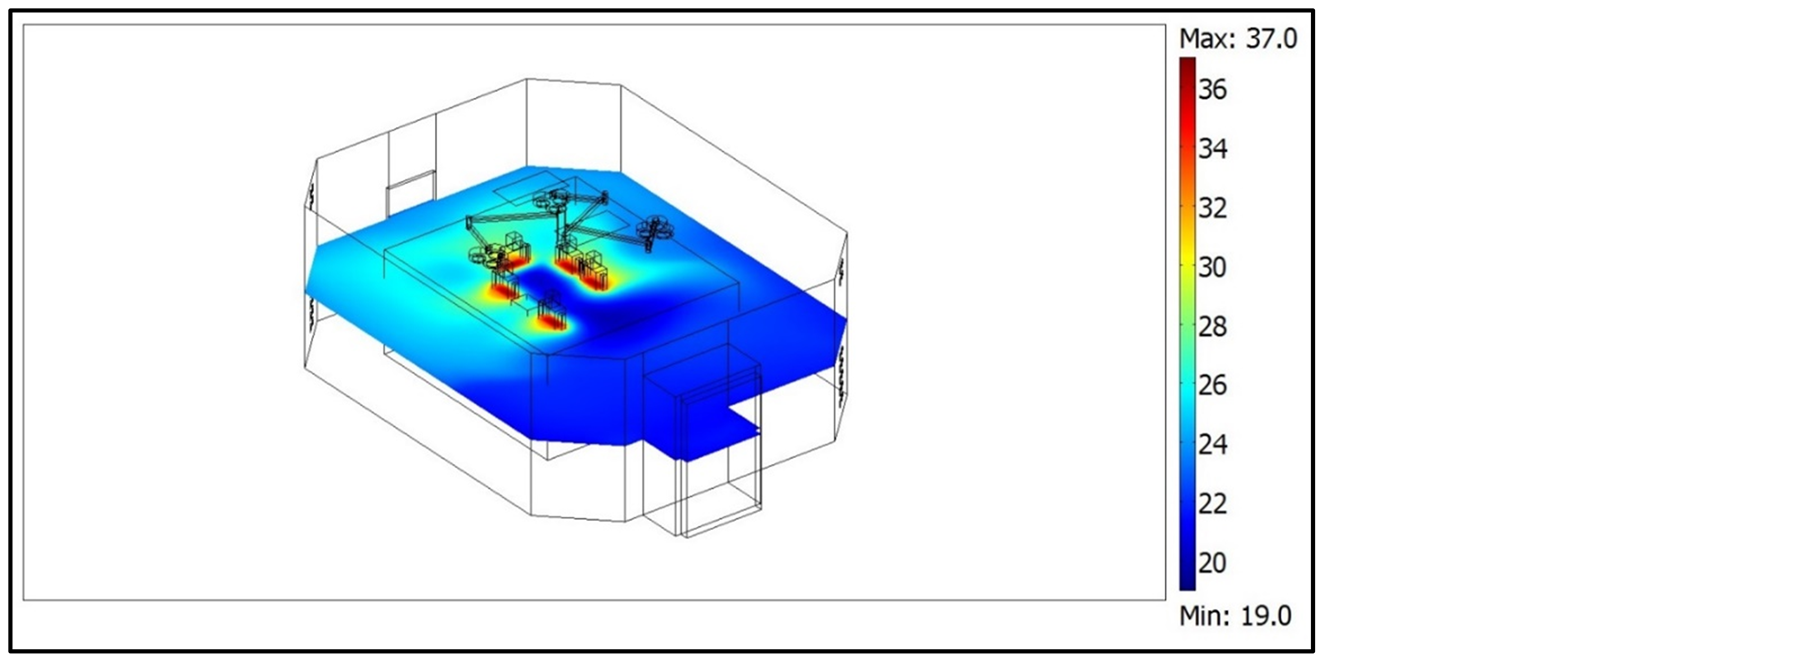
Figure 9. Air temperature distribution (˚C) on horizontal slice (z = 1.2).
Figure 10 the air relative humidity distribution is shown on a horizontal section of the room. The transport effect of the flow field is particularly evident: away from the surgical site thermal plume is not present and not even strong enough to rise up towards the ceiling, then air temperature and relative humidity stratification are not present in the global OT volume. Referring to the air freshness concept, the CO2 concentration shown in Figure 11 on a horizontal plane, is considerably below the critical limit of 3000 parts per million (ppm) in the global room volume and 1000 ppm in the operating table zone.
The CO2 concentration is high only in the breathing zone where staffs are exhaling. The driving effect due to the velocity field is preponderant in spatial distributions of the scalar variables (temperature, relative humidity and CO2 concentration), so that a considerable similarity can be pointed-out in the parameter value distribution obtained. The simulation results obtained for CO2 concentration and its distribution in the BZ and OZ, but also in the PZ and in the total volume of the OT, are in agreement with those provided by recent studies [38] [39] . Results provided in Figure 11 show that there is a significant increase in the CO2 concentration from the fundamental zone BZ, to the OZ but progressively to the PZ and TV.
5.2. IAQ Indexes
In this section, some IAQ indexes are computed using simulation results and discussed. The proposed indexes are usually applied for IAQ assessment and a quantitative evaluation of ventilation systems performance with regard to contaminant removal and infection risk control [40] -[42] . Once the distribution of the dependent variables inside the OT, i.e. air velocity, CO2 and particle concentration, were evaluated by simulations, IAQ indexes were calculated. Some of them were expressed in the form of a continuous distribution (local indexes), others refer to the average values of dependent variables in BZ, OZ, PZ and TV. The first investigated IAQ parameter is the mean age of air (τ) that quantifies the average lifetime of air at a particular location of the room
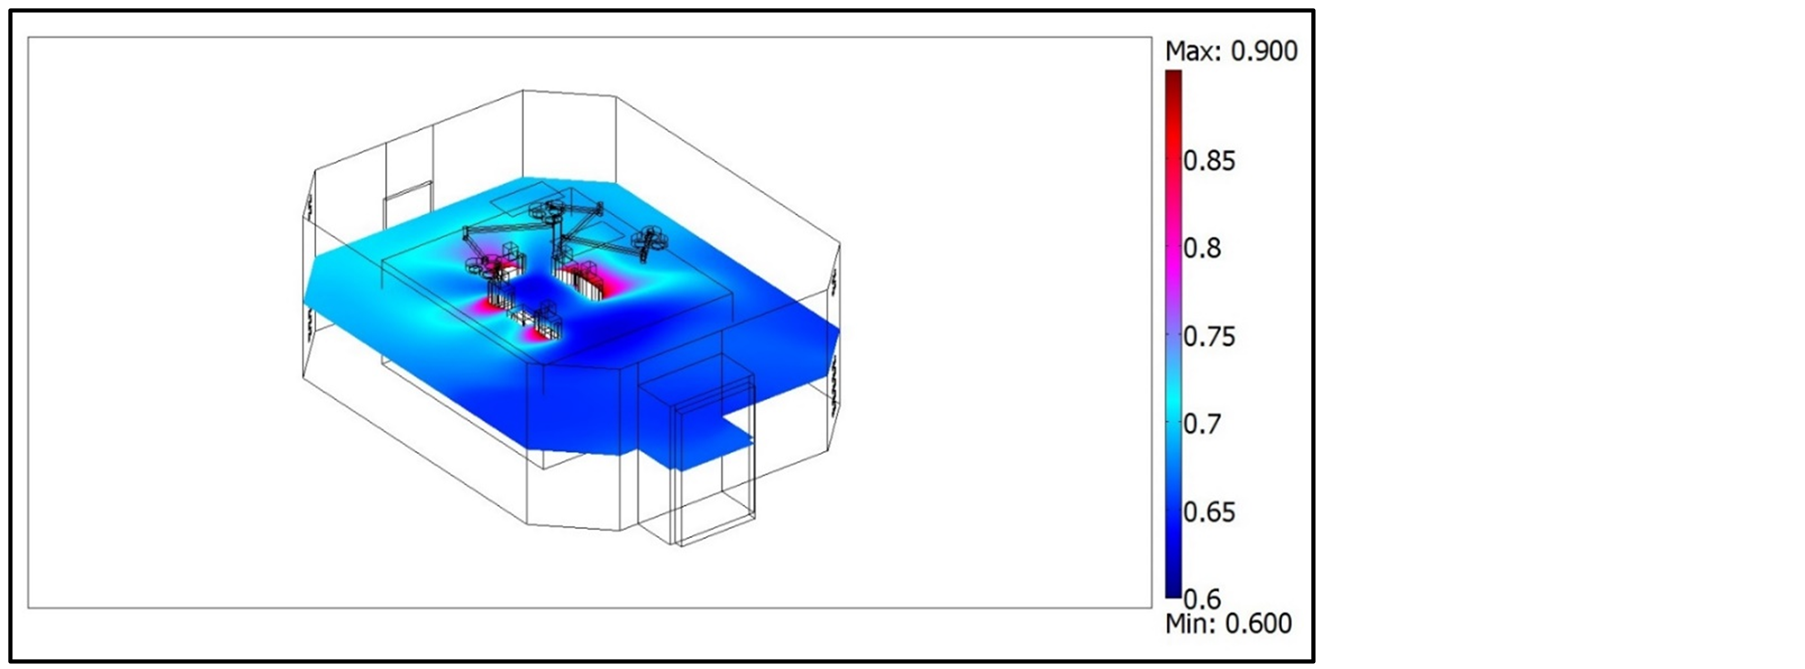
Figure 10. Relative humidity (%) distribution on horizontal slice (z = 1.2).
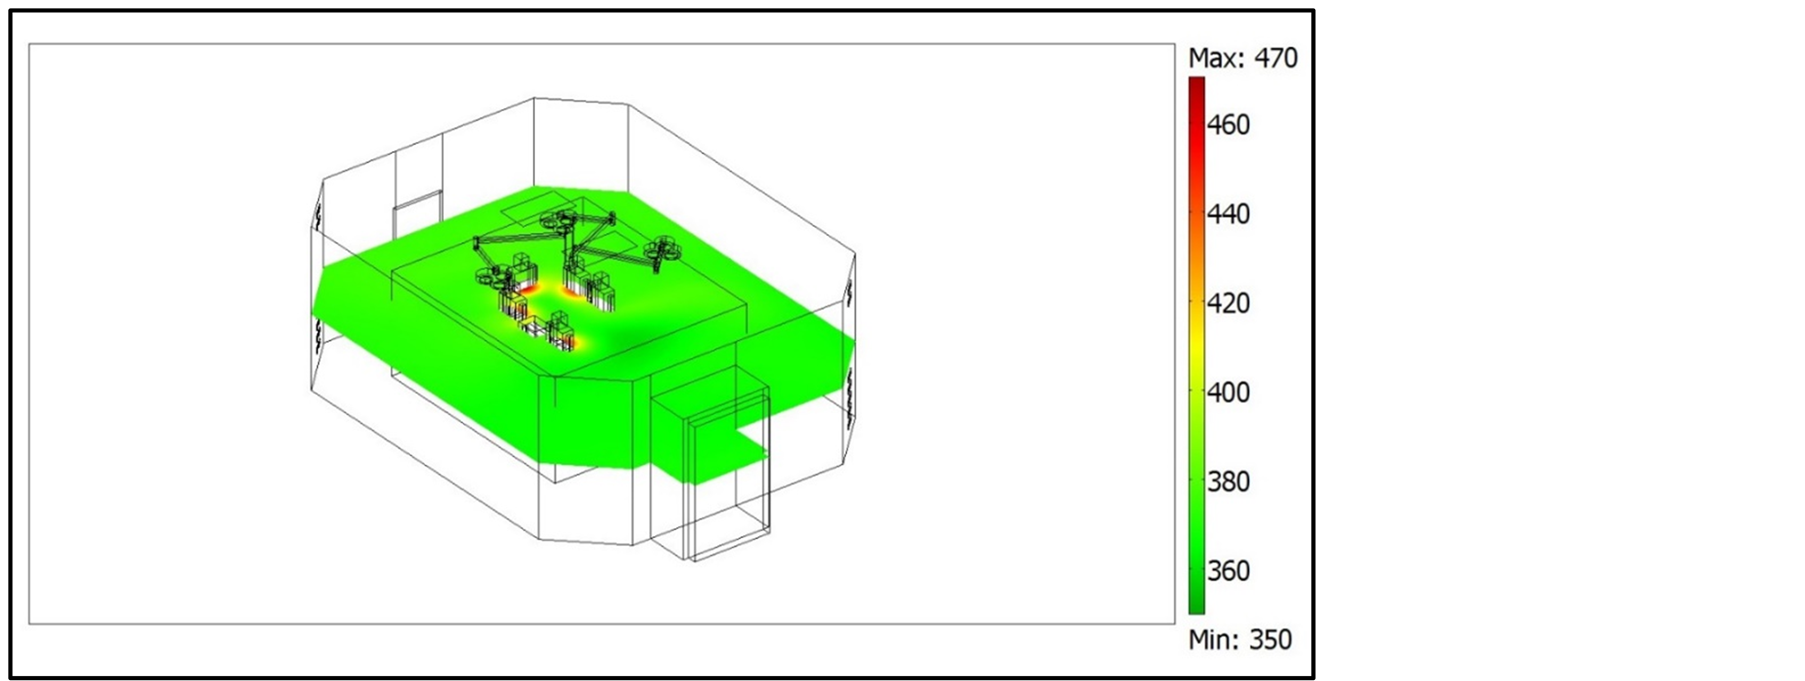
Figure 11. CO2 concentration (ppm) on horizontal slice (z = 1.2).
[43] -[45] for a steady airflow achieved. The air age concept is generally defined as the average time for air to travel from a supply inlet area to any location in a forced ventilated room [46] -[49] . The mean age of air was calculated as well as a dependent variable, as explained in the modelling section. It provides a measure of air freshness, so its lower values are more favorable. At the inlet opening it was assumed to be zero (100% fresh). The τ parameter trend was controlled during a transient simulation of 1800 seconds, starting from an initial state corresponding to the steady state condition discussed in the above section. Figure 12 shows a spatial distribution of τ in a horizontal and in a vertical slice of the room, once the transient time to achieve the steady state is expired. From this figure, it can be pointed out that the lifetime of air located in the central portion of the OT is much lower than that one concerning the peripheral portion of the room.
In order to quantify this result, the average value of τ was computed in the OT different zones (i.e. BZ, OZ, PZ, TV), and called as , where Zj means the generic j-zone (Table 6). Generally, these values are quite low. Comparison of these values with the theoretical residence time of air inside the OT (defined as the ratio between the total volume of the room (
 , m3) and the mass flow rate of incoming ventilating air (
 , m3/s)), shows that the ratio is always higher than 1. Indeed, this comparison consists in computing the following Air Change Efficiency (ACE) index:
 (3)
(3)
whose values in the different zones are given in Table6 The ACE index measures how effectively ventilation systems replace the air in a room with fresh air. In the BZ, the average lifetime of air is more than 2 times lower than the theoretical residence time (about 53.7 seconds) that can be deduced analytically.
Table 6. Values of mean age of air and Air Change Efficiency in the different zones.
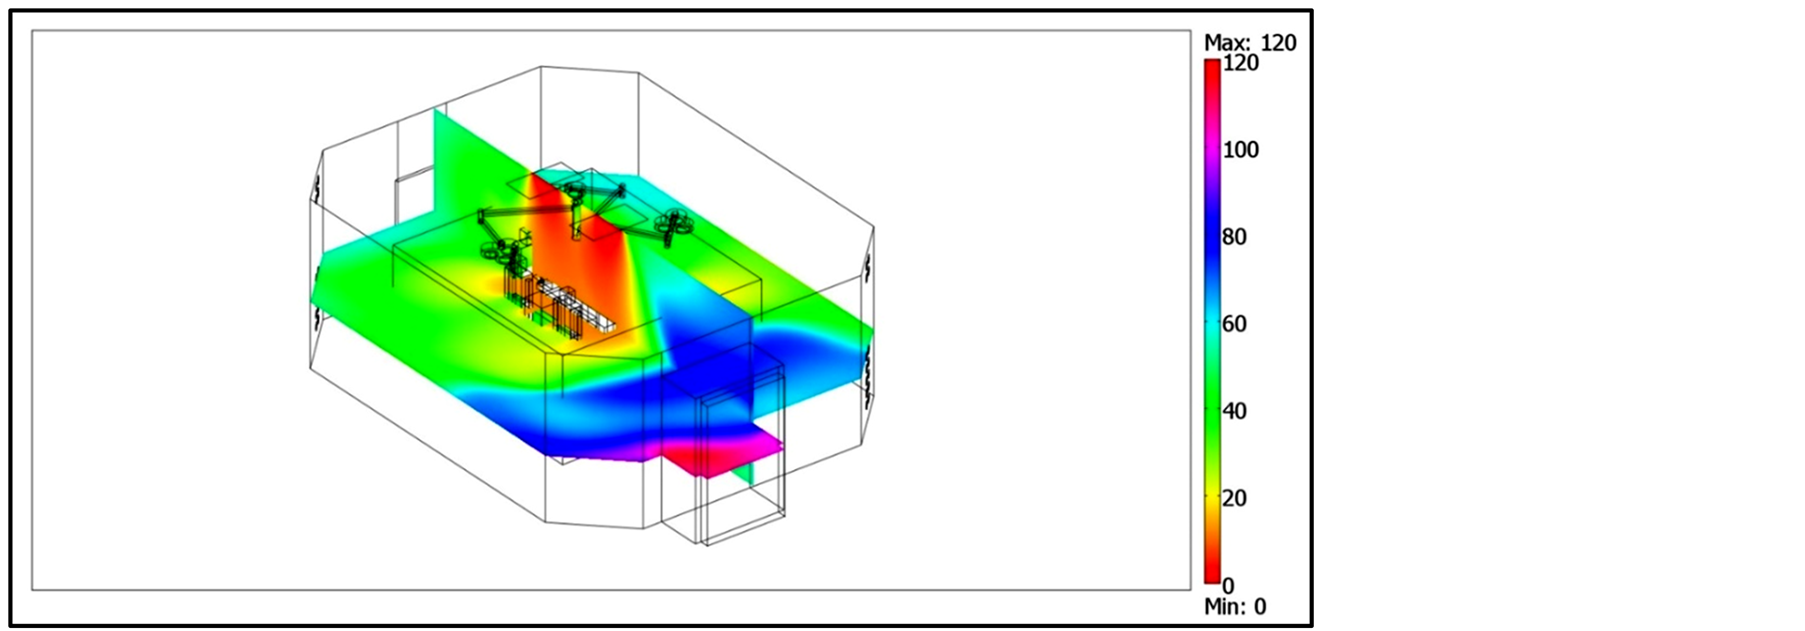
Figure 12. Mean age of air in horizontal (z = 1) and vertical (x = 3.0) slices.
The Local Air Change Efficiency (LACE) is expressed by the following expression:
 (4)
(4)
The LACE index characterizes the conditions at a specific point (defined as the ratio between the minimum replacement time, as previously defined, and the local mean age of the air). It is possible to observe (Figure 13) that the zone corresponding to the operating table is more favorable from this point of view, reaching LACE values of up to 500% - 600%.
Knowing the concentration field computed for CO2 and particles, we also assessed the Ventilation Effectiveness (VE) index. The VE index measures how quickly a contaminant is removed from an air volume by quantifying the efficiency with which the internal pollutant is diluted or removed. It depends on the airflow patterns, and is expressed as follows:
 (5)
(5)
where  is the mean value of contaminant concentration (i.e. CO2 and particles) calculated at the air-recovery grilles (Exhaust), CS is the contaminant concentration at the air inlet diffusers (Supply) and
  is the mean value of the contaminant concentration in a specific OT zone (i.e. BZ, OZ, PZ, TV).
Similarly, the Contaminant Removal Effectiveness (CRE) index is defined as the ratio between the concentration of contaminants at the exhaust point and the mean value of contaminant concentration within a specific zone. Its equation is defined as follows:
 (6)
(6)
Figure 14 shows the VE and CRE indexes computed using CO2 and particle concentrations. Because of particle concentration value was assumed to be zero at the inlet air diffusers (CS = 0), VE and CRE expressions correspond to each other. Because of the very low effect of the settling velocity on particle concentration distribution, a very low quantitative difference was found in computing the CRE (or VE) index as a function of the different particle diameter ranges studied. Therefore, we referred to a single CRE index representative for any particle diameter range studied. Values of the computed global indexes are shown in Figure 14 (CO2) and Figure 15 (particles). The CRE distribution at a specific point that is known as Local Contaminant Removal Effectiveness
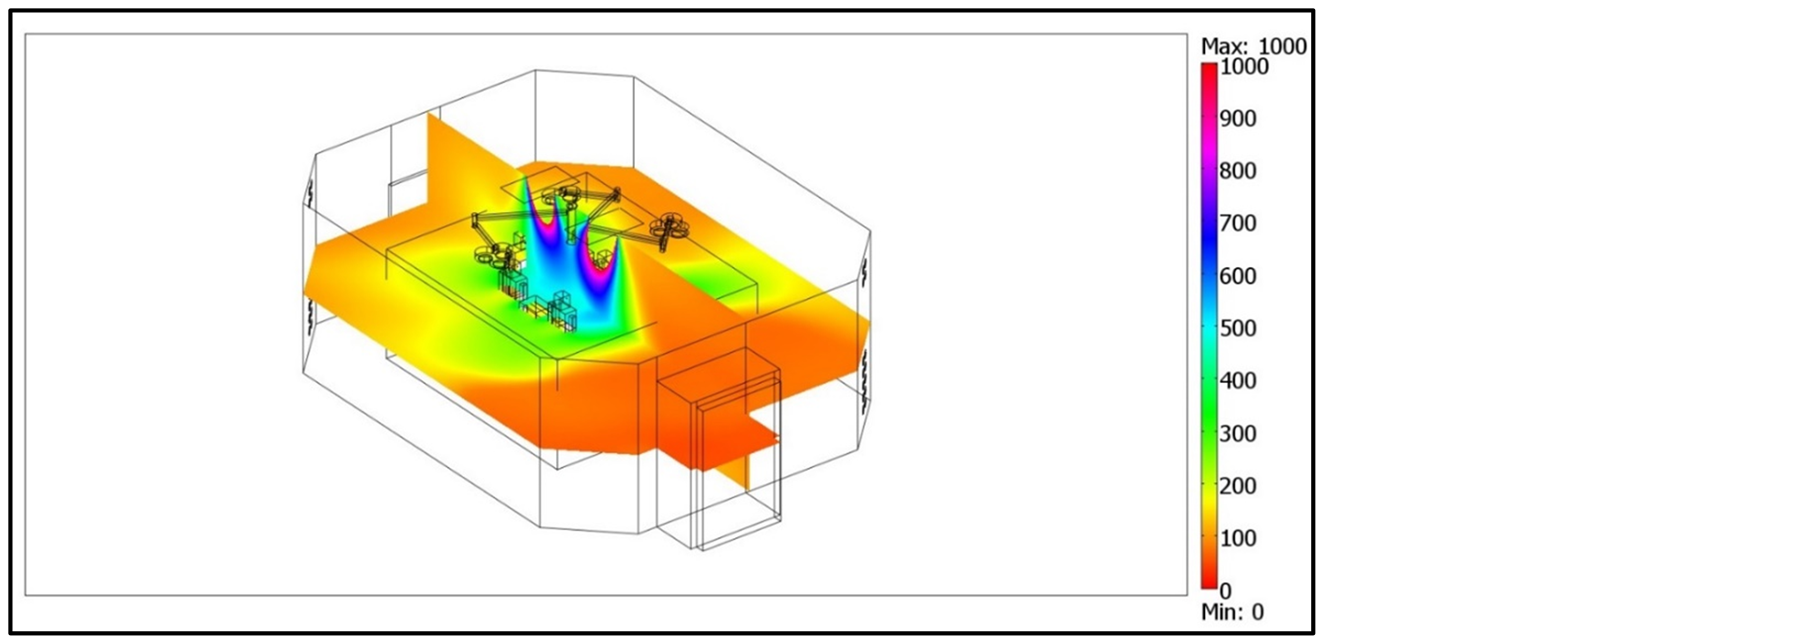
Figure 13. LACE index in horizontal (z = 1.2) and vertical slices (x = 3.0).
 (a)
(a)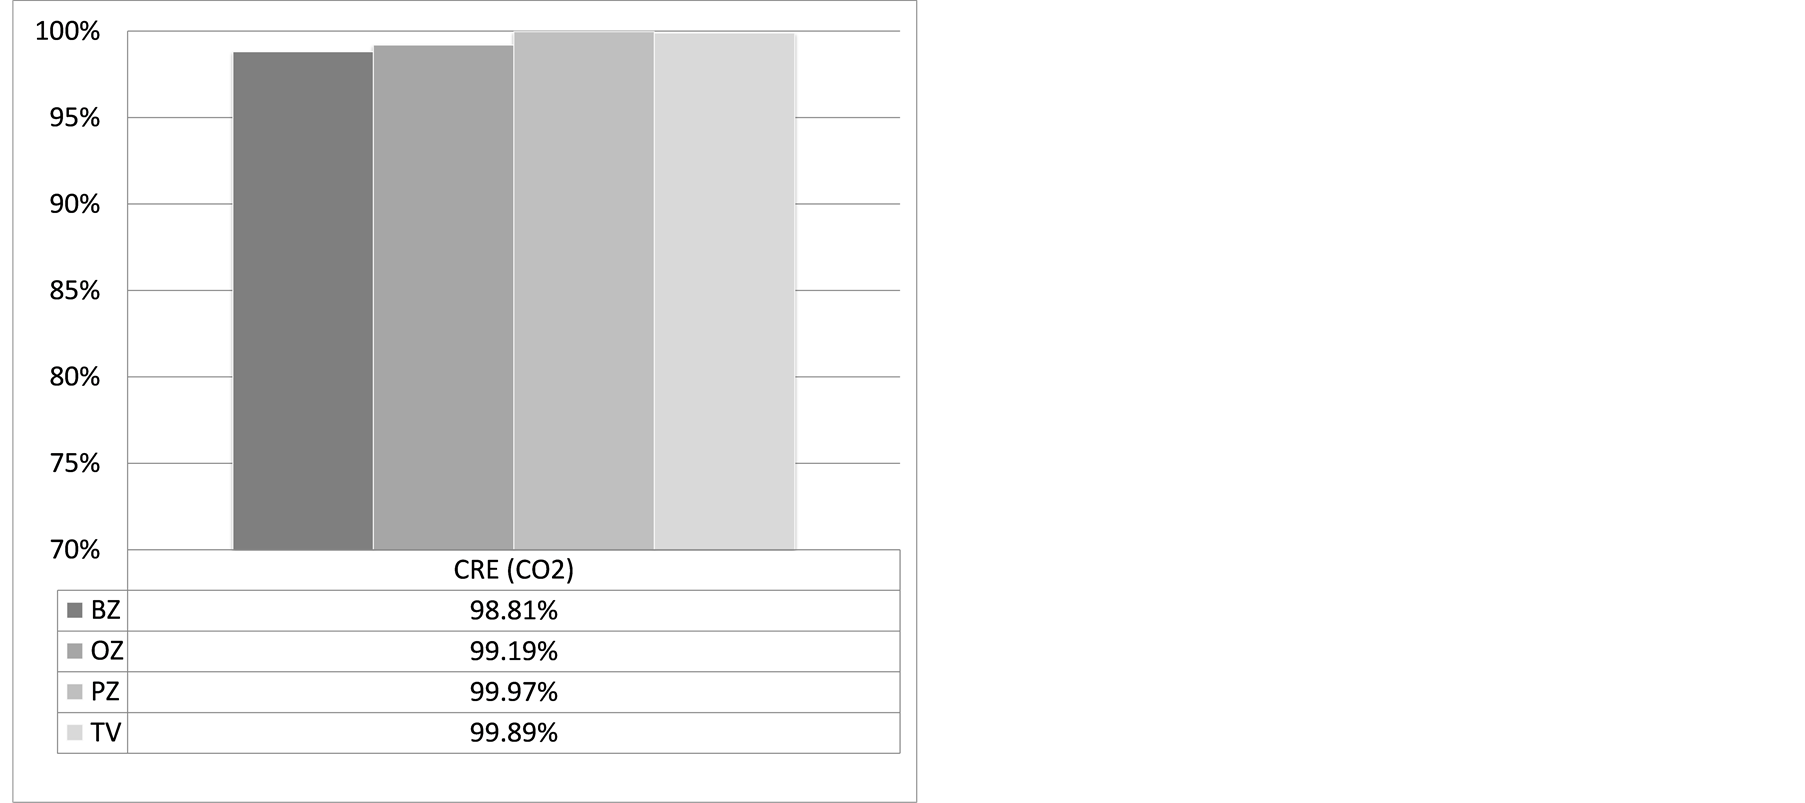 (b)
(b)
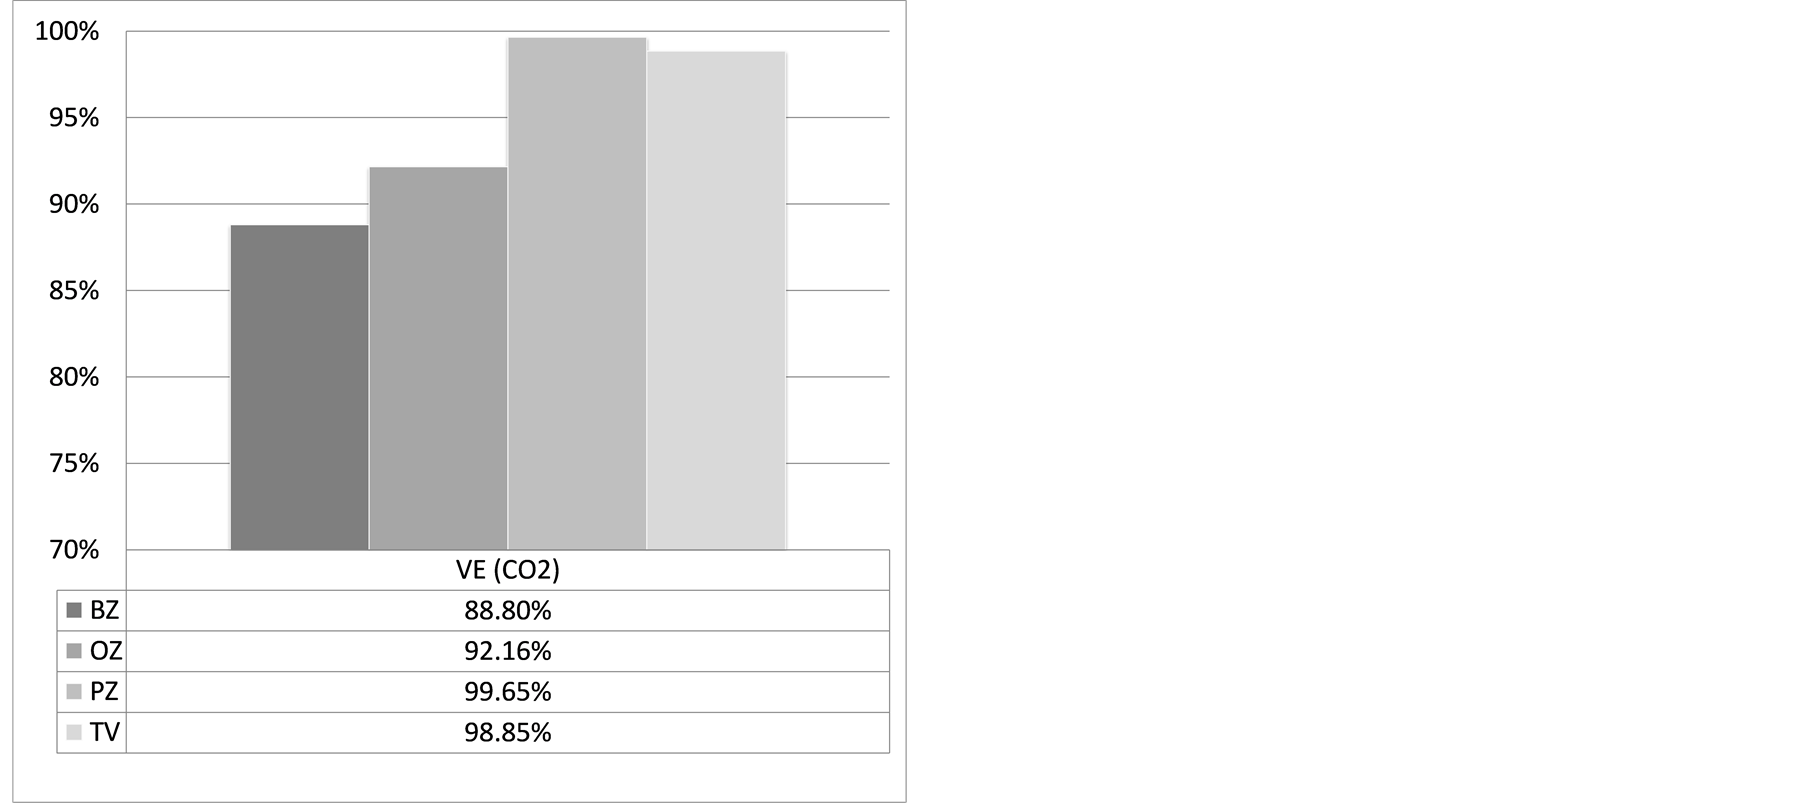
Figure 14. VE (a) and CRE (b) computed for CO2 concentration in the different zones.
(LCRE) was also calculated by:
 (7)
(7)
Local index distributions are shown in Figure 16 for CO2 and in Figure 17 for the particles concentration. Comparison between the LCRE indexes computed for CO2 and particles highlights the combined effect of the two sources (nose for CO2 and body surface for particles) which provides very different trends. The mass transport effect is particularly evident in both cases.
6. Conclusion
An experimental and numerical environmental study of a real OT carried out in “at rest” and “operational” conditions allowed the evaluation of the “impact” of medical staff on environmental conditions. Measurements of particle concentration, with and without persons, were exploited in combination with iteratively computed numerical results in order to assess particle emission rate by the occupants for given particle dimensions. Particle concentration fields were also numerically solved for several particle diameters, by using an Euler approach based on the Cunningham formulation of settling velocity. Numerical results were successfully checked against the experimental evidence. CO2 concentration levels numerically computed in the OT agree well with data reported in the literature for similar applications. Some consolidated indexes adopted for monitoring the IAQ were computed for gaseous contaminant (CO2) and particle concentration, both in terms of spatial distribution and
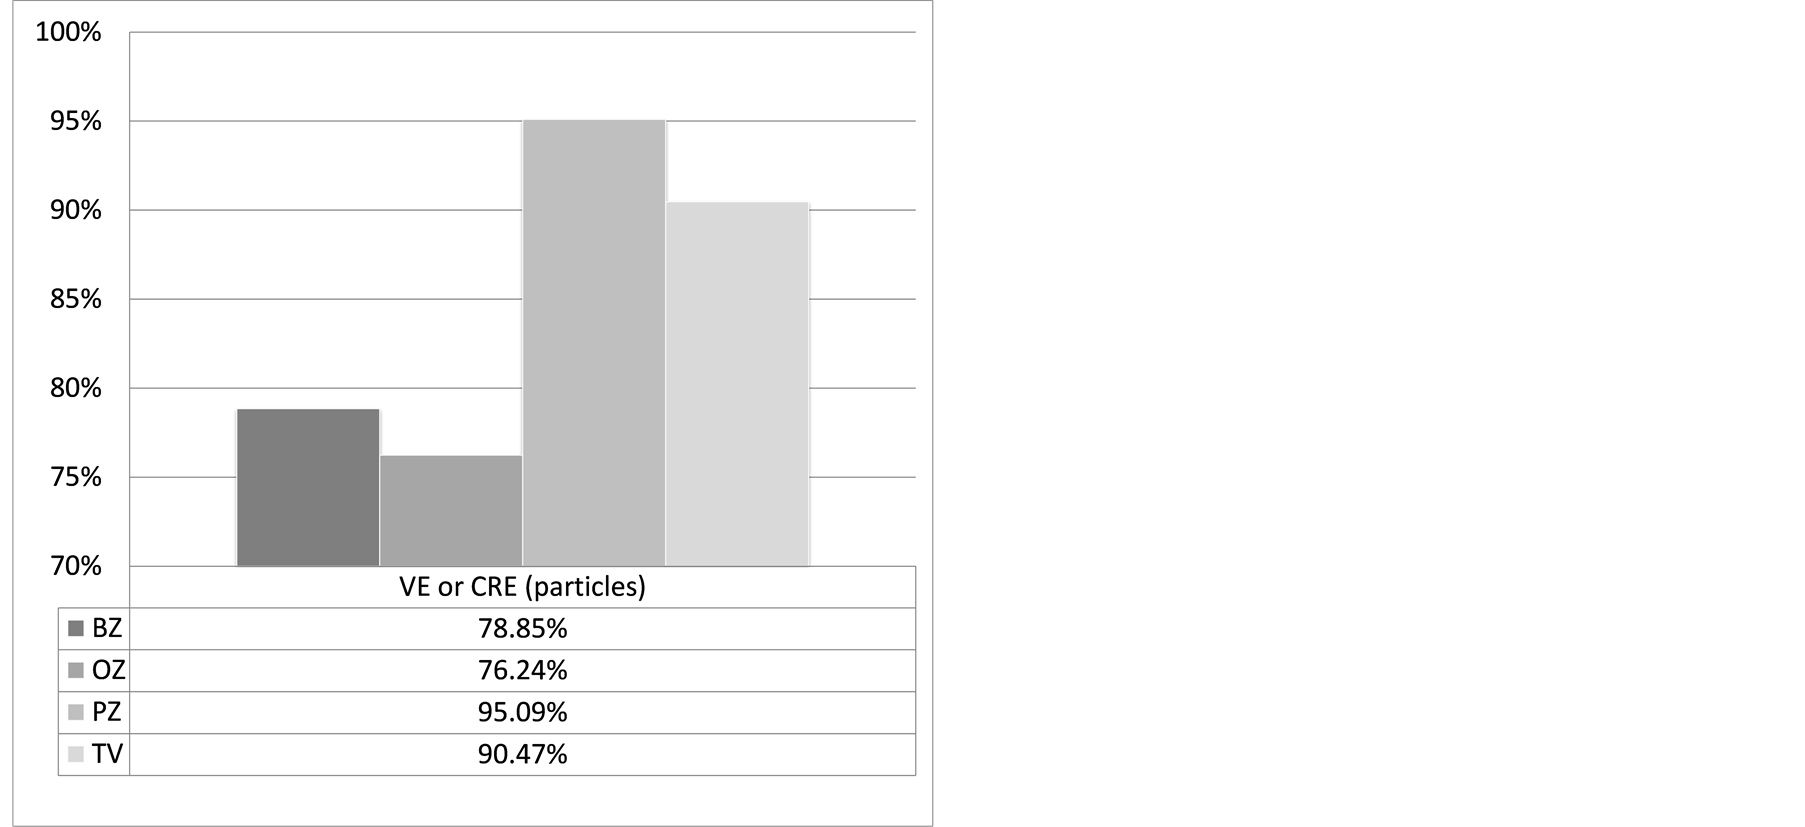
Figure 15. VE (or CRE) computed for particles concentration in the different zones.
Figure 16. LCRE for CO2 in a horizontal slice (z = 1.6).
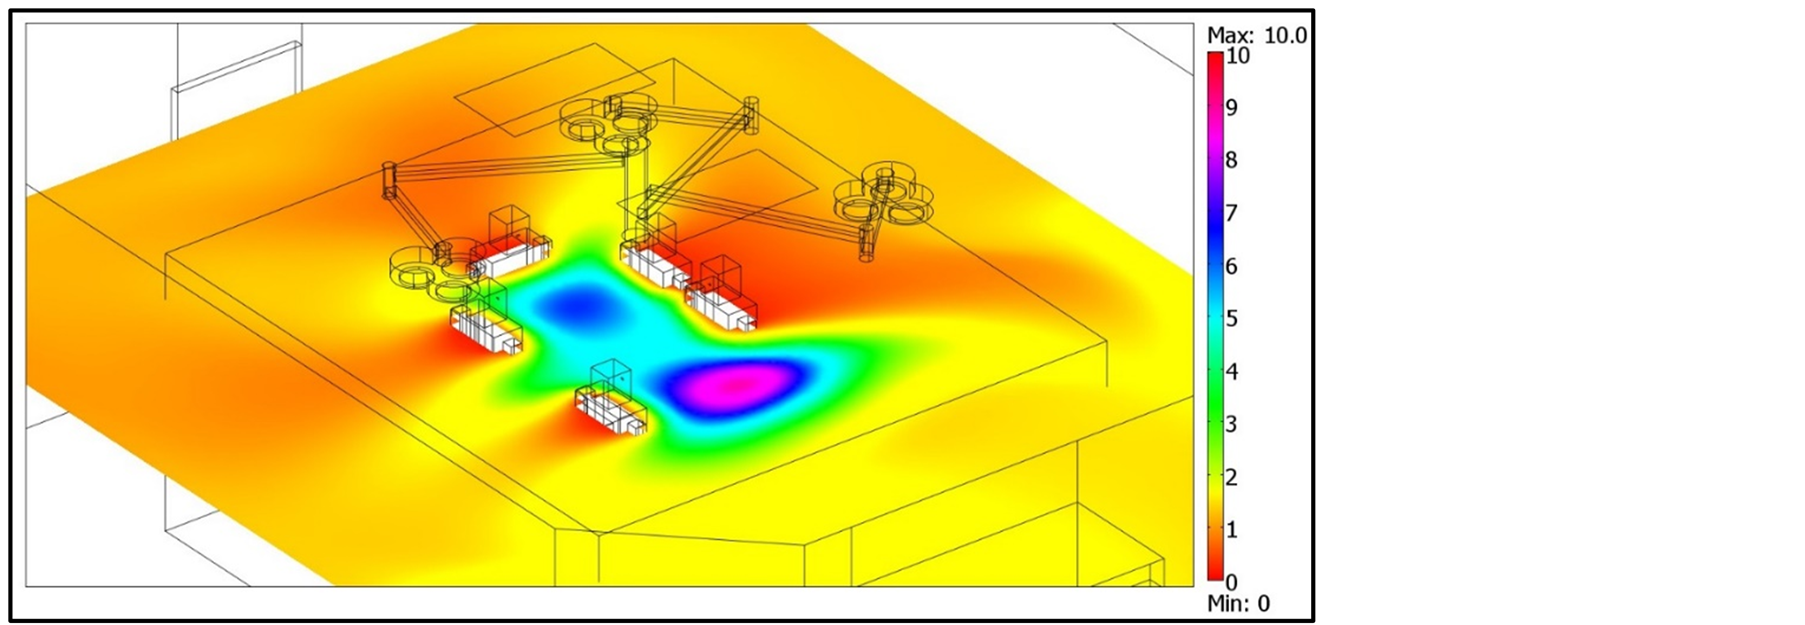
Figure 17. LCRE for particles concentration in a horizontal slice (z = 1.4).
overall values referring to specific OT zones. Results obtained by applying our proposed methodology for estimating the particle emission rate in indoor environments highlight a good agreement with the few number contributions in the literature concerning particle emission for different diameters. Our study contributes to better understanding the additional environmental “load” induced by the medical staff in an OT, based on an innovative strategy proposed and applied to quantify the particle emission rate released by occupants for given ranges of particle diameters. The integrated experimental and numerical approach proposed with our present study is in accordance with some recent surgical infection control guidelines that highlight the importance of the surgical staff behaviour control in order to decrease air contamination and wound colonisation. These recommendations include restricting the movements and the number of persons in the OT, but they are often general and based on expert advice.