GIS Based Soil Loss Estimation Using RUSLE Model: The Case of Jabi Tehinan Woreda, ANRS, Ethiopia ()
1. Introduction
1.1. Background of the Study
Soil degradation in the form of soil erosion is a serious and continuous environmental problem all over the world especially in developing countries like Ethiopia. Soil erosion is the direct result of the mismanagement of the soil by man in his effort to obtain a living from it [1] . Studies reported that, cultivation without using specific control techniques and unplanned land use, such as uncontrolled urban development, deforestation and mal-agricultural practice are fundamental factors of soil erosion [2] . It is clearly evident that the ultimate cause of erosion is human himself contributing about 60% to 80% of all soil erosion and soil degradation [3] .
Due to uncontrolled and unmanageable interference of people to the land, worldwide 80% of agricultural land suffers from moderate to severe erosion. Consequently, 65% of the soil in sub-Saharan Africa is said to have undergone degradation [4] . At country level, total soil loss by erosion from all land is estimated at almost 1.5 billion tons per year and on average 42 tones per hectare, of which 45% originates from croplands alone. But, in the highlands of Ethiopia, annual soil loss reaches up to 200 - 300 ton per hectare, making the total loss 23,400 million ton per year [5] .
The economic implication of soil erosion is more serious in Northwestern Highlands of Ethiopia because of mainly its rugged topographical features and lack of capacity to cope with it to replace lost nutrients [6] . These areas have also high population pressure which leads to intensified use of already stressed resources and expansion of production to marginal and fragile lands. Such processes aggravate erosion and resulting in a land degradation cycle.
A long history of agricultural activity with a high level of population pressure and exploitive nature of agricultural practices has led to existing depletion of vegetation covers and over-utilization of land resources. This leads consequently to high soil erosion mainly on cultivated and grazing lands. Measured soil loss from Northwestern Highlands reached as high as 200 - 300 ton per hectare, making the total loss 23,400 million ton per year [5] . The long-term average soil loss rates from cultivated plots are also the highest among nation-wide sites. The effects of soil erosion on soil productivity extrapolated in terms of nutrient loss are very high and show the serious condition which currently exists in these area [7] .
The study area has been severely affected by severe rain erosion. The area covers more than nine river basins (streams) which passes through it and drain in to river Birr, which is one of the tributaries of Blue Nile River. In addition to severe sheet and rill erosion, today, cultivated and grazing lands are commonly dissected by gullies of different size. In this regard, it is completely correct to say that the obvious potential and beauty of the area is overshadowed by environmental degradation of unbelievable magnitude [6] .
The effects of erosion on soil fertility, land degradation, agricultural productivity, environmental ecology and hydrological systems have been recognized as severe problems in every corners of the country. Sonneveld et al. [8] stated that, the problem of loss of fertile soil especially in highlands of Ethiopia is many-sided and it is still affecting 50% of the agricultural area and 88% of the total population of the country.
Mapping of erosion vulnerable area using the integration of GIS, RS and MCE technique can identify areas that are at potential risk of extensive soil erosion. The formulation of proper soil management for sustainable development requires an explicit inventory and rating of vulnerable areas. This information is very useful in the decision making context to avoid land acquisition in erosion risk areas, or, alternatively, to recommend soil conservation measures to reduce soil loss if developments continue [9] . On the other hand, the modeling of soil erosion and their consequences plays a significant role for natural resource management and/or sustainable environmental planning processes.
Therefore, the overall objective of this paper is to quantify and map an estimated soil loss by examining different topographic and anthropogenic factors for the planning and implementations of sustainable soil conservation and management systems in the study area.
1.2. Significance of the Study
The purpose of this paper is to promote the role of soil erosion vulnerability map, which helps to identify areas that are at potential risk of extensive soil loss. And such study will provides a base line data for policy makers, land use planner and natural resource managers to formulate and implement effective soil conservation strategies. Furthermore, this work could also be used as source of information for those researchers who intend to do similar or related research.
2. Materials and Methods
The research have been used both primary and secondary data. Secondary data (Satellite image, aerial photo, topographic map, meteorological data, population data and others) were collected from different governmental and non-governmental organizations. In addition to this, frequent field observations using Global Positioning System (GPS) were carried out to generate primary information regarding the ground truth for image classification and soil loss vulnerability verification. Primary data were collected using key informant discussions and filed survey or ground truth observations and verification using GPS instruments.
Data analysis and processing were made by digitizing, calculating and classifying the necessary information of each thematic layers using ERDAS IMGINE 8.7 and ArcGIS 9.2 software. Finally, all parameter influences were weighted using MCE and Analytical Hierarchy Principle [10] . Furthermore, some simple statistical methods, such as percentage, average and graphic tabulation were also employed for the analysis and interpretations. The basic methodological approach followed in RUSLE has been detailed in the following simplified flow chart (Figure 1).

Figure 1. Flow chart showing the methodology adopted for soil loss estimation.
3. Data Analysis and Derivation of RUSLE Parameters
3.1. Rainfall Erosivity Factor (R)
Rainfall erosivity depends on amount, intensity and distributions of rainfall. The soil loss is closely related to rainfall partly through the detaching power of raindrop striking the soil surface and partly through the contribution of rain to runoff [11] . Though there are a number of ways of analyzing the rainfall erosivity depending on the local conditions of the place (country), the values of R factor for this study was estimated according to the equation adopted by [12] for Ethiopian conditions.

where, R = Rainfall erosivity.
P = mean annual rainfall (mm/yr).
To compute R factor, mean annual rainfall of 15 years were collected from seven metrological stations, three of them (Finote Selam, Lay ber and Mankusa stations) were found within the woreda boundary, the remaining four (Dembecha, Sekela, Bure and Genet Abo stations) were taken from neighboring woredas (Table 1). After calculating average 15 years of rainfall for each station, the R factor was computed using the above formula and converted in to raster surface using IDW (Inverse Distance weighted) interpolation methods in ArcGIS software (Figure 2).

Table 1. Mean annual rainfall and erosivity factor (R) result.
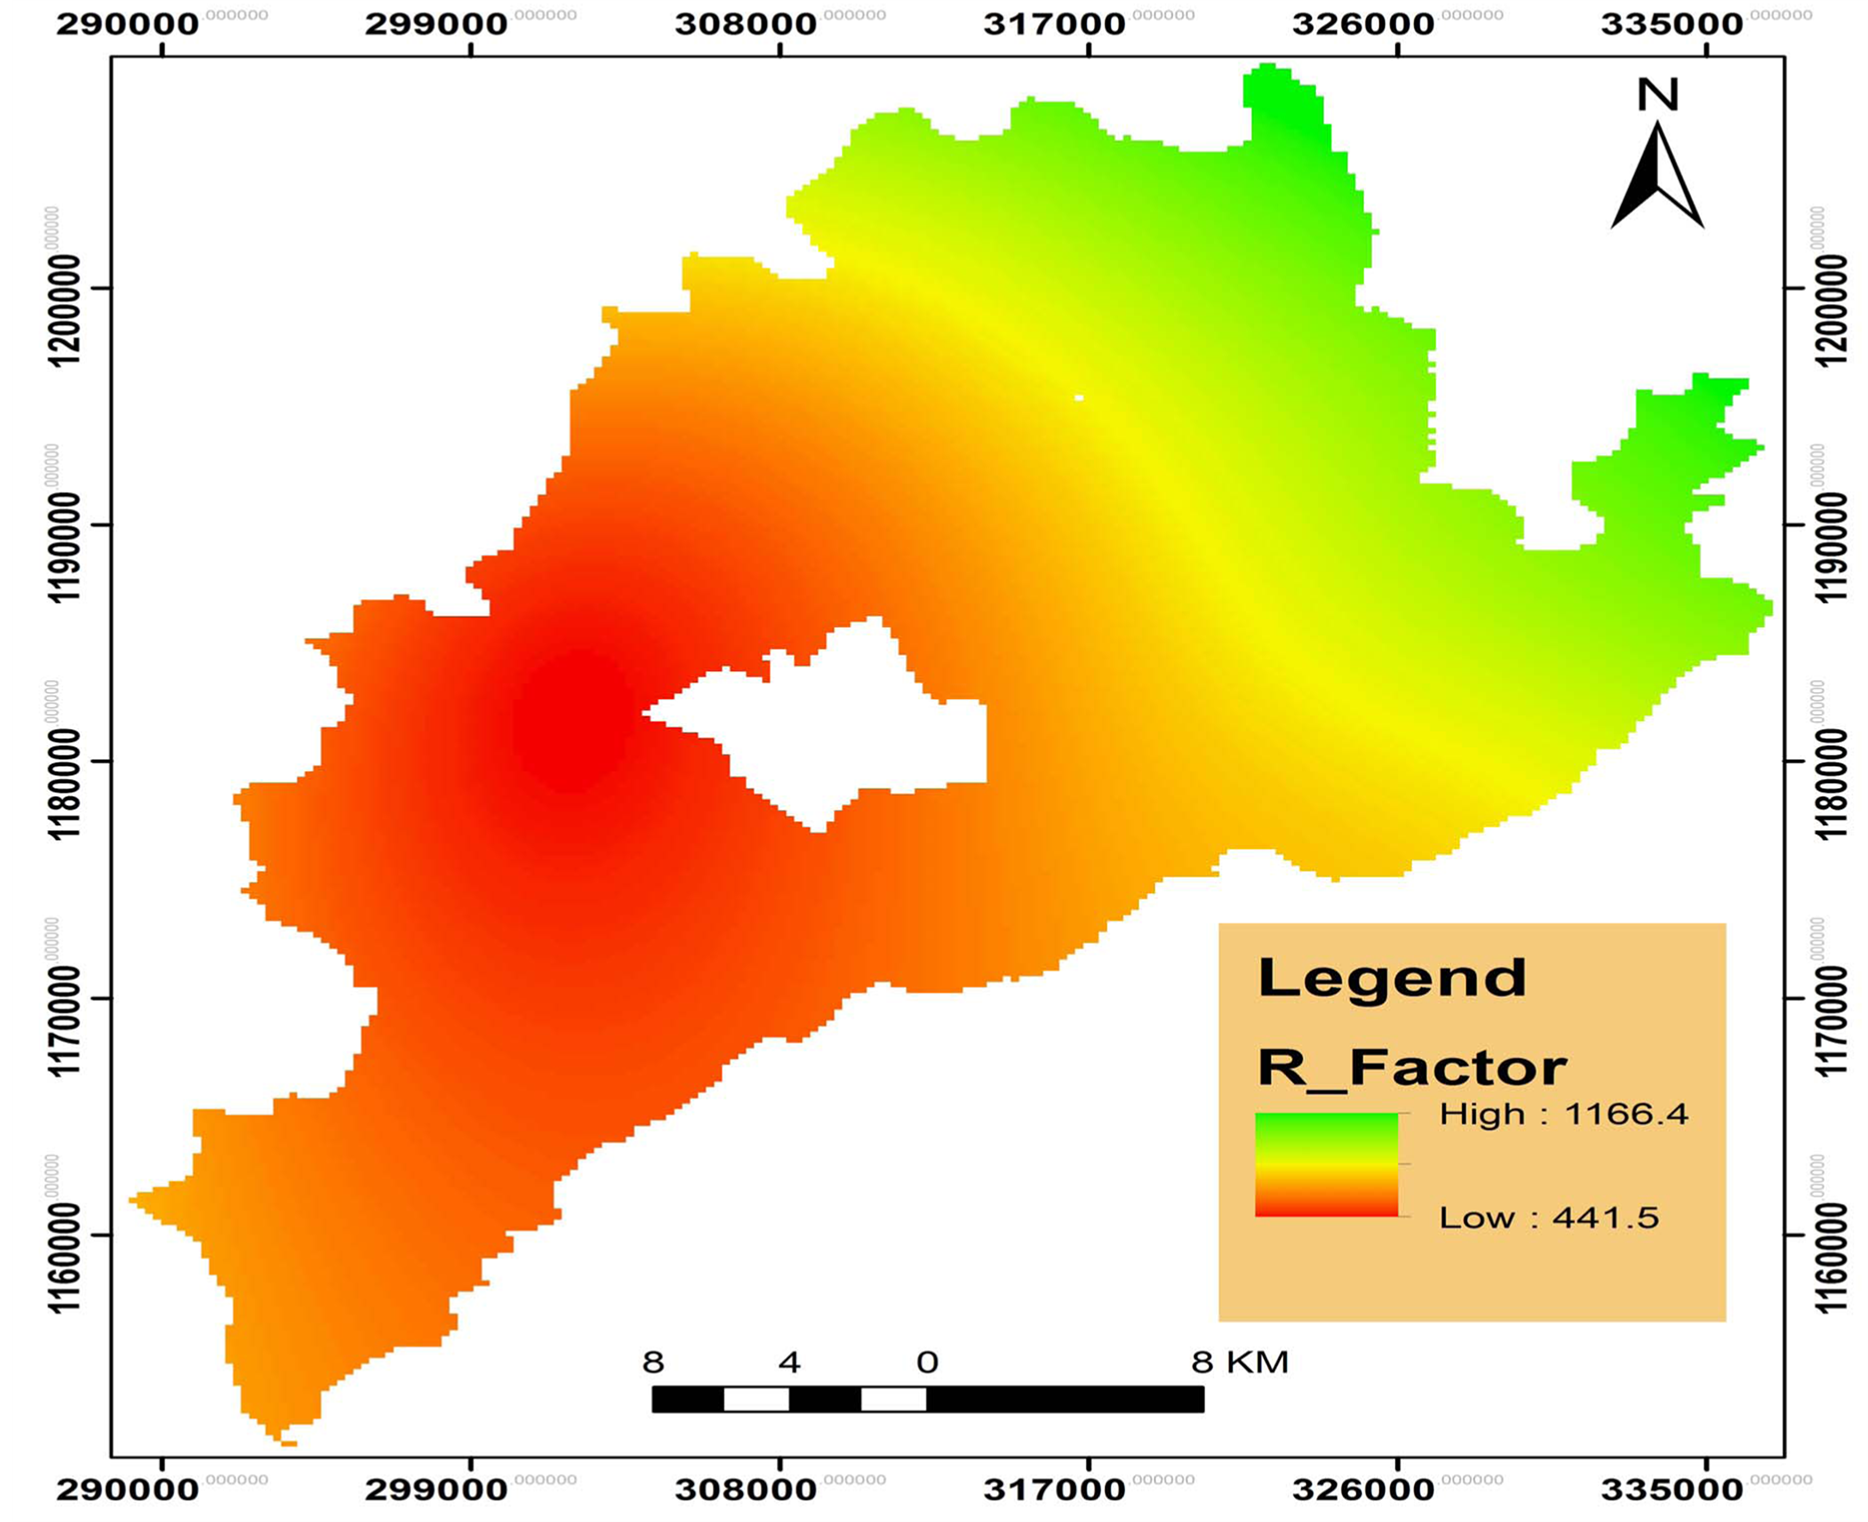
Figure 2. Rainfall erosivity factor (R_value) map.
3.2. Soil Erodability Factor (K)
Soil erodability Factor (K) is defined as mean annual rainfall soil loss per unit of R for a standard condition of bare soil, recently tilled up-and-down with slope with no conservation practices and on a slope of 5˚ and 22 m length [11] . Main determinants of soil erodability are soil structural stability and the soils ability to absorb rainfall. These properties in turn depends on a number of characteristics of the soil, such as texture, structure, organic matter content, soil depth and other physical and chemical properties of the topsoil. The value of K was given by [12] based on soil colors in RUSLE for Ethiopian condition by adapting different sources and researches (Table 2).
For the analysis of K factor, FAO standard classification of soil type was obtained from Ministry of Agriculture and Rural Development. According to FAO soil classification five major soil types namely, Chromic Vertisols, Pellic Vertisols, Lithosols, Orthic Luvisols and Eutric Nitosols were identified in the study area. After changing the vector format in to grid, the grid dataset was reclassified based on K-values adopted by [12] (Table 3 and Figure 3).

Figure 3. Soil soil erodability factor (K_value) map.
Table 2. Soil color and its value to estimate soil erodibility.
Source: Hurni 1985.
Table 3. Soil types with their corresponding K values.
3.3. Topographic Factor (LS Factor)
The slope length and slope steepness factors are commonly combined in a single index as LS and referred to as the topographic factor. Slope length is defined as the distance from the point of origin of overland flow to the point where either the slope gradient decreases enough that deposition begins or the runoff water enters a well-defined channel that may be part of a drainage network.
Slope steepness has been considered as one of the most model parameters in RUSLE analysis due to the fact that the steeper the slope of a field, the more it is pushed down hill, the faster the water runs and the greater will be the amount of soil loss from erosion by water. Soil erosion by water also increases as the slope length increases due to the greater accumulation of runoff. The modified equation for computing the topographic factor (LS factor) in GIS environment is employed by the formula recommended by [13] .

where flow accumulation is the number of cells contributing to flow in to a given cell and derived from the DEM after conducting fill, flow direction and flow accumulation processes in ArcGIS. Cell size is the size of the cells being used in the grid based representation of the landscape. Finally, the LS factor map was derived using the above formula in ArcGIS spatial analysis raster calculator function (Figure 4).
3.4. Cover Management Factor (C)
The cover management factor represents the ratio of soil loss under a given cover to that of the base soil [11] . Land cover has a profound impact on erosion and deposition. Surface cover, such as vegetation or plant residue may intercept and reduce raindrop erosivity, increase infiltration, slow down runoff and reduce transporting capacity of water flow.
The land use/land cover map was used for the estimation of C-value. The raster land use/land cover map was converted to a vector format and a corresponding C-value was assigned to each land use classes based on cover values proposed by Hurni [12] (Table 4). Finally, using reclassification and vector to raster conversion the land use/ land cover map was converted to C factor map (Figure 5).
3.5. Conservation Practice Factor (P Factor)
Conservation practice and land management directly affects the overall soil erosion problem and solutions on a farm. In RUSLE, P factor is the ratio of soil loss with a specific conservation practice to the corresponding loss with up and down slope cultivation, which has a value of one. The P-value ranges from 0 - 1 depending on the soil management activities employed in the specific plot of land. These management activities are highly depends on the slope of the area. P-factor is calculated for agricultural land only and for all other land use is assumed as 1, because there is no any control practice measures [14] .
To derive the P-factor, frequent filed observation and interviews from the local office of natural resource management (NRM) was undertaken. Conservation practice undertaken in agricultural field and a little bit in bare lands are only counter ploughing and terracing which are especially practiced in hilly and mountainous areas of the study area.
According to Hurni [12] , P values of counter ploughing and terracing are 0.9 and 0.5 respectively. After assessing the conservation practice and their respective values, P factor map was developed in ArcGIS using land use/land cover map of the study area (Figure 6).
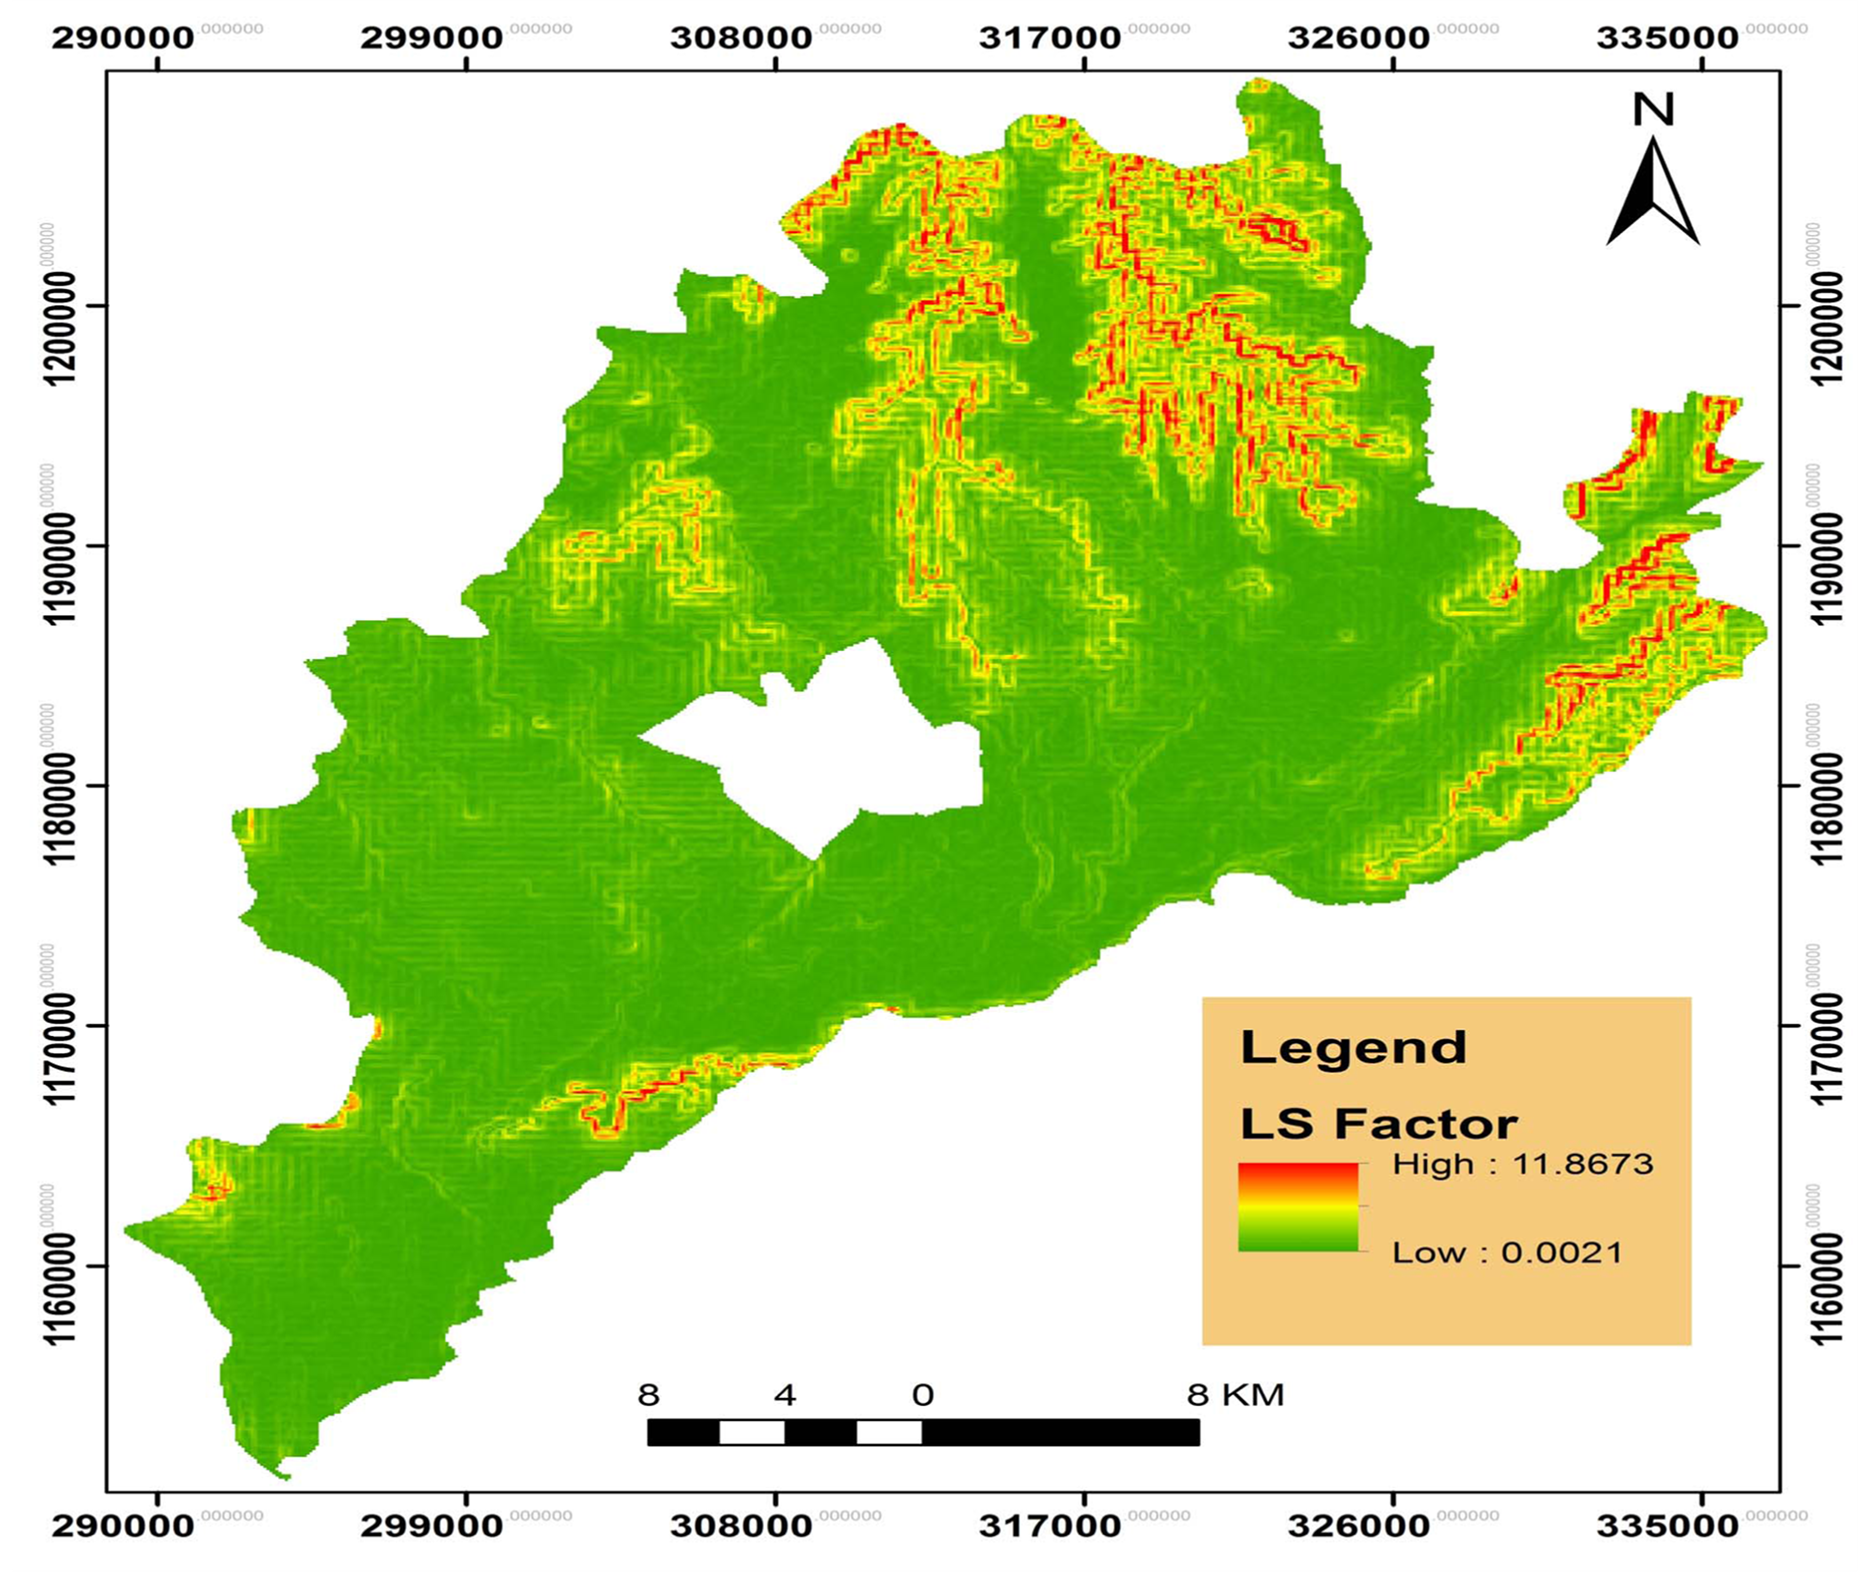
Figure 4. Topographic factor (LS_factor) map.
Table 4. The land use/land cover classes and their corresponding C-values.
Source: Hurni 1985.
4. Results and Discussion
4.1. Soil Erosion Vulnerability Distribution
Soil erosion is a function of spatial and temporal variation and interaction of different natural and anthropogenic factors. Topography (slope and elevation), soil type, land use/land cover, drainage pattern, rainfall and population growth have been identified as model parameters for the study. In the context of weighted overlay analysis model, the highest raster values indicate areas that are extremely vulnerable to soil erosion whereas lowest raster

Figure 5. Cover management factor (C-value) map.
values imply areas in a very less vulnerable to soil erosion. And areas in steeper slope with Lithosols, Eutric Nitosols, Orthic Luvisols, croplands, bare lands and river banks have been identified as the most soil erosion vulnerable areas.
4.2. Estimated Soil Loss
The spatial distributions of amount of soil loss in the study area is quite different and ranges nearly insignificant (0) in south, west and central parts of the study area to extremely high (504.6 t/ha/yr) in the north and northeastern parts of the catchments (Figure 7). The mean annual soil loss from the area is 30.6 t/ha/yr, which make a total loss of 3,580,528 ton per year from 116983.5 ha of land.
Since the north and north-eastern parts of the catchments is dominated by steeply sloping areas, an estimated soil loss in this area is greater than the soil loss estimation of the Ethiopian highlands which was done by Anjeni research unit of SCRP [15] [16] . According to the Anjeni research unit of SCRP [15] , measured annual soil loss from Northwestern Highlands of Gojjam reaches up to 320 t/ha/year. In addition to its steep terrain features, poor land management, land over cultivation, over grazing and absence soil cover during the first periods of raindrops as well as water flows are also the major driving force for the recording of worst soil loss in the north and north-eastern parts of the woreda.
The overall result of the study was found in line with the findings of [5] [6] [15] -[18] . According to FAO [5] , and Solomon Abate [18] analysis and estimations, the Northern Highlands of Ethiopia including the study area has been affected by severe to moderate soil loss. In the same context different researchers indicated that, meas-

Figure 6. Conservation practice factor (P-value) map.
ured annual soil loss from Northwestern Highlands of Gojjam reaches up to 320 t/ha/year [15] , 243 t/ha/year [6] and 300 t/ha/year [16] from bare and agricultural lands of the area.
5. Conclusions and Recommendations
5.1. Conclusions
Based on the result of the study it is possible to conclude the following important points.
• Assessment and quantifications of estimate values of soil loss can be well computed by the application of GIS and remote sensing techniques.
• Derivation of slope length from the DEM in GIS environment is a very good cost and time effective methods than measuring at the field level.
• SRTM data from remote sensing image was found to be a very good data source for the derivation of slope gradients. Land sat imageries is also very popular data for land use/land cover change analysis which is the most important factor for soil loss correlation.
• Estimated soil loss was found to be different in different land use/land cover type and slope gradients. The estimated values of soil erosion have direct relationship with slope gradients. In connection with land
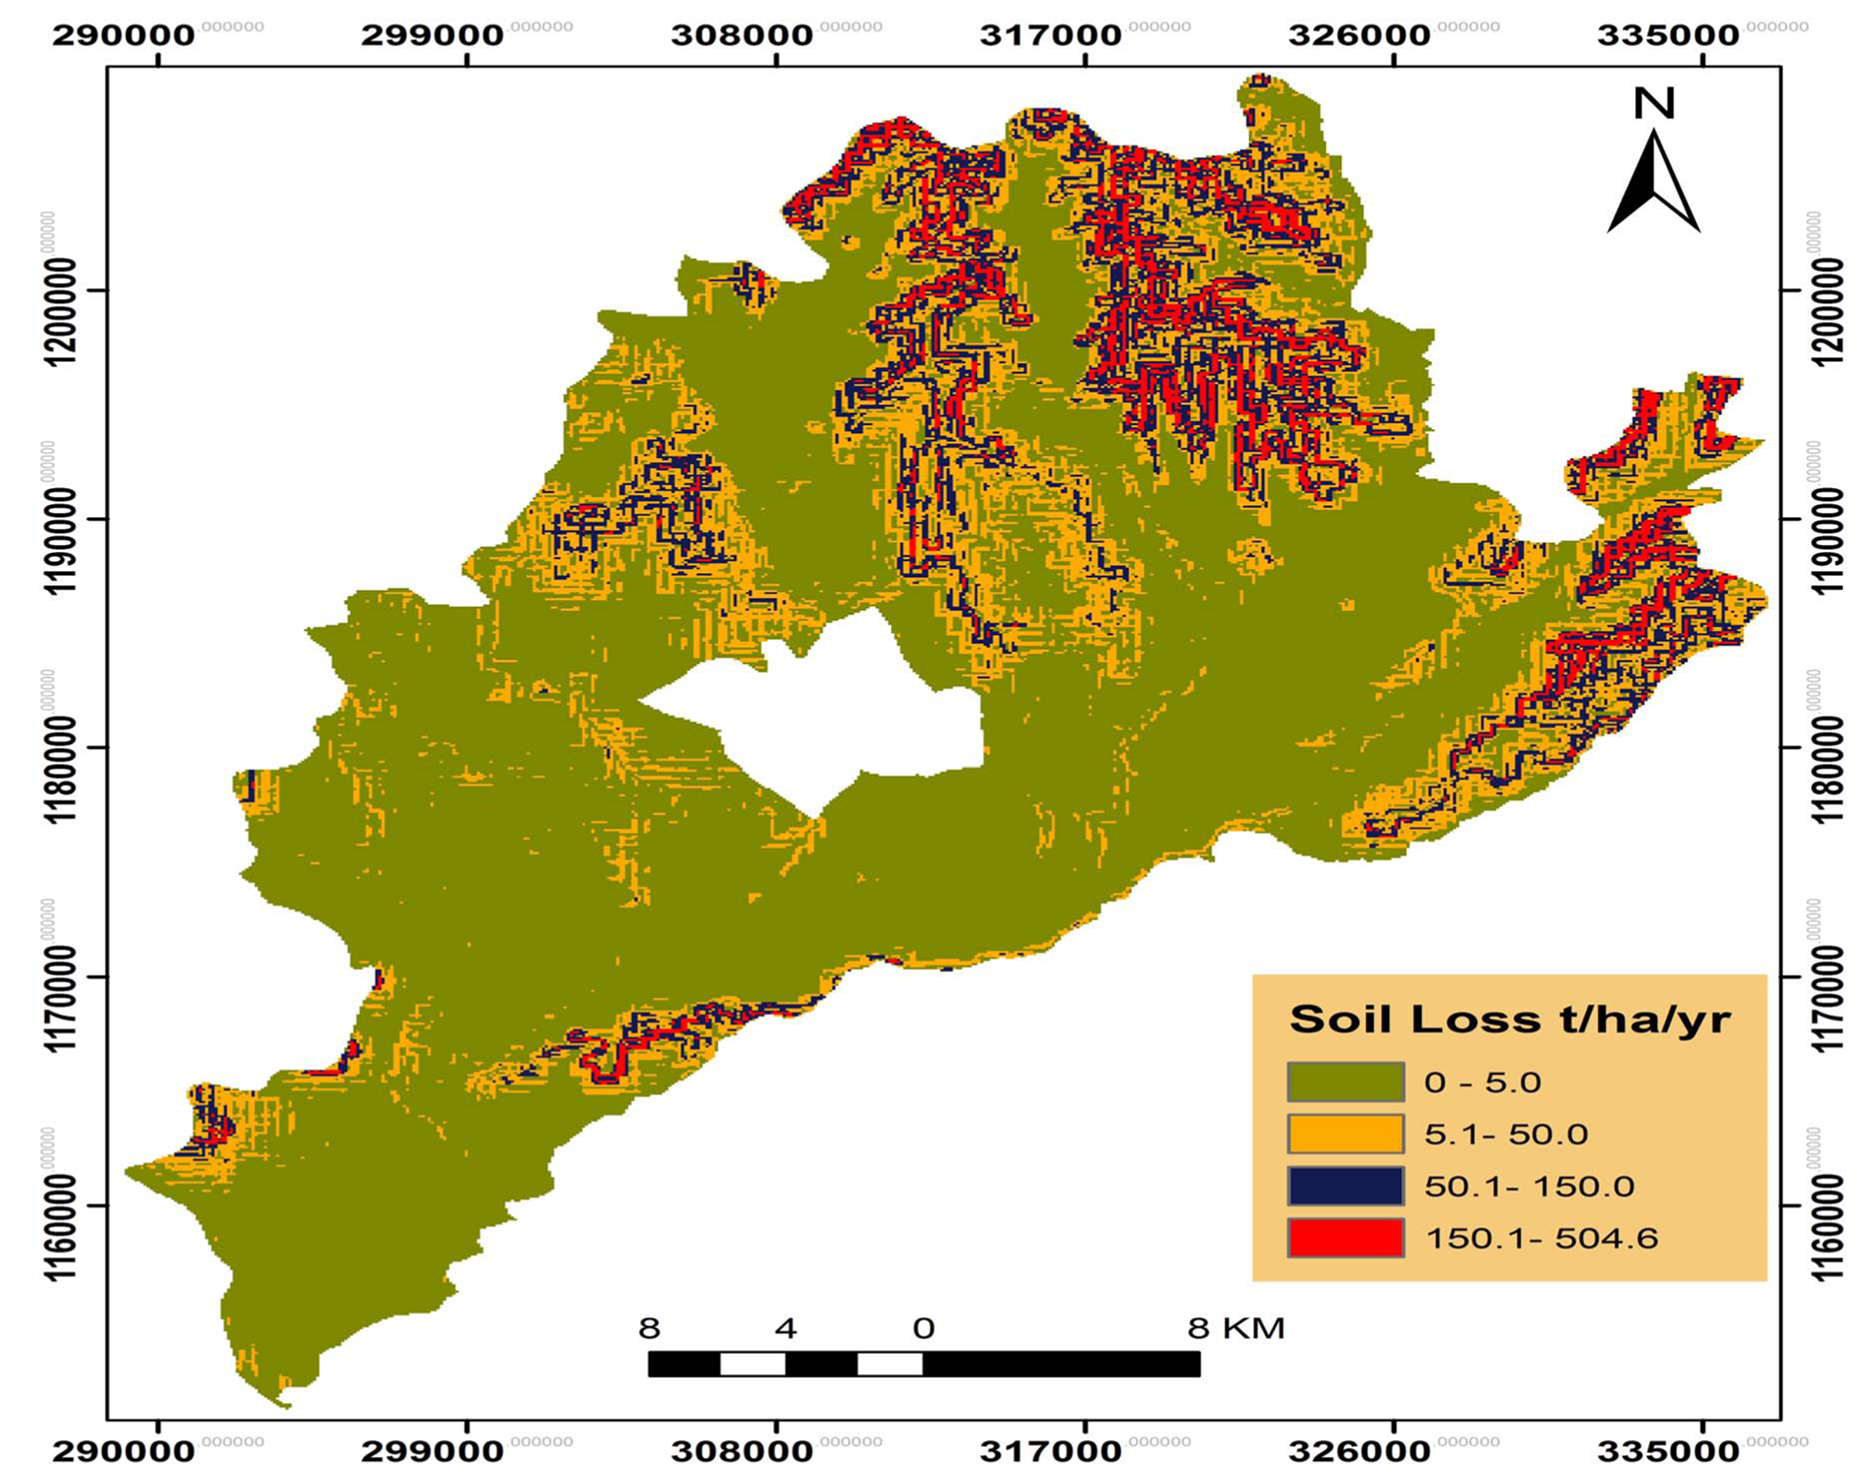
Figure 7. Estimated soil loss hazard map.
use/land cover types, there is no distinct pattern observed but soil erosion vulnerability potential increases in bare and cultivated lands.
• The soil loss hazard map erosion which had been developed can be used as one of the main inputs in decision-making support system of soil resource management and it may influence policy decisions of land use planning in the study area.
5.2. Recommendations
Even though the success of conservation and management practice depends on the integrated factors of money, time, technical skills, appropriate policies and cultural perceptions of the communities, the researchers recommends the following important points on the basis of the result of the study.
• In the soil loss hazard map, areas which were identified as extensive soil loss should be given a serious attention and priorities when implementing soil conservation and management activities before the area jumps to irreversible soil degradations.
• The local communities should adopt immediate soil conservation measures in his cultivated lands by applying different soil protective methods like mulching, strip cropping, terracing, contour plowing, multiple cropping and other indigenous means of soil conservation techniques.
• Local planners and decision makers should implement both long and short-term timely updated natural resource management systems including the necessary forest laws.
• For long-term soil resource conservation and erosion preventions especially in steeper slopes, protection and conservation of existing vegetation cover and/or replanting forest in cultivated lands is deemed necessary for the sustainability of soil and other natural resources in the study area.
• Although, GIS, RS and Multi-Criteria Evaluation model is a valuable tool for the quantifications and mapping of an estimated value of soil loss at various locations, further studies in limited spatial scale using high resolution data is recommended to monitor and mitigate the areas appropriately.