Thickness, Distribution and Quality Assessment of Gopalganj-Madaripur Peat Deposits: A Case Study of Potential Economic Opportunities in Mid-Eastern Low-Lying Bangladesh ()
1. Introduction
Peat can be considered as the youngest fossil fuels [1] in the context of geological age and regarded as one of the important natural resources in the world. It is the initial stage in the process of formation of coal which primarily starts with the disintegration and decomposition of vegetal matter that either accumulated where it grows or is transported from surrounding areas [2] . Peatland is a generic term of any wetland that accumulates soil organic from partially decayed plant matter [3] [4] , where peat formation is influenced by anaerobic condition and acidity of the groundwater, which results in the accumulation of organic matter [1] .
The southern foredeep region in Bangladesh is tectonically an active subsiding zone, possibly due to the slow subduction of the Bengal Basin under the Shillong plateau in the north and the Indo-Burman Ranges in the east [5] - [7] . As a consequence of the isostatic adjustment of the crust due to the rise of the Himalayas and dewatering of the Proto-Bangal Fan sediments [8] , a number of structurally controlled tectonic elements have developed in the Bengal Foredeep, known as basement high (i.e., the Barisal High) and trough (i.e., Faridpur Trough), (Figure 1(A)) that has been interpreted according to the study of different gravity and magnetic anomalies.
The Gopalganj-Madaripur peat deposits occur, geotectonically, in the Bengal Basin, especially in the Faridpur Trough (Figure 1(A)) of the Bengal Foredeep, which may be subsiding either at a rate of 2.2 cm/year or higher [10] . The Baghia, Chanda and other smaller adjoining beels of Madaripur and Gopalganj districts, a significant portion of the Faridpur Trough which was the vast flood-plain swamps with active deltaic environment in the past, occupy the largest mineable peat deposits in Bangladesh. These swamps developed in depressions in the floodplains of the tributaries of the Ganges, such as the Ariyal khan, the Kumar and the Madumati (Figure 1(B) & Figure 1(C)); appear to have close relation with the physiographic environment of the region in which they are present [2] . The formation of peat is interpreted as a part of the deltaic alluvium within the last few thousand years, deposited by the Ganges and associated distributaries crossing the area.
About 160 million people living in a small area of approximately 55,000 square miles, Bangladesh is considered as one of the densely populated country in the world where the difference between demand and production is increasing day by day. As a consequence, the country is experiencing more energy crisis in recent years in order to meet the high demand of her population in the domestic as well as in the industrial sectors. About 95% of our country’s power generation is produced from natural gas, a small hydroelectric plant at Kaptai and a coal based plant at Barapukuria. Though many other power generation units have been added to the national grid to solve the power crisis issue, it is not enough [11] . Gas crisis disrupts industrial production and power generation [12] and a number of political obstructions and technological limitations hinder the proper use of coal. In that case, peat might be an essential contribution in our power generation sectors and used as a substitute energy source to relatively expensive natural gas and coal. In industrial purposes, for example, industrial heating in plants, peat can be used in brick and in the generation of power, particularly if mixed with coal [2] .
2. Study Area
2.1. Location
The investigated area straddles the Madaripur and Golpaganj Districts which is about 120 km southwest of capital city (Dhaka) and is located approximately at a longitude between 89˚54'50"E and 90˚07'40"E and a latitude
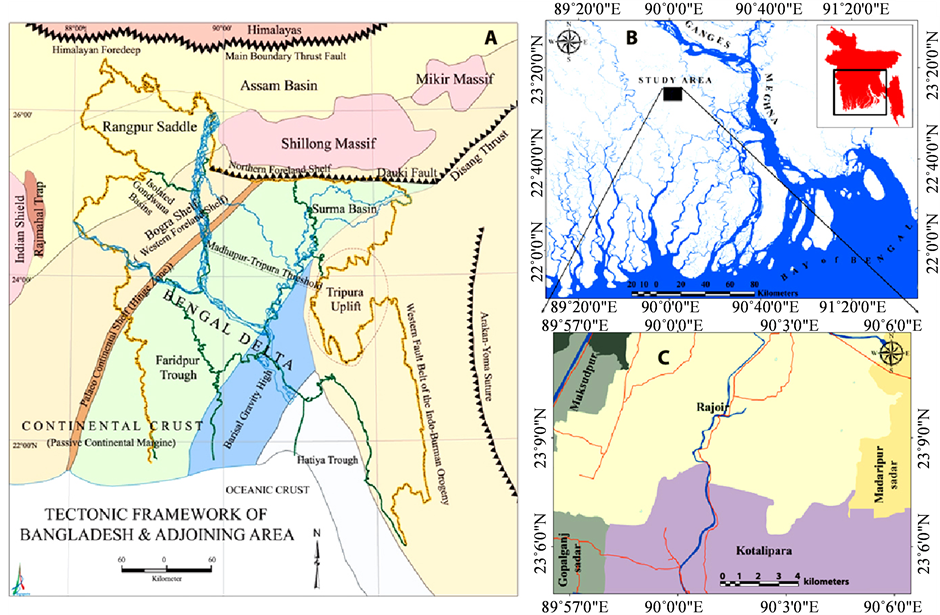
Figure 1. Tectonic framework of Bangladesh and adjoining area [9] showing different tectonic elements including Faridpur Trough (A) and the present Ganges-Meghna River System in and outside of the study area ((B) & (C)).
between 23˚03'30"N and 23˚12'30"N. It is bordered by the Padma River in the north-east, the Madhumati River in the west, Khulna district in the south-west and Barisal district in the south (Figure 2). Most of the study area is located within the Rajoir Upazilla, partly in the Muksudpur, Kotalipara, Gaurnadi, Agailjhara and Kalkini upazilas, with very minor overlap into the Madaripur Sadar and Gopalganj Sadar Upazilas.
2.2. Topography
The investigated area is very flat with a natural elevation of about 1m above the mean sea level, rising to the north, the north-east and the west. The north-eastern corner of the study area exhibits the highest elevation of about 4 m above the mean sea level, whereas the central and southern parts show lower elevation of about 0.2 m above the mean sea level (Figure 3(A)). However, some depressions in the area are actually located below the mean sea level. The most salient topographic features of the study area are road dams and artificially raised areas for settlements and villages (Figure 3(B)), with an elevation up to 3 m above the surrounding area, presumably above the normal flood levels. The canals along the roads and ponds are excavated in order to build the road dams and raised areas.
2.3. Land Use Pattern
The information of different land classes have been extracted from the land use map of the study area. Depressions, agricultural lands and settlements area cover most of the area of this region (Figure 4).
Land class (1): Depressions
No significant water courses run through the investigated area. However, a number of khals, ponds and numerous depressions, known as beels, are grouped under this class and covers almost 9404 hectares area in the map. Most of the depressions fall in the western and middle part of the study area. Flood waters recede through the khals (canals) where the sediments deposit faster than the beels. During maximum flood, the khals and former river channels were observed to have silted up comparatively quickly, i.e., within a few decades.
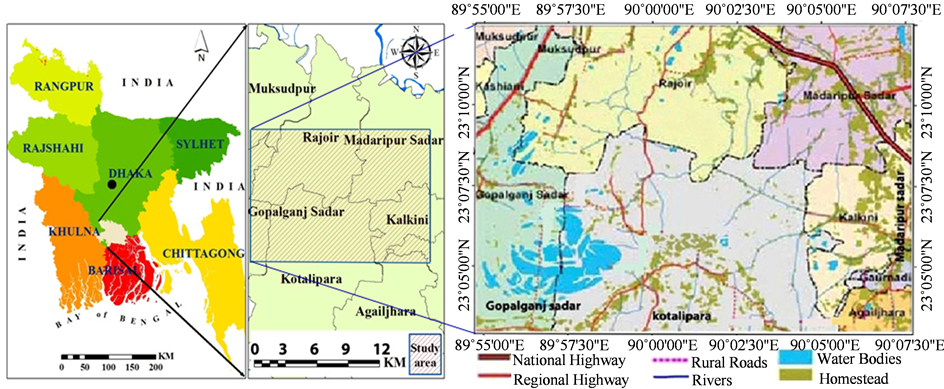
Figure 2. Location map representing areal extent of the study area.
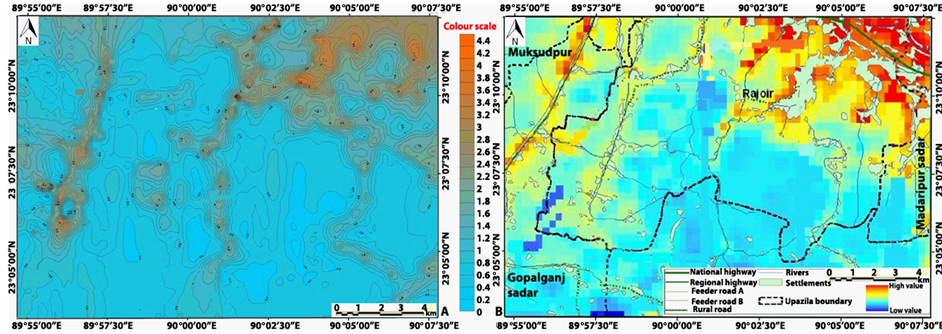
Figure 3. Contour map [13] [14] showing different elevation of the study area (A) and administrative boundary superimposed over the digital terrain model (DTM) to point out the higher as well as lower elevation of the study area (B).

Figure 4. Land use map showing the prominent land features of the study area.
Landclass (2): Agricultural fields
Agricultural fields are grouped in this class and cover mostly the north-eastern and the western portion of the study area. The calculated area is about 5429 hectares. Agricultural lands are extensively used for irrigation practice especially the paddy cultivation.
Landclass (3): Settlements
The third element, known as settlements, is categorized in this class. These include artificially raised homesteads and vegetation, villages, roads and highways etc. and falls mostly in the north-eastern, the western, the south western and a few places of the middle and lower part of the study area. The area calculated on the land use map is approximately 2172 hectares.
2.4. Geomorphology and General Stratigraphy
The study area falls under three major physiographic subdivisions, known as; Old Ganges flood plain, Young Ganges flood plain and Ganges tidal flood plain [15] (Figure 5(A)), and landforms are very much associated to the geological depositional system. However, Ganges tidal flood plain occupies the major part of the study area which is characterized by a number of large depressions including Baghia and Chanda beel. These low-lying areas constitute the vast peat basin of Gopalganj and few portion of Madaripur having virtually organic rich sediments at the top [15] . Besides these, other geomorphological units such as flood basin, active channels, meander scroll, natural levees and swales are also common in the study area (Figure 5(B)).
A generalized stratigraphic cross section of the study area (Figure 6) has been documented with the help of a significant number of shallow and deep hand tube wells data, collected from Bangladesh Water Development Board (BWDB), drilled in different location of Gopalganj sadar, Kotalipara and Kalkini upazilas of Madaripur district in connection with ground water studies and researches pertaining to arsenic contamination for regional shallow and deep aquifers. The peat layer is capped by a light brown silty clay layer which ranges in thickness from about 1 foot in the low-lying areas to about 13 feet in the areas of higher elevation and underlain by greenish grey silty clay layer with thickness varying from 50 to more than 150 ft. However, over some stretches in the lowest part of the beel areas, the peat is not covered and in direct contact with surface water even in the dry season of the year. Many of the canals and ponds intersect the peat and some places in the western part of the study area the peat layers are eroded and washed out by old rivers crossing the area at different times. Evidences from the shallow and deep tube well data reveal that the upper regional aquifer spreads throughout the study area which is composed of fine to medium grain sand and overlain by the greenish grey silty clay layer (Figure 6).
3. Materials and Methodology
Most of the borehole information has been collected during the peat exploration program of different mining companies during the year 2010-2011 in this region. In addition, a number of exploratory well information of this region has been taken from different old and recent reports of Geological Survey of Bangladesh (GSB) in order to increase the volume of resources for this research. Furthermore, a significant number of shallow (STW) and deep tube wells (DTW) drilling data of Gopalganj and Madaripur district has been collected from Bangladesh Water Development Board (BWDB) for lithological interpretation of the study area. A physiographical and a geomorphological map of the investigated area has been prepared by the software ArcGIS10 with the help of some published topographic sheets and geological maps of the study area in conjunction with a land use map, elevation contour map and a digital terrain model.
The DTM (Digital Terrain Model) (Figure 7(B)) survey has been conducted by collecting the elevations of the land surface using total station, leveling machine and DGPS supported by high resolution satellite images. Three topographic models namely Background Model (BMODEL), Artificially Raised Area Model (AMODEL) and Ponds and Watercourses Model (PMODEL) were developed using the surveyed datasets. Survey data of low lying areas were used in the BMODEL. On the other hand, data on the crest edge around raised areas and toes were used to develop the AMODEL while data on the outlines of ponds and watercourses, and raised periphery (if any) were used to develop the PMODEL. The three models are useful for conducting feasibility studies and establishing a sustainable environment for exploring peat in this area [16] . Landsat TM (2011) satellite image (Figure 7(A)) combined with Google earth and field data have been used to develop a land use map of the study area in order to calculate the area of settlements, agricultural lands and water bodies. The data of proximate and elemental analysis of fifty peat samples have been collected from Institute of Mining, Mineralogy and Me-
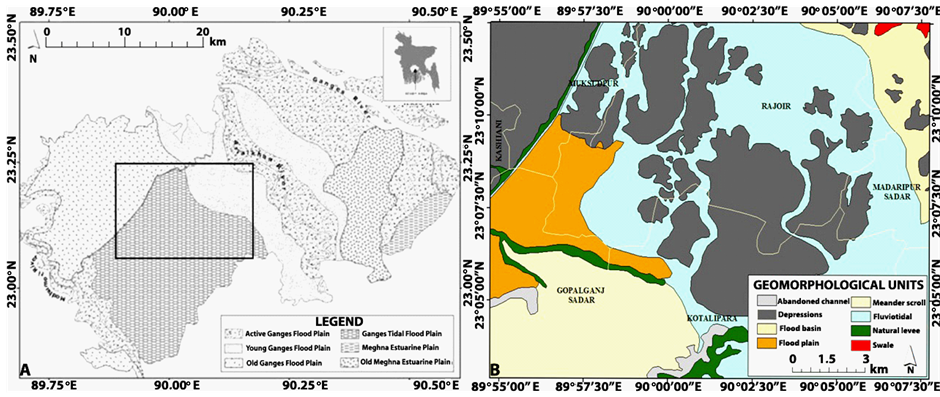
Figure 5. Physiographic map showing rectangular study area with three common physiographic subdivisions [15] (A) and Geomorphological map represents different geomorphic units of the study area (B).

Figure 6. A simple stratigraphic cross-section of the study area.

Figure 7. Landsat TM image (2011) used for preparing land use and geomorpholocal map of the study area (A) and a Digital Terrain Model (DEM), prepared by CEGIS [16] , describes BMODEL, AMODEL and PMODEL (B).
tallurgy (IMMM) of Bangladesh Council of Scientific and Industrial Research (BCSIR) at Joypurhat (Table 2).
The assessment of land use and land cover (Figure 3) has been done by adopting an unsupervised classification scheme of Landsat image for the year 2011. The software Erdas Imagine 11 has been used to prepare the land use map. In the first step of unsupervised classification, 50 classes of spectral clusters with 98% convergence of threshold value, skip factors 1 of XY and 70 iterations of processing options, approximate true color and standard deviation 1 along the principle axis of clustering have been taken that eventually separates the whole image into desired 50 classes. Subsequently, all the classes were assigned with the land classes using the spectral signature as well as the relevant field information. After the confirmation of all the class types the next and final work was recoding and masking to purify the land classes prior to analysis. This function assemblages 50 classes to desired three land classes i.e., depressions, agricultural fields and settlements, by combining several groups of clusters that represent the same land cover. Finally the accuracy assessment has been performed using the collected field data.
Considering the time, money and the process involved in collecting subsurface information, hand augur boring was the most suitable method that has been used for the exploration program. Well depth varies 20 - 22 feet; depends on the condition of the site. Some local drilling companies conducted the drilling operation under the supervision of a senior geologist assisted by a junior geologist in charge of data capture. Due to limited access, some of the drill holes had to be shifted from the planned location. The drill equipment (Figure 8(A)) consisted of 3 inch diameter spiral auger bits of 2 ft length and the holes were drilled by progressively pulling out material in 2 ft sections. Drill rods were marked with chalk to assure drilling to the correct depth for each drilling run. An appropriate procedure has been followed during sampling which include a standardized set of lithologies and material colors in order to describe the subsurface sediments, detail geological logging, comparison between two observations, proper caring of samples during collection into the airtight bags and transportation from field to laboratory (Figure 8(B)).
Actual borehole co-ordinates were recorded by handheld GPS system in the field in degrees-minutes-seconds (WGS-84 datum) and conversion to decimal degree was done in the spreadsheet. A reference mean sea level, known as PWD (Public Works Departments) datum and a vertical datum referenced to the mean sea level is referred to as SoB (Survey of Bangladesh) datum have been used in order to refer all elevation data including the ground and surface water level measurements [14] .
A number of cross sections and fence diagram have been made by Rock works 15 in order to study the following things.
Ø To locate the approximate depth of the peat layer.
Ø To determine the maximum and minimum thickness of the peat layer.
Ø To compare the peat thickness in different localities of the study area with respect to land use and geomorphological map.
Ø To assimilate the peat thickness data with the adjacent overburden deposits.
4. Results and Discussion
In order to describe the physical characters of Gopalganj-Madaripur peat and their adjacent upper and lower sediment deposits, a number of boreholes with maximum 20 feet in thickness have been selected from different geomorphological units of the study area (Figure 9). The peat layers, encountered in those selected boreholes, vary in color, depth and thickness. In general, the depressions, located in the central and the north-western part of the study area, are the most prospective region for finding thick peat deposits with a little or no overburden sediments cover, compare to the flood plains and flood basin. The average peat thickness is about 6.5 feet in the lower part of the beel area, whereas, the upper part exhibits two peat intersections with an average thickness of 5 feet and 2 feet, respectively, and separated by a blush grey silty clay deposits.
The fluviotidal unit is considered to be another potential region where two layers of peat have been found at different depth with an average thickness of 3 feet for the first layer and 2.5 feet for the second one. The overall western part, specially the flood plains and flood basin, is thought to be less prospective zone bearing either no peat intersection or maximum 2.5 feet of peat deposits with thick sediment cover ranging from 6 to 13 feet. Records from different auger holes reveal that about 95.26% of the total 800 bore holes contain peat, whereas the rest of them are non-peat bearing (Figure 10(a) & Figure 10(b)). No peat layer has been found after the depth of 17 feet. The immediate footwall of the peat is greenish grey silty clay layer, except for very few holes, in which sand was intersected in the footwall near the peat. Evidence from the data of STW (Shallow Tube well) and DTW (Deep Tube well) of this area indicates that the thickness of the greenish-grey silty clay is quite varia-

Figure 8. Different types of hand auger tools used for sampling operation in dry and wet land (A) and sampling procedure of peat and packing samples for transportation (B).
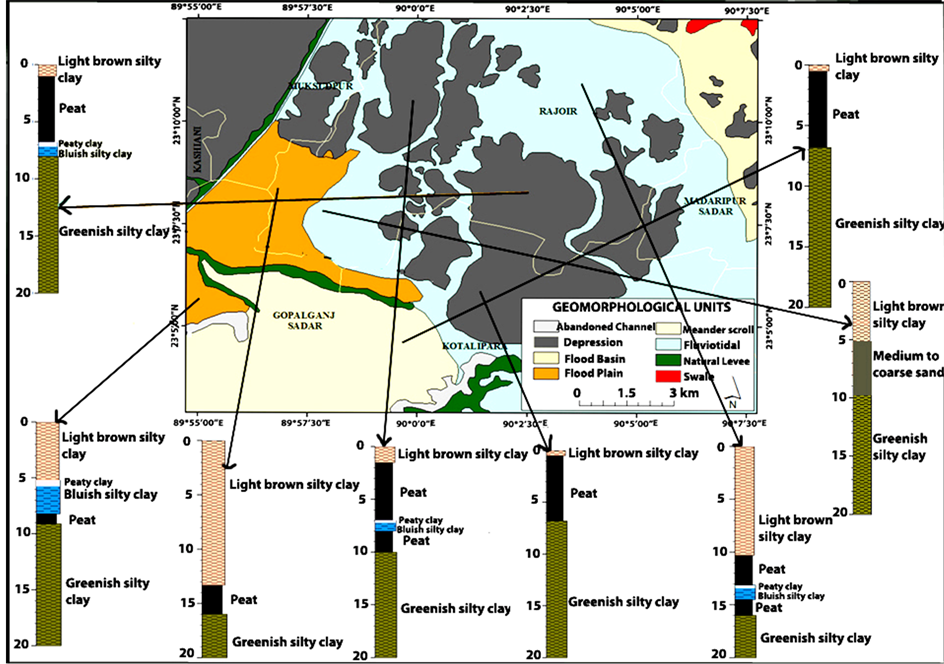
Figure 9. Single borehole lithology from different parts of the geomorphological map.
ble, ranging from 7 feet to more than 150 feet (Figure 6). A simple lithostratigraphy (Table 1) of the study area is described below.
A number of stratigraphic cross-sections have been prepared in order to study the depth and thickness of the peat deposits, and the possible overburden thickness associated with the peat from place to place. In addition, two thickness contour maps of two different peat layers have been accommodated in regard to compare and assimilate the data with different regions of the study area. A fence diagram has been used as an important part of the graphical representation in order to illustrate the extent, distribution and continuity of Gopalganj-Madaripur peat deposits.

Figure 10. The study area showing bore hole locations with cross-lines along which the cross-sections are illustrated (a) and the percentage of peat bearing and non-peat bearing boreholes among the total number (b).

Table 1. Lithostratigraphic description of the study area.
Table 2. Proximate and elemental analysis of the peat samples.
Evidence from the startigraphic cross-sections (Figure 11 & Figure 12) indicate that the central and the eastern part of the study area are the most prospective zone regarding the availability of finding thick and continuous peat deposits. In both cases, the upper peat layer is much thicker than the lower one. The thickness contour maps (Figure 13) also demonstrate that the upper peat thickness increases from west to east ranging from 0.5 feet to 7 feet and reaches the maximum thickness of 7 feet in the south-eastern part of the study area (Figure 13(A)), whereas, the lower peat layer follows the same trend ranging from 0 to 4 feet (Figure 13(B)). However, several thin peat intersections associated with thick peat layer, found in the eastern part of the study area, would suggest that a number of water courses, existed at the time of peat formation, might be responsible for the splitting of the thick peat layer into multiple thin intersections at their edges.
Similarly, a number of boreholes located in the western part of the study area contain no peat deposits but 3 - 7 feet medium to coarse grained sand and to the immediate east thereof only thin intersections of peat exhibit with the same sandy sequence. This record also suggests that the old river channels, crossed the area at various times, eroded and washed out the peat layers and has been filled up with sand during last decades.

Figure 11. Stratigraphic cross-sections along North-South direction of the study area.

Figure 12. Stratigraphic cross-sections along West-East direction of the study area.
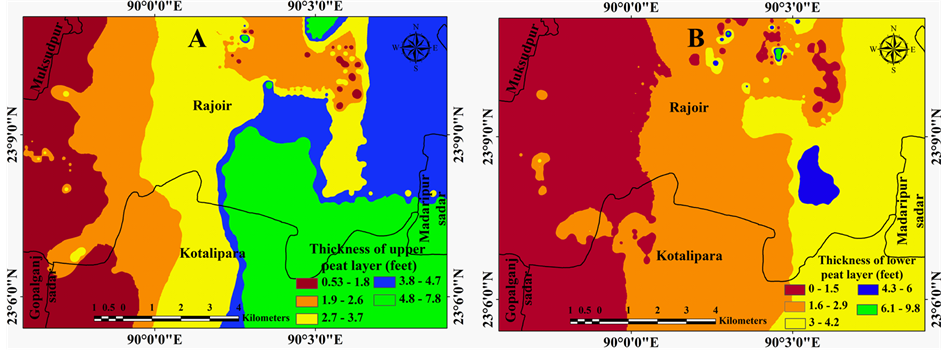
Figure 13. Thickness distribution maps for the upper peat layer (A) and the lower peat layer (B).
The fence diagram (Figure 14), covering the whole study area, represents that the highland areas, especially the north-western, the north-eastern and some middle part, exhibit maximum overburden thickness associated with thin peat deposits compare to the south-western and the south-eastern portion where thick peat deposit is overlain by a little sediment cover. A comparison of the peat thickness data with the overburden sediments showed that they are inversely correlated, i.e., the thickest intersections of peat have no or minimal overburden (up to about 1 foot), whereas the thin intersections typically have overburden thicknesses of 10 - 13 feet.
The Gopalganj-Madaripur peat deposits are considered as subtropical peat deposits which are formed in undrained, waterlogged and regularly inundated depressions. Three types of peat with distinctive physical characters have been recognized in this area which appear to correspond to stages in the development of the peat. A generalized classification of Gopalganj-Madaripur peat [2] , has been modified and described below.
1) Incipient peat, consisting of undecomposed to very slightly decomposed plant material, including large fresh-appearing roots and stems, brownish-grey in color, having coarse texture and relatively low density. This slurry like deposits have been found in the lowest part of the depressions where water remains even in the dry season.
2) Immature peat, consisting of plant materials that have been mostly reduced to translucent fibers; dark brown in color, having medium texture and medium density. Some immature brown peat occurs with remnant wood pieces, presumably roots, up to about 5 mm in diameter. This type of peat deposits occur under several feet of overburden in the upper part of the depression, as well as the outside of the beel area.
3) Mature peat, consisting of plant material that has been mostly decomposed; brownish black to greyish black in color, having fine texture and relatively high density. The completely decomposed peat deposits would be classified as sapric peat, whereas, less decomposed peat would be categorized as hemic peat. Most of the highland areas, especially the settlements and road dams, are occupied by this type of peat deposits where the overburden thickness exceeds about 10 feet or more.
The analytical experiment of 50 peat samples has been performed in the local laboratory at Institute of Mining, Mineralogy and Metallurgy (IMMM), in Joypurhat, Bangladesh. The proximate and elemental analysis of the peat samples are described in the following table (Table 2).

Figure 14. Fence diagram showing the distribution and continuity of Gopalganj-Madari- pur peat deposits and their associated sediments.
From the analysis of total 50 samples (Table 2), it has been found that the ash content of the Gopalganj-Ma- daripur peat does not exceed 8% as receive basis, whereas, the amount increases 12.44% on the average and does not exceed 17% after the reduction of moisture content from 84.10% to 65%. On the other hand, the gross calorific value improves from 594.6 kcal/kg to1308.8 kcal/kg after 20% reduction of moisture from the peat samples. In the elemental analysis, carbon content, ranging from 38.5% - 60% (average 59.8%), reflects the peat is organically rich and immature to moderately mature. Nitrogen levels, more than 3% in average, implies that the Gopalganj-Madaripur peat is likely to be developed from the decomposition of reeds, sedges and trunks of trees which are generally higher in nitrogen content, rather than moss and grass-like vegetal matter. A number of partly decomposed wood fragments found during the sampling also proof the above idea. A higher amount of sulphur, about 2.7% in average, indicates the formation of pyrite in the roots of existing vegetal matter into the fresh water which is influenced by the encroachment of saline water in land during high tide. Higher sulphur content is associated with brackish environments rather than marine where this has been related to the availability of iron [17] and in freshwater, iron is transported in organic colloids which flocculate quickly upon entering brackish water, resulting in a higher availability of iron in brackish environments [18] .
5. Conclusion
An area of approximately 17,000 hectare has been selected for this research in order to study the extent, distribution and thickness of Gopalganj-Madaripur peat deposits in Bangladesh. About 800 borehole records with the combination of a number of graphical illustrations have been used to estimate the thickness of different layers of peat and their adjacent sediments. The results confirmed that the most prospective portions of the peat deposit correlate with the depression areas where an average 6.5 feet peat deposits have been found with no or minimal overburden. The areas with thick overburden, thicknesses of about 10 - 13 feet, tend to correlate with higher ground, where settlements and road dams are concentrated. The other potential zones, especially outside of the beel areas, have a considerable amount of peat deposits with several feet of overburden covers. A number of small compartments in the western part of the study area have no peat or minimal peat thickness. This deposit is interpreted as Holocene deposits of the last few thousand years in swamps or marshes located in between Ganges and its associated distributaries which were building up levees through sand and clay sedimentation. The analytical outcome of 50 peat samples confirmed that the average percentages of Carbon, Hydrogen, Nitrogen and Sulphur as dry ash free basis are 59.8, 7.6, 3.1 and 2.7, respectively. Additionally, the peat samples have an average moisture content of 84.10%, ash percentage 5.65 as received basis and in-situ GCV of 594.6 kcal/kg, whereas, after the moisture reduction from 84.10% to 65%, the ash content rises about 12.44% and gross calorific value improves 1308.8 kcal/kg. Due to excessive demands of natural gas and coal in the rapidly growing industrial sectors in Bangladesh, these low grade fossil fuels might be useful as an alternative energy source to meet the domestic needs for the local people of the greater Faridpur region.
Acknowledgements
The authors highly acknowledge the Beximco Group of Bangladesh and the Padma Mining & Energy Corporation Limited, Dhaka, Bangladesh for assisting in data collection during the peat exploration program in the year 2010-2011. The authors also like to thank Abdul Baquee Khan Majlis, Deputy Director of Geological Survey of Bangladesh, for his support and guidance regarding maps and geological information in and outside of the study area. Finally, the authors are grateful to the Institute of Mining, Mineralogy and Metallurgy (IMMM), Joypurhat, Bangladesh, for providing information on the quality assessment of Gopalganj-Madaripur peat deposits.