1. Introduction
Pharmaceuticals are predominantly synthetic chemicals, designed to produce a pharmacological response at specific sites of action within the target organism, and require a certain chemical stability in order to reach these sites on an unaltered form. The adverse consequence of the relatively high stability of these compounds is that they are no completely removed during wastewater treatment [1] . Whereas the presence of pharmaceuticals in the natural environment has been fairly reported [2] , recent studies have shown that these compounds cause severe and uncontrollable outcomes on numerous aquatic ecosystems as well as serious and irreversible effects on the health of humans and other animal species [3] -[8] .
Ethinylestradiol (EE), one of the most commonly used pharmaceuticals, constitutes the active principle of many contraceptive agents and therapy drugs [9] [10] . The occurrence of EE, and other synthetic estrogen hormones, in natural systems, such as surface waters, soils, and sediments, has become a subject of major concern [11] . For instance, their occurrence in natural waters has been associated with critical problems such as the feminization of male fishes [12] -[15] . Effects on human health, which include a range of reproductive tract abnormalities (reduced fertility, skewed male/female sex ratios, loss of fetus, menstrual disorders), early puberty, mental and emotional illnesses, impaired immune functions, and various types of cancer, have also been directly ascribed to these compounds [16] -[19] .
Conventional water treatment processes are usually ineffective in promoting the complete depletion of recalcitrant pharmaceutical compounds. For instance, oxidation processes, which usually include the use of ozone, chlorine, and chlorine dioxide as effective oxidants, have been widely applied in treatment facilities not only for disinfection of wastewaters but also for elimination of undesired micro-pollutants from drinking water [11] [17] [20] . To surpass these drawbacks, alternative methodologies that make use of oxidative processes have been proposed [21] -[29] . Among them, heterogeneous photo-catalysis has attracted the foremost attention due to its lower cost and superior efficiency. In this process, target organic compounds are oxidized by hydroxyl radicals (∙OH), a powerful oxidizing agent generated by the decomposition of water molecules adsorbed at the catalyst surface. Moreover, several studies [30] -[32] have persistently corroborated that the application of an external electric field greatly enhances degradation rates since the high degree of charges recombination at the heterogeneous catalyst surface can be successfully solved by applying an anodic bias [31] [33] -[37] . As a consequence, photoelectrocatalysis has been effectively employed for the degradation of a number of organic pollutants, including dyes, anionic surfactants, pesticides, and microcystin toxins [38] -[44] .
At the time when sustainable development has progressively become an important issue, queries regarding environmental protection have been inserted in all human activities. In consonance with this essential matter, herein we report on the photoelectrocatalytic degradation of EE in aqueous solution on nanoporous Ti/TiO2 thinfilm electrode exposed to UV irradiation and applied potential. To assess the effectiveness of this method and to verify whether residual organic compounds could be formed under these conditions, a number of techniques were employed: HPLC, direct infusion electrospray ionization mass spectrometry (ESI-MS) and GC-MS. Aiming at detecting the residual hormone and the degradation products at quite low levels, two extraction/preconcentration procedures that precede the GC-MS analysis are evaluated: solid phase micro-extraction (SPME) and liquid-liquid extraction (LLE).
2. Experimental Section
2.1. Reagents
All the reagents used herein, EE (Organon, São Paulo, Brazil), Na2SO4 (Merck, Darmstadt, Germany), H2SO4 (Merck, Darmstadt, Germany), dichloromethane (Tedia, Fairfield, USA), acetonitrile (Tedia, Fairfield, USA), methanol (Merck, Darmstadt, Germany), were employed as received. The solutions and HPLC mobile phase were prepared using ultrapure water, which was generated via a Millipore Milli-Q system (Milford, MA, USA).
2.2. Preparation of the Ti/TiO2 Thin-Film Electrodes
Titanium (IV) isopropoxide (Aldrich) was used as a precursor for preparing TiO2 colloidal suspensions. Typically, 20 mL of titanium isopropoxide was added to a nitric acid solution keeping the ratio Ti/HNO3/H2O at 1/1.5/200. The resulting precipitate was continuously stirred until completely peptized to a stable colloidal suspension. This suspension was dialyzed against ultrapure water (Milli-Q Millipore) to a pH of 3.5 by using a Micropore 3500 MW cut off membrane. Thin-film photo-electrodes were dip-coated onto a titanium foil back contact (0.05 or 0.5 mm thick, Goodfellow Cambridge Ltd.), after heating the Ti foils at 350˚C. A sequence of dipping, drying and firing at 450˚C for 30 min were used after each coating (five repetitions), according to a procedure previously described [45] .
2.3. Techniques Employed to Characterize the Electrodes
The morphological analysis of the Ti/TiO2 surface was performed by Field Emission Gun-Scanning Electron Microscopy (FEG-SEM) with field emission source of electrons (instrument: JEOL; model: JSM-7500-F). The surface was also characterized by X-ray powder diffraction (XRD) with a Siemens D5000 diffractometer (CuKα radiation, λ = 1.541 Å), using a curved graphite monochromator, and a fix divergence slit of 1/8˚ in a BraggBrentano configuration. The electrode was electrochemically characterized by linear scan voltammetry using a reactor and Na2SO4 at 0.10 mol∙L−1 as supporting electrolyte. The reactor was submitted to irradiation of 150 W by Xe lamps (Oriel), corresponding to the ultraviolet region. The electrochemical reactor is composed of a counter-electrode (Pt gauze), a reference electrode (Ag/AgCl plus saturated KCl) and a working electrode (Ti/TiO2).
2.4. Photoelectrocatalytic System and Degradation Procedure
The photoelectrocatalytic oxidation experiments were performed in a 250 mL reactor equipped with water refrigeration using an ultra-thermostatic bath (Nova Técnica, Brazil). In the cell, the reference electrode was connected to the working electrode using a bridge tube containing a Vycor frit tip. The photoactive area of the anode (TiO2) was 12 cm2 and it was illuminated with the UV light source. This lamp was placed in the center of the quartz sleeve (2.5 cm away from the anode). The anode was tested during 6 months of application on the photoelectrocatalytic oxidation with loss of 5% of activity. A potentiostat/galvanostat (EG & G PARC, model 283) controlled by the electrochemical 270 software was used to bias the anode in the photoelectrocatalytic oxidation experiments.
Samples of EE solution (200 mL) at 0.34 mmol in water-methanol 10:1 v/v containing Na2SO4 (0.1 mol∙L−1) at pH 2 (achieved by adding small quantities of H2SO4 0.1 mol∙L−1) was put into the photoelectrocatalytic reactor of one compartment. Aliquots were taken at assorted intervals (from 5 to 150 minutes) and stored in a refrigerator (at −10˚C) for posterior analysis using HPLC and GC-MS. A mixture of methanol and water was used as solvent to improve the solubility of EE.
2.5. Extraction Procedures
For the GC-MS analyses, two extraction procedures were evaluated: liquid-liquid extraction (LLE) and solidphase microextraction (SPME). The LLE was performed by mixing 0.5 mL of a reaction aliquot and 0.5 mL of dichloromethane followed by vortex (Phoenix, Araraquara, Brazil) stirring for 30 seconds. The organic phase was isolated and the aqueous layer submitted to two extra extraction cycles. The organic extracts were combined and the solvent evaporated. Then, 1 mL of dichloromethane was added to the raw extract.
The manual SPME holder with the CAR/PDMS (carboxen/polydimethylsiloxane) or DVB/CAR/PDMS (divinylbenzene/carboxen/polydimethylsiloxane) fibers were purchased from Supelco (Bellefonte, PA, USA). Prior to use, the fibers were conditioned following the manufacturer’s instructions. The fibers were immersed into the solutions (prepared by diluting the aliquots 100 times with MilliQ water) for 10 min at ambient temperature (25˚C) and then introduced into the GC inlet to allow thermal desorption of the analytes.
2.6. Instruments
HPLC analysis were performed on an SPD-M10A VP instrument (Shimadzu, Kyoto, Japan) using a Hypersil C18 column (250 mm long, 4.6 mm i.d., 5 µm particle size) and acetonitrile/H2O (1:1) as mobile phase. The isocratic elution was maintained at a flow rate of 1 mL∙min−1 for the 10 min chromatographic runs. The injection volume was 20 µL and the UV detector was set at 210 and 280 nm wavelengths.
ESI-MS analysis were conducted on a LCQFleet (ThermoScientific, San Jose, CA) mass spectrometer bearing an electrospray ionization (ESI) source and operating in the negative ion mode. Mass spectra were obtained as an average of 50 scans, each one requiring 0.02 s. The samples (aliquots withdrawn from the reactor) were directly infused into the ESI source at a flow rate of 25 µL∙min−1 by means of a 500-μL microsyringe (Hamilton, Reno, NV). The ESI source conditions were as follows: heated capillary temperature of 285˚C, sheath gas (N2) flow rate at 20 (arbitrary units), spray voltage of 5.0 kV, capillary voltage of −38 V, tube lens offset voltage of −110 V.
GC-MS analysis were conducted on a gas chromatograph (Trace GC Ultra) coupled to an ion trap mass spectrometer (POLARIS Q) from ThermoElectron Corporation (San Jose, CA, USA). A HP-5MS (Agilent, Santa Clara, CA) capillary column (30 m × 0.25 mm i.d. × 0.25 µm film) containing 5% diphenyl and 95% dimethylpolysiloxane was used. The injector was operated in the splitless mode (for 2 min) under a temperature of 250˚C. The oven temperature program was as follows: 120˚C (holding time 2 min) with an increment of 10˚C∙min−1 up to 290˚C (holding time 10 min) and finishing with an increase of 10˚C∙min−1 up to 300˚C for 2 minutes. The total run time was 27 minutes and helium was used as carrier gas at a constant flow of 1.5 mL∙min−1. Other typical mass spectrometer parameters were as follows: electron ionization at 70 eV, full scan mode with a mass range of 50 - 200, and a source temperature of 200˚C.
3. Results and Discussion
3.1. Electrode Characteristics
FEG-SEM images obtained for the Ti/TiO2 material are illustrated in Figure 1. The top view FEG-SEM micrographs clearly show that the morphology of the surface material is characterized by the presence of roughness due to a nanoporous formation consisting of particles with sizes close to 100 nm. These are better visualized in the image captured using increased resolution. The XRD pattern obtained for the electrode annealed at 450˚C (not shown) revealed the presence of a mixture of the two forms of TiO2 (anatase and rutile) in its composition. The peaks at 25.4˚ and 48.2 are identified as (101) and (200) of the anatase form and the peaks at 17.5; 36.2 and 54.4 are due to the rutile phase (110, 101 and 211 of the crystallites. The other peaks at 35, 38, 40, 52, 63, 70, 76 and 77 are due to the metal Ti.
Figure 2 illustrates the photoactivity of the Ti/TiO2 electrode verified by recording linear voltammetric curves (0.001 V∙s−1) in Na2SO4 0.1 mol∙L−1 under two different conditions: in the absence (a) and presence (b) of UV irradiation. The current intensity was negligible in dark conditions (curve a) but underwent a remarkable increase under irradiation at a potential higher than −0.2 V, with maximum values of current (200 µA∙cm−2) at potentials higher than 1 V vs Ag/AgCl (curve b). As calculated from onset potential measurements, the flat-band
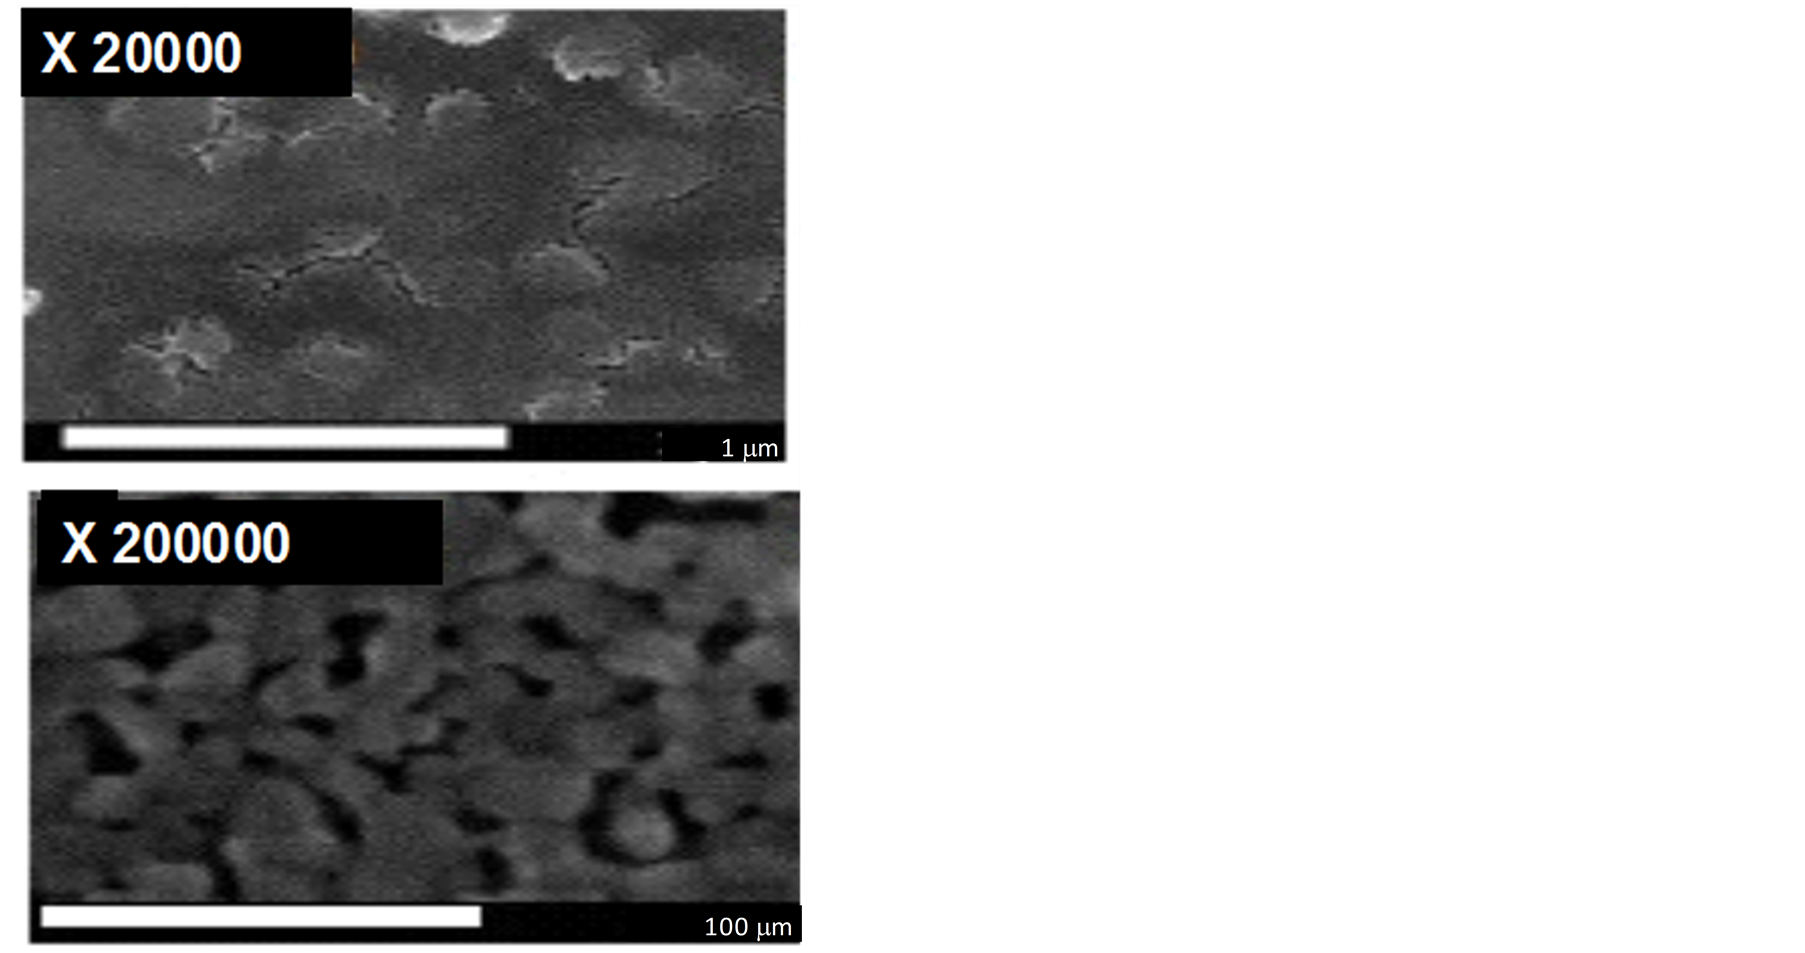
Figure 1. FE-SEM images of nanoporous Ti/TiO2 thin-film electrode annealed at 450˚C (30 min) (up) and magnified image (bottom).

Figure 2. Current/potential curves (scan rate = 0.001 V∙s−1) obtained for the Ti/TiO2 thin-film electrode in Na2SO4 0.1 mol∙L−1 and pH 2, without (a) and under UV irradiation (b).
potential obtained for the TiO2 in 0.1 mol∙L−1 Na2SO4 media was about −0.24 V. A bias potential positive to the flat-band potential produces a bending of the conduction band causing a more effective charge separation and increases the current (lph) that begins to flow and likely promotes a better oxidative degradation process. Thus, this behavior indicates that photo-generated electrons (e−) and holes (h+) are formed by irradiation and separated by a positive bias potential on the photo-anode, which drives the lacunas towards the surface of photo-anode and the electrons to the counter-electrode (gauze Pt). This process reduces the recombination electron/hole, increases the lifetime of ∙OH radicals generated on the surface of the photo-anode due to water oxidation and produces high current. The bias potential of 1 V was therefore chosen in the further studies.
3.2. Degradation of EE: HPLC Monitoring
To verify the efficiency of the photoelectrocatalytic system in promoting the depletion of EE and to check the formation of possible oxidation products, the reaction was firstly monitored by HPLC. Moreover, control experiments revealed that photocatalysis (conducted with no applied potential), electrochemical oxidation (with no use of UV radiation), and photolysis (with utilization of UV radiation solely) displayed negligible performance in depleting EE. Hence, a solution of EE at 0.34 mmol was submitted to the photoelectrocatalytic system for 150 min. The Na2SO4 concentration and the pH of the reaction medium were adjusted to furnish a maximum degradation rate for EE. The optimized values were 0.1 mol∙L−1 and 2, respectively. Figure 3 shows the normalized concentration of EE for several aliquots collected after successive exposure times to the optimal photoelectrocatalytic system. These data clearly demonstrated an outstanding performance of this degradation system as EE (a molecule that possess high stability and is usually unaffected by other oxidative processes [18] ) was almost completely depleted (degradation rate of 98%) after a reaction time as short as 30 min. The utilization of a supporting electrolyte (Na2SO4 at 0.1 mol∙L−1) showed to be critical since its absence caused the attainment of much inferior degradation rates (as similarly reported in reference [46] ). Although total organic carbon (TOC) data could not be obtained (due to the use of a mixture of water/methanol to assure the complete solubility of the hormone), the results from the HPLC analysis, i.e. the complete consumption of the substrate and the absence of degradation products, strongly support the assumption that EE is completely mineralized under these conditions.
3.3. Degradation of EE: ESI-MS Monitoring
Direct infusion electrospray ionization mass spectrometry in the negative ion mode, ESI(-)-MS, was also applied to monitor not only the substrate consumption but also a possible formation of polar intermediates and byproducts. In fact, direct infusion ESI-MS, because of its appealing and unique attributes, has been routinely applied to monitor an increasing number of relevant environmental processes [47] -[56] . Figure 4 displays the ESI(-)-MS of the original EE solution as well as the aliquots collected after successive times (from 0 to 150 min)
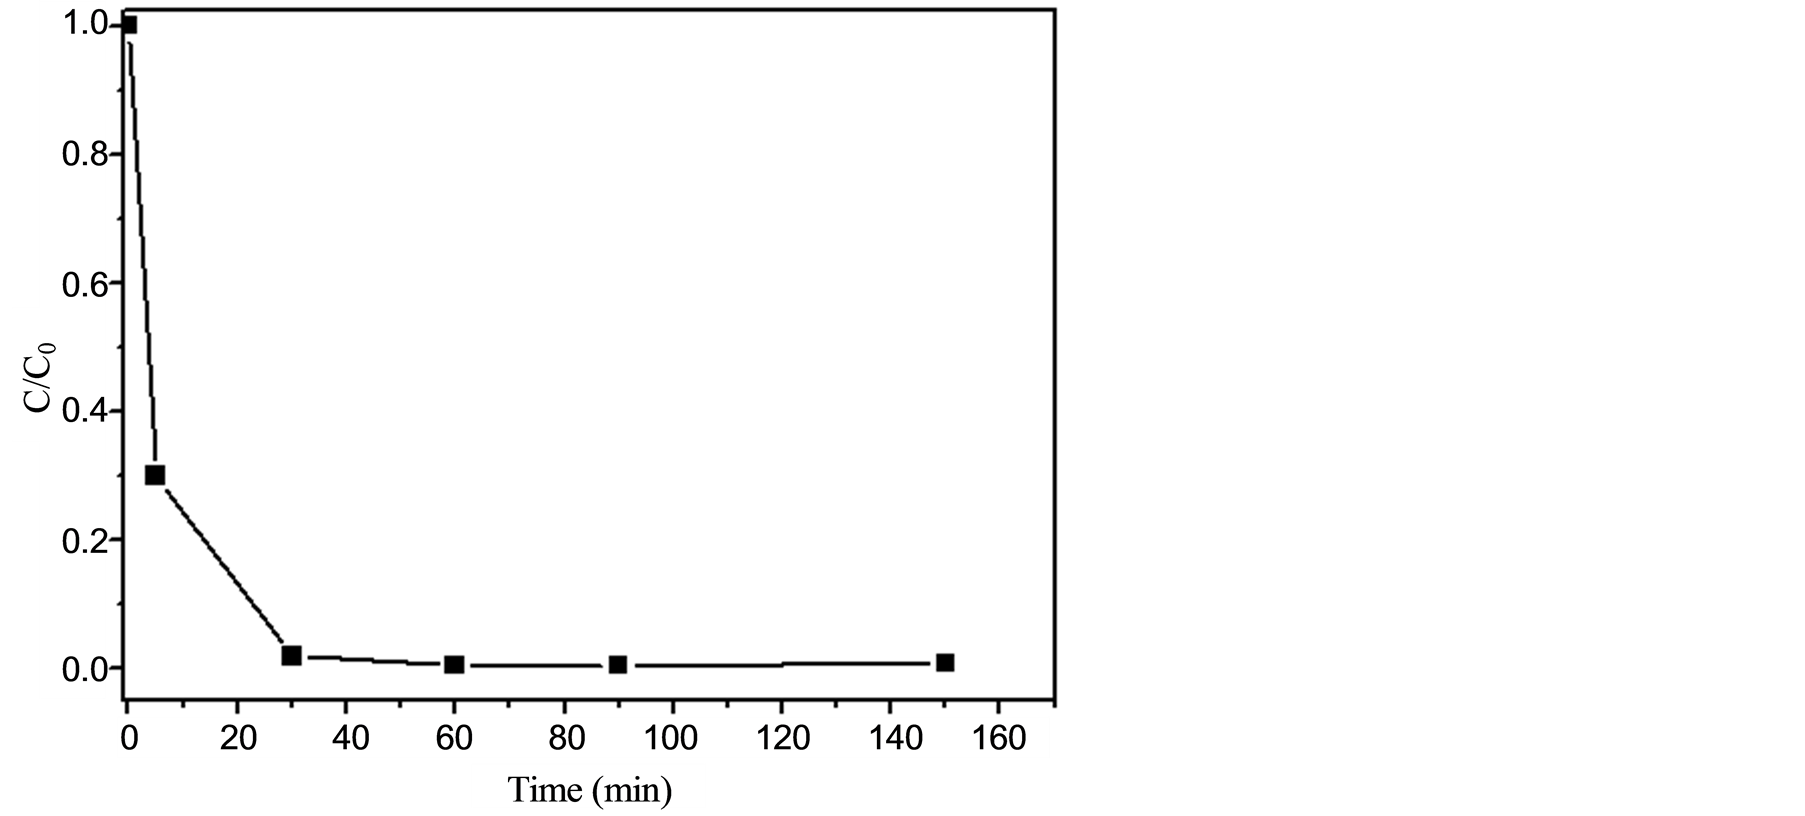
Figure 3. Normalized concentration (C/Co) of EE (inicial concentration at 0.34 mmol) in water-methanol 10:1 v/v (in the presence of Na2SO4 at 0.1 mol∙L−1 and pH 2) and of the aliquots collected after assorted times (up to 150 minutes) of exposure to the photoelectrocatalytic system.

Figure 4. ESI(-)-MS of: (a) EE solution (at 0.34 mmol) in water-methanol 10:1 v/v (in the presence of Na2SO4 at 0.1 mol∙L−1 and pH 2); (b) (c) the aliquots collected after assorted times (up to 150 minutes) of exposure to the photoelectrocatalytic system.
of exposure to the photoelectrocatalytic system. Hence, the ESI(-)-MS of the initial solution (Figure 4(a)) revealed the presence of an anion of m/z 295, ascribed to be the deprotonated form of EE, i.e. [EE-H]−. After 5 minutes, however, this anion was barely detectable thus revealing the prompt depletion of the hormone. Note the presence of spurious anions of m/z 217, 261, 403 and 545 in all the ESI(-)-MS, including the mass spectrum of the initial solution (Figure 4). Hence, rather than indicating the possible formation of degradation products, the occurrence of these anions is probably related to trace amounts of impurities in the reagents or in the instrumental apparatus.
3.4. Degradation of EE: GC-MS Monitoring
To verify whether non-polar or volatile degradation products could be formed under these conditions, GC-MS analyses were performed using two different extraction procedures: solid phase microextraction (SPME) and liquid-liquid extraction (LLE) with dichloromethane. Furthermore, the ability of GC-MS (in conjunction with SPME and LLE extraction and pre-concentration procedures) in attaining quite low detection limits for a number of analytes (including EE) was used to estimate the residual EE that remain in solution after the photoelectrocatalytic treatment. In the SPME procedure, two fibers with distinct polarities were evaluated: divinylbenzene/carboxen (DVB/CAR) and divinylbenzene/carboxen/polydimethylsiloxane (DVB/CAR/PDMS). In spite of these distinct characteristics, the extraction with both fibers led to the attainment of quite similar chromatograms. Figure 5(a) and Figure 5(b) show, respectively, the chromatograms, obtained with the DVB/CAR/PDMS fiber, of the initial solution and of the aliquot withdrawn after 30 minutes of exposure to the photoelectrocatalytic system. Note that the chromatographic peak related to EE (at a retention time of ca. 19.65 minutes) was completely vanished after treatment. Similar chromatographic profiles (not shown) were also achieved when the LLE procedure was employed. As previously verified by the HPLC and ESI-MS analysis, no degradation products could be detected as indicated by the lack of unambiguous chromatographic peaks in the chromatograms (not shown) of the aliquots collected at intermediate times (10 and 20 min). These results once more confirm the great efficiency of photoelectrocatalytic oxidation in causing the degradation and possibly mineralization of the hormone EE.
4. Conclusion
As demonstrated by the data from HPLC and ESI(-)-MS the photoelectrocatalysis approach represents an alternative method potentially applied to the degradation (and likely mineralization) of the hormone EE. This methodology displayed excellent results with degradation rates reaching 98% after a treatment time of 30 min. As revealed by GC-MS, the level of residual EE that remains in solution after the photoelectrocatalytic treatment is quite low (below its detection limit). Finally, studies are underway to verify the effectiveness of such methodology to promote the depletion of other persistent pollutants, such as some pesticides and other pharmaceuticals.
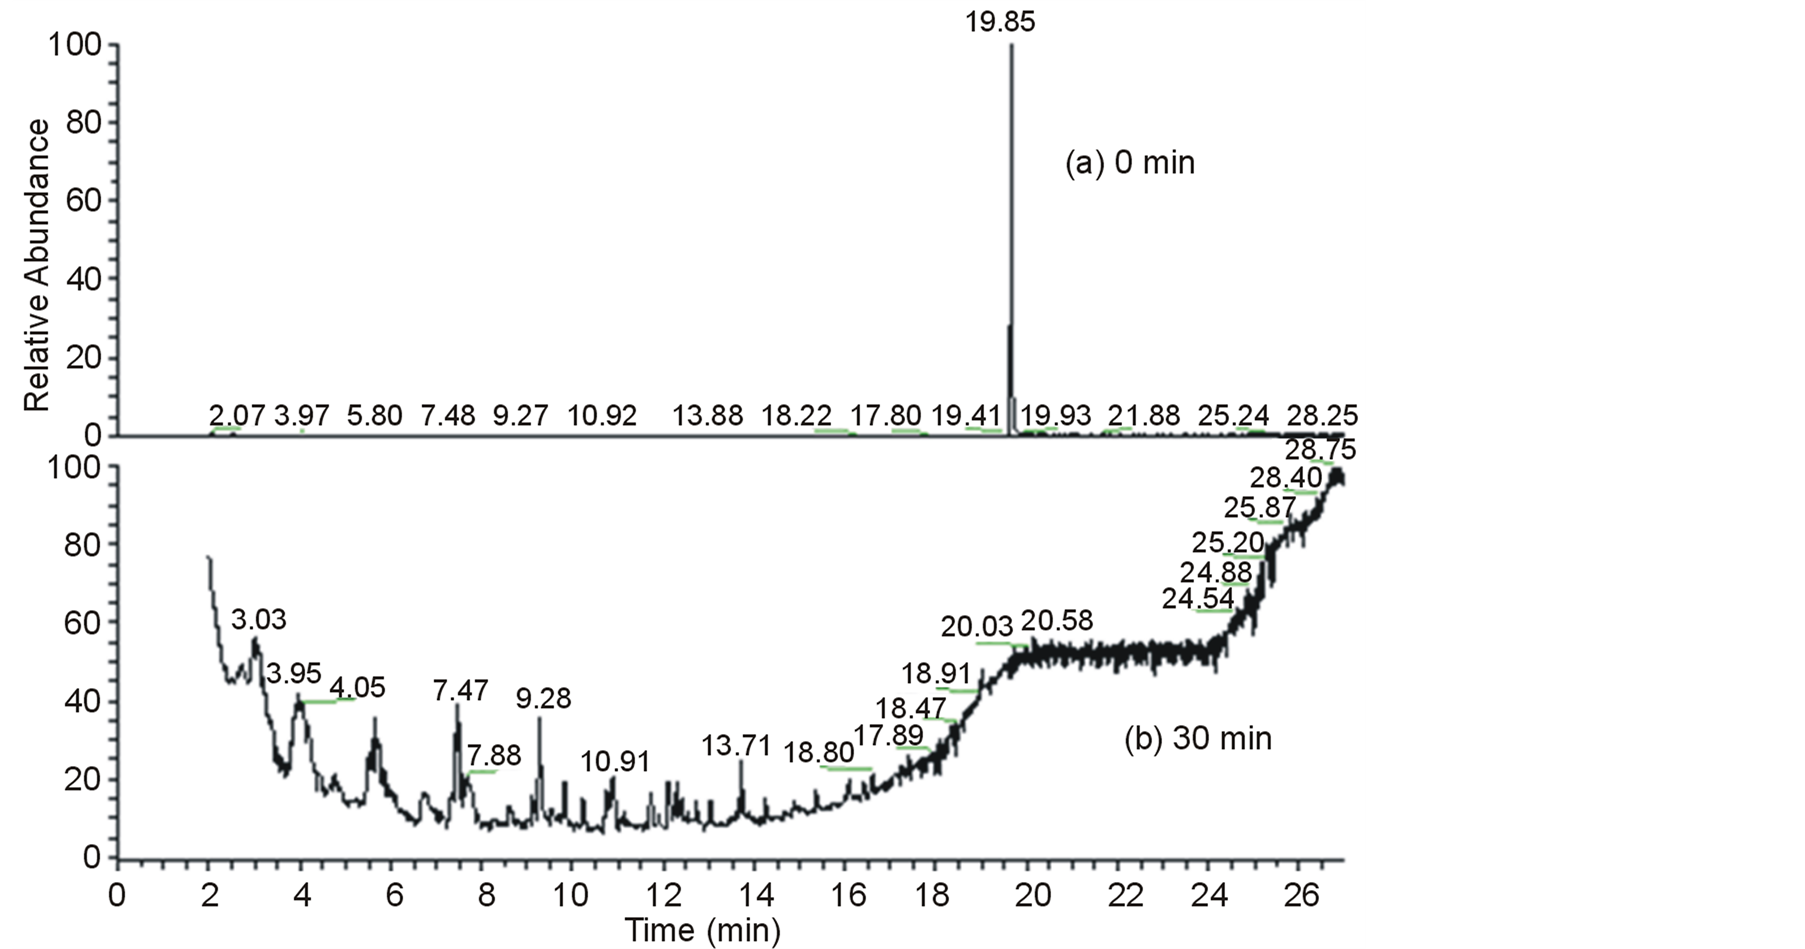
Figure 5. SPME-GC-MS (DVB/CAR/PDMS fiber) of: (a) EE solution (at 0.34 mmol) in water-methanol 10:1 v/v (in the presence of Na2SO4 at 0.1 mol∙L−1 and pH 2); (b) the aliquot collected after 30 minutes of exposure to the photoelectrocatalytic system.
Acknowledgements
The authors are grateful to the Brazilian sponsor agencies, CNPq and FAPEMIG (EDT PRONEX 479/07), for the financial support.
NOTES
*Corresponding author.